TREND LINES B/O By Vintage Trader_ The Analytical skillsThis indicator is based on trend lines breakout setup
Análise de Ondas

Smart money conceptThe indicator tracks the smallest movements of price action. It can monitor and analyze market context, attempting to identify trends within each time frame.
If a candle has its entire body above the previous swing high, it indicates a strong upward momentum. The market is leaning towards an upward direction. If the candle remains within the range of the previous swing high, it signifies weak upward momentum. The market is reluctant to move higher.
If a candle has its entire body below the previous swing low, it reflects a strong downward momentum. The market is leaning towards a downward direction. If the candle remains within the range of the previous swing low, it indicates weak downward momentum. The market is reluctant to move lower.
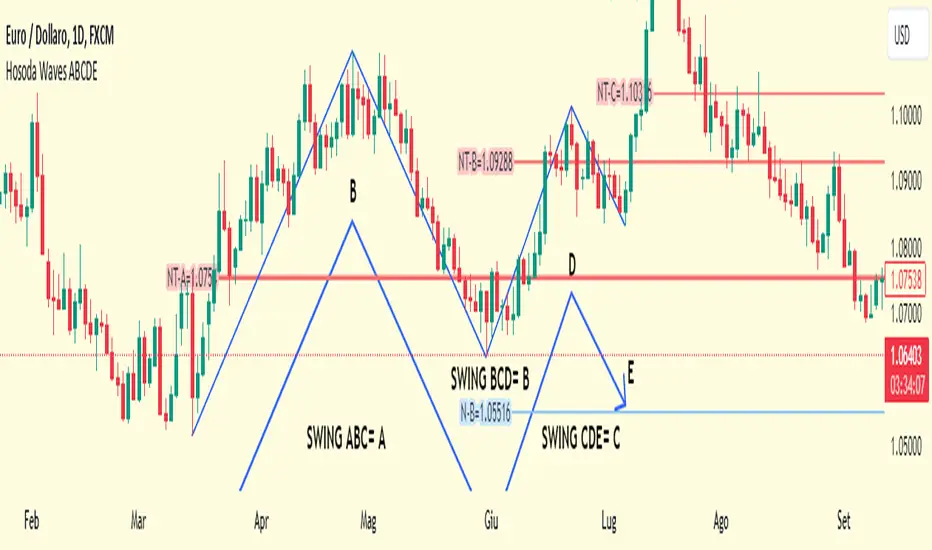
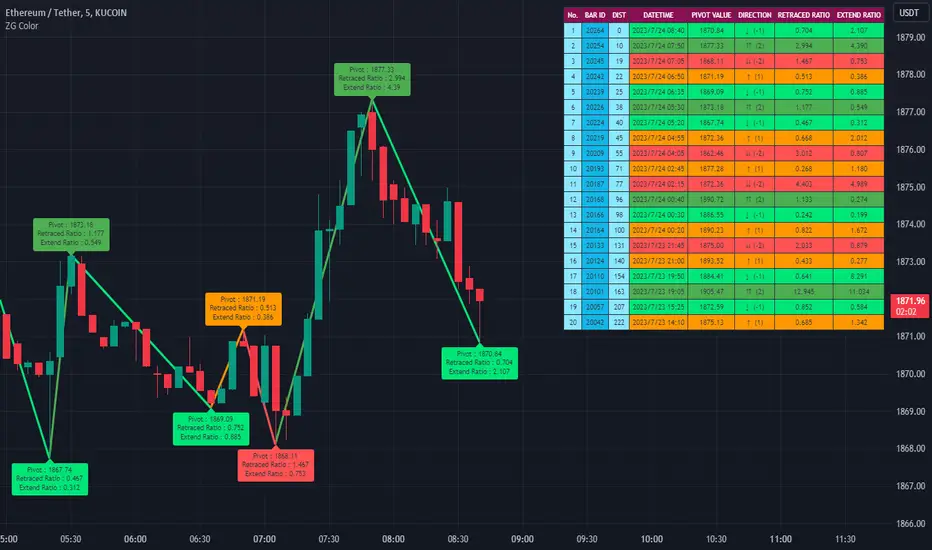
Hosoda Waves ABCDEThe Hosoda Waves indicator was devised by Goichi Hosoda, who is also the creator of the Ichimoku system, with the idea that previous highs and lows could determine future price ranges that the market would react to.
Hosoda's projections are the NT, N, V, and E waves, which are derived from calculations based on both upward and downward ABC swings.
Hosoda's waves are derived from the following calculations:
NT Wave = C + (C - A)
N Wave = B + (B - A)
V Wave = B + (B - C)
E Wave = C + (B - A)
There are already scripts for the Hosoda waves, and my idea is to project an ABCDE swing simultaneously, meaning projecting three swings:
ABC, indicated with an A, resulting in NT-A, N-A, V-A, E-A.
BCD, indicated with a B, resulting in NT-B, N-B, V-B, E-B.
CDE, indicated with a C, resulting in NT-C, N-C, V-C, E-C.
Once the indicator is applied to the chart, the interactive Pine Script tool version 5 will prompt you to identify 5 points of "low-high-low-high-low" or "high-low-high-low-high," both for upward and downward movements and mixed.
Once clicked, these price points can be moved. If you change the time frame or market instrument, the indicator must be removed because it remains tied to the prices where it was initially drawn.
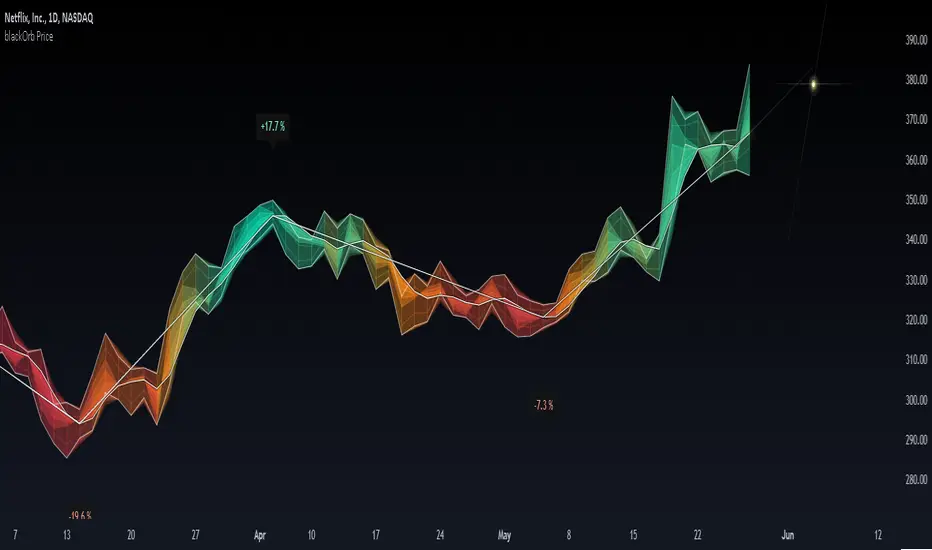
blackOrb PriceblackOrb's Aspiration: Enhancing the Functionality of Area Charts
At its core, an area chart analysis serves as the foundational structure for blackOrb Price. Area charts can be seen as an addition to conventional price charts. Unlike price line charts, which connect closing prices with lines, an area chart fills the space between high and low prices, creating a visual representation of price ranges. This approach can offer several advantages, particularly in assessing price volatility and price dynamics.
A wider area between high and low suggests high volatility, while a narrower area indicates lower volatility. The orientation of the closing price concerning the high-low range provides insights into whether buyers or sellers are exerting influence on the market.
Combined with the following elements, this chart tool can support comprehensive data-driven trading analysis:
- Integrated moving averages for price dynamic insights
- Zigzag pivot identification for price level insights
- Stochastic lookback analysis for turning point insights
- Ghost mode for comparative insights
Technical Methodology
I. Integrated Moving Averages for Price Dynamic Insights
Incorporating various MA alternatives allows traders to gain insights into not only price dynamics but also their underlying strength, which is reflected in trading activity. This strength is visually depicted by the derived price line within blackOrb's Price Area Chart.
Among the array of MA alternatives, VWMA stands out as a suitable implementation choice for integrating volume data. It goes beyond the scope of a simple moving average, considering both price and volume in its calculation, as shown in the following formula:
(C1 x V1 + C2 x V2 + ... + CN x Vn) / (V1 + V2 + ... + Vn)
II. Zigzag Pivot Identification for Price Level Insights
Zigzag Pivot Identification can be a valuable tool for recognizing possible price movements and potential turning points. It operates by pinpointing pivotal moments where prices alter their course. Essential components of this method involve comparing time units both to the left and right within a designated price dynamic phase, effectively defining the search range for pivotal points.
For instance, in the analysis below, the search is for the highest price point that hasn't been surpassed in the last 10 time units to the left and 10 time units to the right:
ta.pivothigh(10, 10)
The lookback variables analyze price points by simultaneously examining a specified number of time units before and after a potential pivot point as the central reference. A pivot is identified when a price point remains unbreached throughout this period.
Note: This method retroactively validates structures, implying that this tool may redraw or adjust its values as price data evolves. This leads to inconsistency and a lack of predictability.
III. Stochastic Lookback Analysis for Turning Point Insights
The stochastic calculation methodology of this feature centers around the following formula:
100 * (close - lowest(low, length)) / (highest(high, length) - lowest(low, length))
This key formula employs a stochastic calculation methodology that assesses the percentage deviation of the closing price from the lowest low over a specified timeframe (length), relative to the span between the highest high and the lowest low. The outcome is normalized within a range of 0 to 100, providing insights into the relative position of the closing price within the high-low range. Traders can define the specific periods over which the stochastic calculation is performed.
Based on this stochastic analysis, the indicator integrates area chart coloring, affording users the flexibility to adjust the sensitivity of area chart coloring according to customized stochastic look-back evaluation phases. Consequently, the coloration by length evaluation can mirror a comprehension of market dynamics.
Note: However, it's important to recognize that the efficacy of evaluation coloring might be compromised during periods of lateral price movement, characterized by less prominent market trends.
IV. Ghost Mode for Comparative Insights
Unveiling convergences and divergences, the Ghost Mode overlays two price charts, which can reveal price trajectories and reactions (e.g. Apple stock's potential response to the NASDAQ 100 Technology Sector Index).
Note: This approach may not capture nuanced correlations during intricate market scenarios.
Note on Usability
This tool is an intricately designed area chart, meticulously created to serve as a fundamental canvas for the seamless integration of other more granular trading indicators.
blackOrb Price can have synergies with blackOrb Candle as both indicators combined can give a bigger picture for supporting comprehensive and multifaceted data-driven trading analysis.
This indicator isn't intended for standalone trading application. Instead, it offers an alternative approach to traditional area charts, serving as a supplementary tool for orientation within broader trading strategies. Irrespective of market conditions, it can harmonize with a wider range of trading styles and instruments/trading pairs/indices like Stocks, Gold, EURUSDSPX500, GBPUSD, BTCUSD and Oil.
Inspiration and Publishing
Taking genesis from the inspirations amongst others provided by TradingView Pine Script Wizard Kodify, blackOrb Price is a multi-encompassing script meticulously forged from scratch. It aspires to furnish a comprehensive area chart approach, borne out of personal experiences and a strong dedication in supporting the trading community. We eagerly await valuable feedback to refine and further enhance this tool.
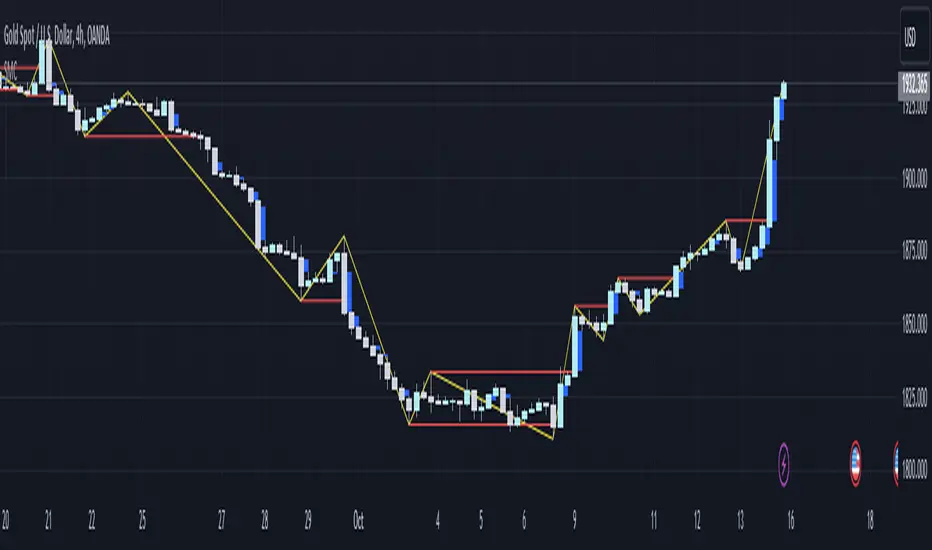
Gann swings [promuckaj]This indicator is a tool that could help the users what the market trend is at any time, based on legendary trader, Mr. William D. Gann .
Gann it self called this the “Trendline Indicator”, but modern traders call it Swing.
Gann’s primary use his techniques in correlation with this trading tool helping him achieve his phenomenal trading results.
Gann swings automatically displays the swing chart and trend on any timeframe you choose. There is option to set desired color and width of the trend line.
There is 3 types of settings to determine the swings, from 1 to 3 which represent the number of bars as confirmation for the swing bar. Default is 2.
There is labels on bars that gives information about each bar, is it up, down, inside or outside bar. This can be turned off/on.
🡱 - Up bar
🡳 - Down bar
⬍ - Outside bar
x - Inside bar
Indicator is also fully customizable to display break-out lines, which indicate potential trend changes ahead of time. There is option to choose whether you want to mark only first breaks in a row or you want all of them in case there is multiple ones in the same direction.
Gann swings is an indicator that EVERY trader and investor should have, it can provide vital information that can help to determine the trend of any market and information about the upswings and downswings.
Everyone enjoy trading !
P.S.:
I have in my mind some additional features as upgrade that can include data about each swing, like data for tops/bottoms date, time, price, range in % between swings, and bar count of each swing that is formed on the chart.

ABC on Recursive Zigzag [Trendoscope]There are several implementations of ABC pattern in tradingview and pine script. However, we have made this indicator to provide users additional quantifiable information along with flexibility to experiment and develop their own strategy based on the patterns.
🎲 Highlights of this indicator over other ABC implementations are:
Implementation is based on recursive multi level zigzag allows bigger as well as smaller patterns to be identified
Allows users to set their trading rules with respect to entry, target and stop ratios, experiment and build their own strategy based on the ABC pattern.
Back test summary including win ratio and risk reward will help users understand the profitability based on different settings being used.
🎲 Concept of ABC Pattern
The ABC pattern, also known as the "Corrective Wave" or "Zigzag Pattern," is a fundamental concept in Elliott Wave Theory, which is widely used in technical analysis to identify and predict price movements in financial markets.
The ABC pattern is a three-wave corrective pattern that typically occurs within the context of a larger impulse or trending wave. It consists of two smaller waves in the opposite direction (A and C) separated by a corrective wave (B). These waves are labeled alphabetically and represent price movements.
Wave A (Impulse Wave): Wave A is the first leg of the ABC pattern and is characterized by a strong price move in the opposite direction of the prevailing trend. It is often driven by a fundamental or sentiment-driven event that temporarily disrupts the trend.
Wave B (Corrective Wave): Wave B is the corrective wave that follows Wave A. It represents a partial retracement of Wave A's price movement. Wave B can take various forms, such as a simple correction or a complex correction (e.g., a triangle or a flat correction). It typically doesn't retrace the entire length of Wave A.
Wave C (Impulse Wave): Wave C is the final leg of the ABC pattern and is characterized by a strong price move in the same direction as the prevailing trend. It often surpasses the starting point of Wave A and confirms the resumption of the larger trend.
🎲 Indicator Components
Upon loading the indicator on the chart, we can observe the following components on the chart.
Pattern Drawings is the graphical representation of present patterns. Please note that it is not necessary for patterns to be there on the chart all the time. Patterns will appear on the chart when price makes the patterns.
Trade Box is the box representing trade signals of the pattern. These trade levels are generated based on the user settings.
Summary Table is the back test summary containing details of historical pattern performance including Win Ratio and Risk Reward.
🎲 Indicator Settings
Details of each user settings are provided in the tooltips. Below is the snapshot of it.
🎲 Alerts
Basic level of alerts are built in the script using alert function to highlight the following conditions:
New ABC Pattern
Updates to existing Pattern
Both conditions will alert simple text messages. There is not much customization provided as part of this indicator. We will consider providing more options in future versions based on the interest and demand shown by users.

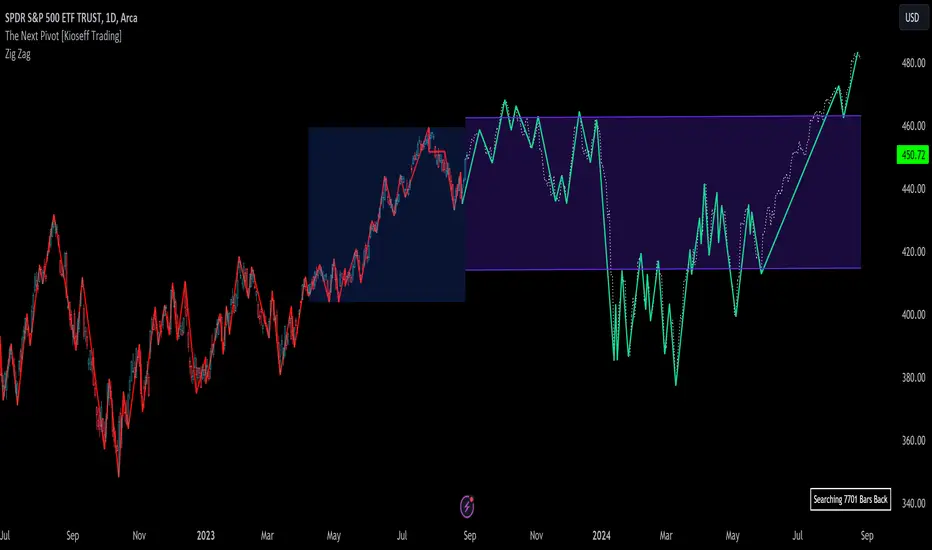
The Next Pivot [Kioseff Trading]Hello!
This script "The Next Pivot" uses various similarity measures to compare historical price sequences to the current price sequence!
Features
Find the most similar price sequence up to 100 bars from the current bar
Forecast price path up to 250 bars
Forecast ZigZag up to 250 bars
Spearmen
Pearson
Absolute Difference
Cosine Similarity
Mean Squared Error
Kendall
Forecasted linear regression channel
The image above shows/explains some of the indicator's capabilities!
The image above highlights the projected zig zag (pivots) pattern!
Colors are customizable (:
Additionally, you can plot a forecasted LinReg channel.
Should load times permit it, the script can search all bar history for a correlating sequence. This won't always be possible, contingent on the forecast length, correlation length, and the number of bars on the chart.
Reasonable Assessment
The script uses various similarity measures to find the "most similar" price sequence to what's currently happening. Once found, the subsequent price move (to the most similar sequence) is recorded and projected forward.
So,
1: Script finds most similar price sequence
2: Script takes what happened after and projects forward
While this may be useful, the projection is simply the reaction to a possible one-off "similarity" to what's currently happening. Random fluctuations are likely and, if occurring, similarities between the current price sequence and the "most similar" sequence are plausibly coincidental.
That said, if you have any ideas on cool features to add please let me know!
Thank you (:
Trig-Log Scaled Momentum OscillatorTaylor Series Approximations for Trigonometry:
1. The indicator starts by calculating sine and cosine values of the close price using Taylor Series approximations. These approximations use polynomial terms to estimate the values of these trigonometric functions.
Mathematical Component Formation:
2. The calculated sine and cosine values are then multiplied together. This gives us the primary mathematical component, termed as the 'trigComponent'.
Smoothing Process:
3. To ensure that our indicator is less susceptible to market noise and more reactive to genuine price movements, this 'trigComponent' undergoes a smoothing process using a simple moving average (SMA). The length of this SMA is defined by the user.
Logarithmic Transformation:
4. With our smoothed value, we apply a natural logarithm approximation. Again, this approximation is based on the Taylor expansion. This step ensures that all resultant values are positive and offers a different scale to interpret the smoothed component.
Dynamic Scaling:
5. To make our indicator more readable and comparable over different periods, the logarithmically transformed values are scaled between a range. This range is determined by the highest and lowest values of the transformed component over the user-defined 'lookback' period.
ROC (Rate of Change) Direction:
6. The direction of change in our scaled value is determined. This offers a quick insight into whether our mathematical component is increasing or decreasing compared to the previous value.
Visualization:
7. Finally, the indicator plots the dynamically scaled and smoothed mathematical component on the chart. The color of the plotted line depends on its direction (increasing or decreasing) and its boundary values.

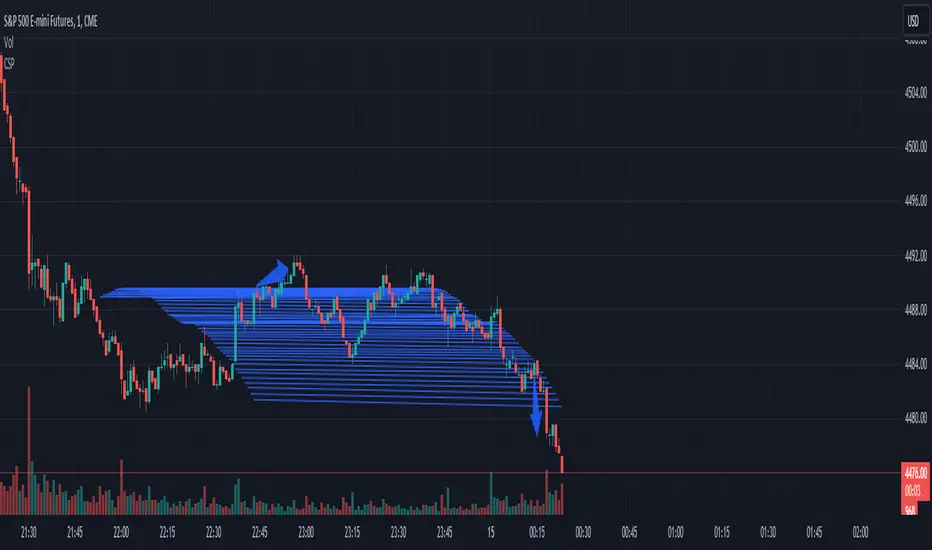
Custom SMA Plot It creates a custom indicator named "Custom SMA Plot (CSP)" that overlays on a price chart. The indicator fetches the closing prices and calculates a 14-period simple moving average (SMA) of these prices. This SMA is then visually represented as a blue line, which starts from the SMA value of the bar 100 candles ago and extends to the current bar's SMA value. The line has a thickness of 1 unit.
When price breaks over wave go long.
When price breaks below wave go short.
Elliott Wave with Supertrend Exit - Strategy [presentTrading]## Introduction and How it is Different
The Elliott Wave with Supertrend Exit provides automated detection and validation of Elliott Wave patterns for algorithmic trading. It is designed to objectively identify high-probability wave formations and signal entries based on confirmed impulsive and corrective patterns.
* The Elliott part is mostly referenced from Elliott Wave by @LuxAlgo
Key advantages compared to discretionary Elliott Wave analysis:
- Wave Labeling and Counting: The strategy programmatically identifies swing pivot highs/lows with the Zigzag indicator and analyzes the waves between them. It labels the potential impulsive and corrective patterns as they form. This removes the subjectivity of manual wave counting.
- Pattern Validation: A rules-based engine confirms valid impulsive and corrective patterns by checking relative size relationships and fib ratios. Only confirmed wave counts are plotted and traded.
- Objective Entry Signals: Trades are entered systematically on the start of new impulsive waves in the direction of the trend. Pattern failures invalidate setups and stop out positions.
- Automated Trade Management: The strategy defines specific rules for profit targets at fib extensions, trailing stops at swing points, and exits on Supertrend reversals. This automates the entire trade lifecycle.
- Adaptability: The waveform recognition engine can be tuned by adjusting parameters like Zigzag depth and Supertrend settings. It adapts to evolving market conditions.
ETH 1hr chart
In summary, the strategy brings automation, objectivity and adaptability to Elliott Wave trading - removing subjective interpretation errors and emotional trading biases. It implements a rules-based, algorithmic approach for systematically trading Elliott Wave patterns across markets and timeframes.
## Trading Logic and Rules
The strategy follows specific trading rules based on the detected and validated Elliott Wave patterns.
Entry Rules
- Long entry when a new impulsive bullish (5-wave) pattern forms
- Short entry when a new impulsive bearish (5-wave) pattern forms
The key is entering on the start of a new potential trend wave rather than chasing.
Exit Rules
- Invalidation of wave pattern stops out the trade
- Close long trades on Supertrend downturn
- Close short trades on Supertrend upturn
- Use a stop loss of 10% of entry price (configurable)
Trade Management
- Scale out partial profits at Fibonacci levels
- Move stop to breakeven when price reaches 1.618 extension
- Trail stops below key swing points
- Target exits at next Fibonacci projection level
Risk Management
- Use stop losses on all trades
- Trade only highest probability setups
- Size positions according to chart timeframe
- Avoid overtrading when no clear patterns emerge
## Strategy - How it Works
The core logic follows these steps:
1. Find swing highs/lows with Zigzag indicator
2. Analyze pivot points to detect impulsive 5-wave patterns:
- Waves 1, 3, and 5 should not overlap
- Waves 3 and 5 must be longer than wave 1
- Confirm relative size relationships between waves
3. Validate corrective 3-wave patterns:
- Look for overlapping, choppy waves that retrace the prior impulsive wave
4. Plot validated waves and Fibonacci retracement levels
5. Signal entries when a new impulsive wave pattern forms
6. Manage exits based on pattern failures and Supertrend reversals
Impulsive Wave Validation
The strategy checks relative size relationships to confirm valid impulsive waves.
For uptrends, it ensures:
```
Copy code- Wave 3 is longer than wave 1
- Wave 5 is longer than wave 2
- Waves do not overlap
```
Corrective Wave Validation
The strategy identifies overlapping corrective patterns that retrace the prior impulsive wave within Fibonacci levels.
Pattern Failure Invalidation
If waves fail validation tests, the strategy invalidates the pattern and stops signaling trades.
## Trade Direction
The strategy detects impulsive and corrective patterns in both uptrends and downtrends. Entries are signaled in the direction of the validated wave pattern.
## Usage
- Use on charts showing clear Elliott Wave patterns
- Start with daily or weekly timeframes to gauge overall trend
- Optimize Zigzag and Supertrend settings as needed
- Consider combining with other indicators for confirmation
## Default Settings
- Zigzag Length: 4 bars
- Supertrend Length: 10 bars
- Supertrend Multiplier: 3
- Stop Loss: 10% of entry price
- Trading Direction: Both

Price by Volume ColumnsThis indicator allows you to identify how price changes for a given time period are sensitive to the volume. You will identify these changes as bars in the bottom of the chart. You may see the changes in bars for better understanding of price movements, identify trends. Please take trades at your own risk and discretion

SRTL, 2EMA & TRAMASRTL - Support Resistance and Trend Line with Double EMA and TRAMA
The SRTL indicator is a powerful tool for technical analysis that seamlessly integrates support and resistance levels, trend lines, and moving average signals. It offers traders a comprehensive view of the market's dynamics, making it a valuable addition to any trading toolkit. Here's a concise summary of its key features and functionalities:
Key Features:
- Dynamic Support and Resistance Levels based on Pivot Points
- Trend Lines based on Recent Pivot Points
- Double Exponential Moving Averages (EMA) with adjustable lengths
- Trend Regularity Adaptive Moving Average (TRAMA) for trend identification
- Buy and Sell signals based on the crossover of EMAs
The indicator is composed of 4 main components:
1. Support and resistance levels: The indicator calculates support and resistance levels based on pivot points and a channel width parameter. These levels can be used to identify potential entry and exit points for trades. The script calculates and plots dynamic support and resistance levels based on pivot points. Users can adjust the period for calculating pivot points, loopback period, and S/R strength to customize the levels' sensitivity.
2. Trend Lines: The script identifies and plots trend lines based on recent pivot points. Users can customize the number of pivot points to consider and the start date to begin plotting the trend lines. The script identifies and plots trend lines based on recent pivot points. By adjusting the number of pivot points to consider and the start date, traders can visualize potential trends and assess the market's overall direction. This feature helps traders understand the prevailing market sentiment and make informed trading decisions.
3. Double Exponential Moving Averages (EMA): The script calculates and plots two Exponential Moving Averages (EMA) with customizable lengths. A crossover of these EMAs can be used as a signal for potential trend changes. The study calculates and displays two Exponential Moving Averages (EMA) with adjustable lengths. The crossover of these EMAs serves as a crucial signal for potential trend changes. When the faster EMA crosses above the slower EMA, a "Buy" signal is generated, and when the faster EMA crosses below the slower EMA, a "Sell" signal is generated.
4. Trend Regularity Adaptive Moving Average (TRAMA): The script calculates and plots the TRAMA, a unique adaptive moving average that helps identify trends and adapt to market conditions. The indicator includes the Trend Regularity Adaptive Moving Average (TRAMA), an adaptive moving average designed to identify trends and adapt to varying market conditions. TRAMA helps traders gauge the strength of a trend and provides valuable insights into potential trend reversals.
5. Signals: The script generates "Buy - Green" and "Sell- Red" signals based on the crossover of the two EMAs and Pivot Point Trend Levels. That Also Customizable.
How to Use:
The SRTL indicator is a powerful tool for technical analysis, offering multiple layers of information for traders. When the price approaches dynamic support or resistance levels, The dynamic support and resistance levels are based on pivot points and adjust to the market's current conditions. The trend lines help visualize potential trends and can be adjusted to show different numbers of pivot points. Additionally, the Double EMA and TRAMA lines provide further insight into the market's momentum and potential reversals. Traders can assess the potential for trend reversals or breakouts. The trend lines help visualize the market's prevailing direction, and the crossover of the Double EMA signals potential entry and exit points.
Traders should use this study as part of a broader trading strategy and combine it with other technical indicators, fundamental analysis, and risk management techniques. Additionally, it's essential to test the indicator thoroughly in a demo or back testing environment before applying it to live trading to ensure its compatibility with individual trading styles and preferences.

Price Deviation Indicator (PDI)Management
The Price Deviation Indicator (PDI) was developed by "DimArt". This indicator allows you to determine the percentage deviation of the price from its average value over a certain period of time. The larger the deviation, the higher the histogram on the indicator chart. The PDI indicator can be useful for identifying a trend reversal in combination with other technical indicators, such as RSI, MACD, and others. For example, if the RSI and MACD indicators show the beginning of a possible trend reversal, using the PDI indicator can confirm this signal by showing the deviation of the current price from the average price. This can help the trader make more accurate trading decisions based on a strong signal.
Description
To calculate the values of the "Price Deviation Indicator" (PDI), we use the following steps:
• Determine the "Period" variable, which specifies the number of bars used to calculate the average price. (Default value is 20)
• Calculate the average price over the specified period using the "sma()" (simple moving average) function.
• Calculate the percentage difference between the current price and the average price using the formula: ((close - avg_price) / avg_price) * 100 .
• Set levels to change the color of the histogram based on price deviation from the average value. "Histogram Color" is a parameter to customize the color of the histogram based on deviation levels. By default, if the deviation is more than 5%, the histogram will be red; if it is less than -5%, it will be green, and for all other deviations, it will be blue. However, this parameter can be changed to other values.
• Draw a histogram of price change relative to the average value. The "Style" parameter allows you to choose the style of the indicator (histogram). By default, the "Histogram" style is set, but you can also select "Line on Close" or "Line on Open".
Application of the Indicator
The PDI indicator is based on the assumption that the price of any asset always tends to its mean value. Using PDI on higher timeframes allows you to determine the overall market trend, whereas on smaller timeframes, situations can be found when the price is in negative territory, and the histogram starts to smoothly transition from negative to positive value. This can be a signal to buy, as the price is likely in an oversold condition and ready to change its trend. On the other hand, if the strength of the price slows down or begins to approach 0, this may indicate that the asset is overbought and starting to turn towards oversold, which is a signal to sell. A beautiful feature of the PDI indicator is its simplicity and conciseness, which allows you to quickly and easily identify a trend change and make trading decisions based on a strong signal.
Conclusion
The "Price Deviation Indicator" (PDI) can be useful in analyzing price movements in the market. It allows you to calculate the relative difference between the current price and the average price, allowing you to identify market saturation and change in trend. The indicator can be used in technical analysis to make decisions about buying or selling assets on the exchange. It can also be useful for traders of different levels of experience, as its settings can be adapted depending on the user's needs and requirements. Overall, this indicator is one of the tools that can help in analyzing price and volumes to determine possible investment prospects in assets.

Zigzag Trend-based Color [SteinG]Zigzag Indicator with Trend-based Color Coding and Info Table
This indicator is forked from Trendoscope's Recursive Zigzag
The Zigzag Indicator with Trend-based Color Coding and Info Table is a powerful tool for technical analysis, designed to help you identify significant price swings, visualize trends, and analyze pivot points with ease. This advanced indicator offers enhanced functionalities and improved visual representation.
The primary purpose of the Zigzag Indicator is to identify and highlight important price reversals, commonly referred to as pivot points, in a given chart. These pivot points are essential in recognizing trend changes and potential market turning points. With the Zigzag Indicator, you can quickly identify these pivotal moments and gain valuable insights into market dynamics.
One of the standout features of this indicator is the color coding applied to the Zigzag line, which intuitively reflects the trend associated with each pivot point. The color scheme is as follows:
- Green : Indicates an upward trend, representing a bullish movement in the price.
- Lime : Represents a retracement during an upward trend, indicating a temporary pullback before the uptrend resumes.
- Red : Signifies a downward trend, indicating a bearish movement in the price.
- Orange : Represents a retracement during a downward trend, indicating a temporary bounce before the downtrend resumes.
This color coding allows you to easily visualize the prevailing market sentiment and make more informed trading decisions accordingly.
In addition to the visual representation, the Zigzag Indicator also includes an informative table that provides essential details about each pivot point. The table presents the following information for each pivot point:
1. Pivot Value : The price level at which the pivot point occurs.
2. Direction : Indicates whether the pivot point represents an upward or downward trend.
3. Fibo Ratios : Displays the Fibonacci retracement levels between two consecutive pivot points, offering insights into potential support and resistance levels.
The inclusion of this comprehensive info table enables you to analyze pivot points more effectively, understand the underlying price dynamics, and identify key trading opportunities.
MACD Fake Filter [RH]Introducing a new indicator for the TradingView community based on the MACD indicator! This innovative tool goes beyond traditional MACD signals by analyzing positive and negative waves to determine the average height of the waves to filter false cross-over or cross-under signals during the sideways market.
There are two types of waves created by the MACD line, one is a positive wave above the "zero" line and another is a negative wave below "zero" line. Each wave has peaks. This indicator will find the average height of the positive waves' peaks and plot as a green line(by default). Vice-versa it will also find the average height of the negative waves' peaks and plot as a red line(by default).
Example :
This indicator will show labels when the MACD line crosses-under the MACD signal line above the average height of the positive waves.
Vice-versa, the indicator will show labels when the MACD line crosses-above the MACD signal line below the average height of the negative waves.
Example:
Alerts are also available for these types of cross-over and cross-under.

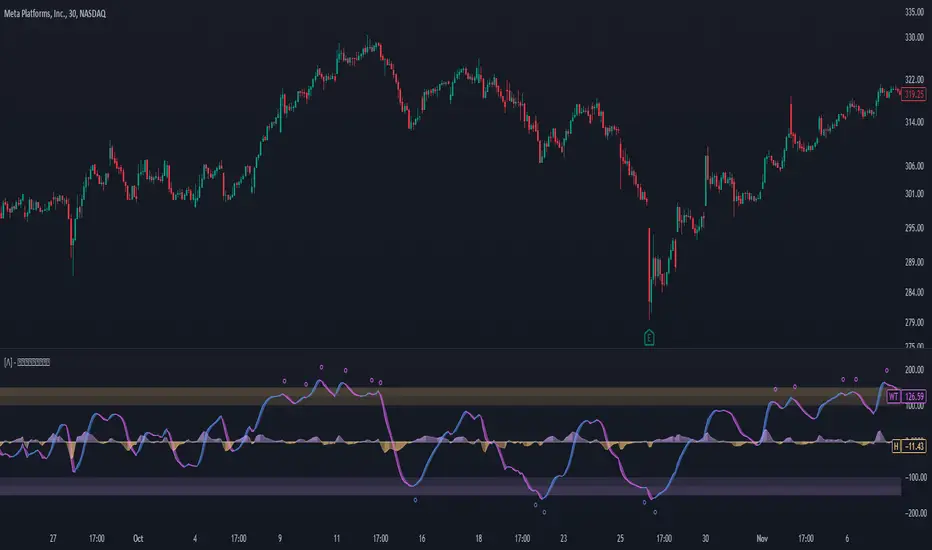
Enhanced WaveTrend OscillatorThe Enhanced WaveTrend Oscillator is a modified version of the original WaveTrend. The WaveTrend indicator is a popular technical analysis tool used to identify overbought and oversold conditions in the market and generate trading signals. The enhanced version addresses certain limitations of the original indicator and introduces additional features for improved analysis and comparison across assets.
WaveTrend:
The original WaveTrend indicator calculates two lines based on exponential moving averages and their relationship to the asset's price. The first line measures the distance between the asset's price and its EMA, while the second line smooths the first line over a specific period. The result is divided by 0.015 multiplied by the smoothed difference ('d' for reference). The indicator aims to identify overbought and oversold conditions by analyzing the relationship between the two lines.
In the original formula, the rudimentary estimation factor 0.015 times 'd' fails to accomodate for approximately a quarter of the data, preventing the indicator from reaching the traditional stationary levels of +-100. This limitation renders the indicator quantitatively biased, as it relies on the user's subjective adjustment of the levels. The enhanced version replaces this factor with the standard deviation of the asset's price, resulting in improved estimation accuracy and provides a more dynamic and robust outcome, we thereafter multiply the result by 100 to achieve a more traditional oscillation.
Enhancements and Features:
The enhanced version of the WaveTrend indicator addresses several limitations of the original indicator and introduces additional features-
Dynamic Estimation: The original indicator uses an arbitrary estimation factor, while the enhanced version replaces it with the standard deviation of the asset's price. This modification provides a more dynamic and accurate estimation, adapting to the specific price characteristics of each asset.
Stationary Support and Resistance Levels: The enhanced version provides stationary key support and resistance levels that range from -150 to 150. These levels are determined based on the analysis of the indicator's data and encompass more than 95% of the indicator's values. These levels offer important reference points for traders to identify potential price reversals or significant price movements.
Comparison Across Assets: The enhanced version allows for better comparison and analysis across different assets. By incorporating the standard deviation of the asset's price, the indicator provides a more consistent and comparable interpretation of the market conditions across multiple assets.
Upon closer inspection of the modification in the enhanced version, we can observe that the resulting indicator is a smoothed variation of the Z-Score!
f_ewave(src, chlen, avglen) =>
basis = ta.ema(src, chlen)
dev = ta.stdev(src, chlen)
wave = (src - basis) / dev * 100
ta.ema(wave, avglen)
Z-Score Analysis:
The Z-Score is a statistical measurement that quantifies how far a particular data point deviates from the mean in terms of standard deviations. In the enhanced version, the calculation involves determining the basis (mean) and deviation (standard deviation) of the asset's price to calculate its Z-Score, thereafter applying a smoothing technique to generate the final WaveTrend value.
Utility:
The 𝗘𝗻𝗵𝗮𝗻𝗰𝗲𝗱 𝗪𝗧 indicator offers traders and investors valuable insights into overbought and oversold conditions in the market. By analyzing the indicator's values and referencing the stationary support and resistance levels, traders can identify potential trend reversals, evaluate market strength, and make better informed analysis.
It is important to note that this indicator should be used in conjunction with other technical analysis tools and indicators to confirm trading signals and validate market dynamics.
Credit:
The 𝗘𝗻𝗵𝗮𝗻𝗰𝗲𝗱 𝗪𝗧 indicator is a modification of the original WaveTrend Oscillator developed by @LazyBear on TradingView.
Example Charts:
Lune Oscillator Premium⬛️ Overview
Lune Oscillator is an advanced and innovative TradingView indicator designed to enhance your market analysis. Rather than merely improving visuals or merging traditional indicators, it introduces a series of unique features, each with its unique value proposition. This script stands out due to its originality, and the significant utility it brings to traders.
🟦 Features
Oscillator features an assortment of sophisticated tools aimed at refining your trading strategies:
🔹 Trend Oscillator: This feature integrates market trend and momentum analysis into one dynamic oscillator. It's designed to facilitate market trend and momentum analysis, and is invaluable to traders as it combines both trend and momentum analysis into one tool. For instance, if a ticker shows signs of slowing momentum after a recent rally, the Trend Oscillator could predict a potential trend reversal. The Trend Oscillator’s sensitivity and velocity settings can be tailored to suit your trading style and strategy. It is developed using a custom formula similar to WaveTrend but optimized for better detection of trend and momentum shifts.
🔹 Market Peak: Market Peak identifies potential market peaks and troughs using a percentile-based system. It's aimed at detecting overextensions in the Trend Oscillator, indicating potential market reversals. Compact and user-friendly, this feature signals potential trade exit points in case of an impending market reversal. Its sensitivity can be adjusted to react to either short-term or long-term market changes. By analyzing the market's average move, it detects overbought or oversold conditions when the percentage gets too extreme.
🔹 Money Pulse: The Money Pulse feature serves as a radar for money inflow or outflow, helping users detect nascent trends and reversals. It enables traders to spot early opportunities and reversals and align their strategies with institutional and large players. For example, a bullish Money Pulse during market consolidation could signal money influx and the beginning of an accumulation phase. The sensitivity of the Market Pulse can be adapted to short-term or long-term changes. This feature employs an improved version of the Money Flow concept.
🔹 Liquidity Pulse: Liquidity Pulse provides a unique perspective of asset liquidity by tracking market inflow and outflow volumes. It assists traders in understanding the market's liquidity sentiment, which is particularly useful for long-term trades and confluence. For instance, a bullish Liquidity Pulse could signal abundant liquidity, potentially driving up the price. The sensitivity setting can be adjusted for short-term or long-term liquidity changes. This feature utilizes an enhanced version of the On-Balance Volume concept.
🔹 Institutional Wave: This feature tracks the cumulative inflow and outflow for a specific ticker, helping traders monitor institutional money flows. It enables the analysis of a ticker's accumulation and distribution, assisting in detecting early trade entries and avoiding dumps. For example, a decrease in volume during consolidation after a price rally could indicate sell-off and potential price drop. The Institutional Wave's sensitivity can be adapted to either short-term or long-term changes. It operates on the Accumulation and Distribution concept.
🔹 Power Wave: The Power Wave evaluates market strength and momentum, indicating market power shifts. It helps traders understand the true power behind a market move. For instance, a decreasing Power Wave during a bullish move could indicate a weakening trend, suggesting a bearish strategy instead. The sensitivity of the Power Wave can be set for short-term or long-term market changes. The Power Wave calculates market strength by evaluating price change volatility.
🔹 Market Pressure: This feature detects shifts in buy and sell pressure, signaling potential turning points. It helps traders understand the power balance in the market. For example, a bullish Market Pressure shift during a short trade could suggest a momentum gain by bulls, indicating a trade exit. The Market Pressure's sensitivity can be adjusted for short-term or long-term changes. This feature uses volume data and moving averages to detect market pressure shifts, filtering out false and volatile signals.
🔹 Oscillator Copilot: Incorporating Smart Bias and Reversal Radar, the Oscillator Copilot helps identify market trends and potential reversals. It searches for confluence within multiple Oscillator features, providing a straightforward assistive tool. For example, a bullish Smart Bias signal during a long trade could suggest staying in the trade longer, while a bearish Reversal Radar signal could indicate the need to exit the trade.
🔹 Divergence Detection: This feature offers a sophisticated detection system for both regular and hidden market divergences, providing additional confluence and highlighting hard-to-detect divergences. For instance, a bullish Regular Divergence could signal a potential trade entry or exit depending on your overall market sentiment and bias. This feature uses fractals to effectively detect divergences in the market based on the Trend Oscillator.
🔹 Color Themes: Personalize your charting experience with various color themes. This feature enhances the visual appeal of your chart, offering easy setup and use. For example, use the “Ice” theme for a unique and colorful experience or the “Dark” theme for a more subdued look. Themes available include Default, Light, Dark, and Ice. This feature modifies the colors of your candles and features based on the selected theme.
These features and tools collectively offer a comprehensive solution for traders to understand and navigate the financial markets. It's important to remember that they are designed to assist in making informed trading decisions and should be used as part of a balanced trading strategy.
🟧 Usage
Lune Oscillator's features are designed to be both standalone tools and components of a larger, integrated trading strategy. It is important to understand each feature and experiment with different configurations to best suit your unique trading needs.
🔸 Example #1: The following demonstrates how the Oscillator Copilot can be an excellent trade assistant.
The Oscillator Copilot leverages multiple Lune Oscillator features, allowing traders to quickly assess overall market sentiment. It uses Smart Bias and Reversal Radar tools to deliver these insights. For instance, at point 1, a bullish Smart Bias (denoted by a green circle) represents a collective bullish sentiment from multiple components of Lune Oscillator, often leading to a price increase. Conversely, at point 2, we identify two bearish reversal signals from the Reversal Radar (highlighted by red triangles). This convergence of bearish signals from multiple components hints at a potential market reversal, often followed by a gradual price decline.
🔸 Example #2: This example shows how the Market Peak feature can aid in detecting potential market tops and bottoms.
Market Peak calculates how overbought or oversold a ticker is using a percentile system, offering insights into potential reversals. At points 1 and 2, we observe bearish Market Peaks suggesting overbought conditions and indicating a possible shift in trend. Subsequent to these peaks, we witness a price drop, mirroring the overbought market conditions. In contrast, at point 3, a bullish Market Peak suggests an oversold market, indicating a potential trend reversal and subsequent price increase.
🔸 Example #3: This is an example of how combining various features such as the Money Pulse, Liquidity Pulse, Institutional Wave, and Market Peak, can help make more informed trades.
Money Pulse and Liquidity Pulse provide insights into the money and liquidity flow in the market, respectively, while the Institutional Wave monitors the cumulative volume shifts and changes. Together with Market Peak, they offer a comprehensive view of the market's state.
At point 1, the positive Liquidity Wave (crossing above 0) suggests a bullish market volume. At point 2, a bullish Market Pressure indicates an increase in buying pressure, reinforcing the bullish sentiment. At point 3, a negative Liquidity Wave (crossing below 0) indicates a bearish sentiment, suggesting that market participants are exiting their positions. The concurrent Market Pressure hints at an increase in selling activity. Taking all these factors into account provides a strong indicator that the market sentiment has turned bearish.
🟥 Conclusion
Lune Oscillator aims to provide a suite of tools that bring unique value to traders. Each feature is designed to offer different, yet complementary, perspectives on the market, allowing users to piece together a more comprehensive understanding of their trading environment.
🔻 Access
You can see the Author's instructions below to get instant access to this indicator & our Premium Suite.
🔻 Disclaimer
Lune Oscillator is a tool for aiding in market analysis and is not a guarantee of future market performance or individual trading success. We strongly recommend that users combine our tool with their trading strategies and do their due diligence before making any trading decisions.
Remember, past performance is not indicative of future results. Please trade responsibly.

Moving Average CandlesInspired by Ricardo Santos's " Multiple Moving Average Candle System V0" ()
This script plots 6 moving averages using the plotcandle function rather than the normal plot function. Result is a stylish indicator that shows moving average crossovers in a more visual way. Moving average type options available are , or Simple, Exponential, Hull, Relative, Volume Weighted, and Arnaud Legoux Moving Averages, Linear Regression Curve, and Median. Lengths for each can be set in settings along with selection specific parameters. Good for plotting/visualizing potential entry/exit points based on your preferred moving averages crossing over, or just as some eye candy.

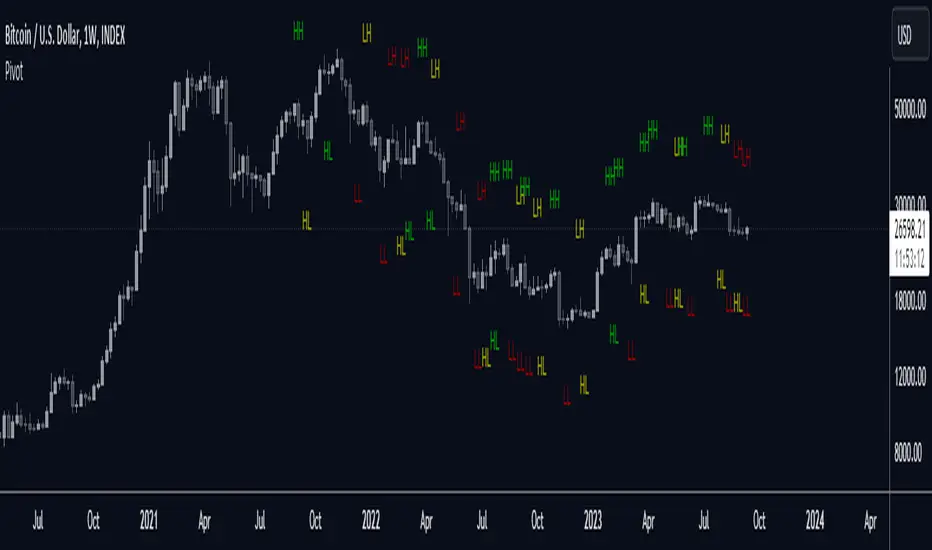
PivotLibrary "Pivot"
This library helps you store and manage pivots.
bias(isHigh, isHigher, prevWasHigher)
Helper function to calculate bias.
Parameters:
isHigh (bool) : (bool) Wether the pivot is a pivot high or not.
isHigher (bool) : (bool) Wether the pivot is a higher pivot or not.
@return (bool) The bias (true = bullish, false = bearish, na = neutral).
prevWasHigher (bool)
biasToString(bias)
Parameters:
bias (bool)
biasToColor(bias, theme)
Parameters:
bias (bool)
theme (Theme)
nameString(isHigh, isHigher)
Parameters:
isHigh (bool)
isHigher (bool)
abbrString(isHigh, isHigher)
Parameters:
isHigh (bool)
isHigher (bool)
tooltipString(y, isHigh, isHigher, bias, theme)
Parameters:
y (float)
isHigh (bool)
isHigher (bool)
bias (bool)
theme (Theme)
createLabel(x, y, isHigh, isHigher, prevWasHigher, settings)
Parameters:
x (int)
y (float)
isHigh (bool)
isHigher (bool)
prevWasHigher (bool)
settings (Settings)
new(x, y, isHigh, isHigher, settings)
Parameters:
x (int)
y (float)
isHigh (bool)
isHigher (bool)
settings (Settings)
newArray(size, initialValue)
Parameters:
size (int)
initialValue (Pivot)
method getFirst(this)
Namespace types: Pivot
Parameters:
this (Pivot )
method getLast(this, isHigh)
Namespace types: Pivot
Parameters:
this (Pivot )
isHigh (bool)
method getLastHigh(this)
Namespace types: Pivot
Parameters:
this (Pivot )
method getLastLow(this)
Namespace types: Pivot
Parameters:
this (Pivot )
method getPrev(this, numBack, isHigh)
Namespace types: Pivot
Parameters:
this (Pivot )
numBack (int)
isHigh (bool)
method getPrevHigh(this, numBack)
Namespace types: Pivot
Parameters:
this (Pivot )
numBack (int)
method getPrevLow(this, numBack)
Namespace types: Pivot
Parameters:
this (Pivot )
numBack (int)
method getText(this)
Namespace types: Pivot
Parameters:
this (Pivot)
method setX(this, value)
Namespace types: Pivot
Parameters:
this (Pivot)
value (int)
method setY(this, value)
Namespace types: Pivot
Parameters:
this (Pivot)
value (float)
method setXY(this, x, y)
Namespace types: Pivot
Parameters:
this (Pivot)
x (int)
y (float)
method setBias(this, value)
Namespace types: Pivot
Parameters:
this (Pivot)
value (int)
method setColor(this, value)
Namespace types: Pivot
Parameters:
this (Pivot)
value (color)
method setText(this, value)
Namespace types: Pivot
Parameters:
this (Pivot)
value (string)
method add(this, pivot)
Namespace types: Pivot
Parameters:
this (Pivot )
pivot (Pivot)
method updateLast(this, y, settings)
Namespace types: Pivot
Parameters:
this (Pivot )
y (float)
settings (Settings)
method update(this, y, isHigh, settings)
Namespace types: Pivot
Parameters:
this (Pivot )
y (float)
isHigh (bool)
settings (Settings)
Pivot
Stores Pivot data.
Fields:
x (series int)
y (series float)
isHigh (series bool)
isHigher (series bool)
bias (series bool)
lb (series label)
Theme
Attributes for customizable look and feel.
Fields:
size (series string)
colorDefault (series color)
colorNeutral (series color)
colorBullish (series color)
colorBearish (series color)
colored (series bool)
showTooltips (series bool)
showTooltipName (series bool)
showTooltipValue (series bool)
showTooltipBias (series bool)
Settings
All settings for the pivot.
Fields:
theme (Theme)
BBO-ALPHA-PHANTOMHello friends, this is the second time I am publishing this script, hopefully the description will be sufficient and you can use it reliably.
Script Description:
The script consists of several indicators and generates buy and sell signals based on their calculations. Here's a breakdown of the functions and indicators used in the script:
Moving Average Convergence Divergence (MACD):
Fast Length: The number of periods used for calculating the fast moving average.
Slow Length: The number of periods used for calculating the slow moving average.
Source: The price source used for calculations (default is the closing price).
Signal Smoothing: The number of periods used for smoothing the signal line.
Oscillator MA Type: The type of moving average used for the oscillator line (default is Exponential Moving Average).
Signal Line MA Type: The type of moving average used for the signal line (default is Exponential Moving Average).
Benefit: MACD is a trend-following momentum indicator that helps identify potential trend reversals, bullish or bearish market conditions, and generate buy and sell signals based on the crossovers of the oscillator and signal lines.
Relative Strength Index (RSI):
RSI Length: The number of periods used for calculating RSI.
RSI Source: The price source used for RSI calculations (default is (high + low + close) / 3).
MA Type: The type of moving average used for smoothing RSI values (default is Simple Moving Average).
MA Length: The number of periods used for smoothing RSI values.
Benefit: RSI is a momentum oscillator that measures the speed and change of price movements. It helps identify overbought and oversold conditions, potential trend reversals, and generate buy and sell signals based on the crossovers of RSI and its moving average.
Money Flow Index (MFI):
MFI Length: The number of periods used for calculating MFI.
Source: The price source used for MFI calculations (default is (high + low + close) / 3).
Benefit: MFI is a momentum indicator that uses both price and volume data to measure buying and selling pressure. It helps identify overbought and oversold conditions and potential trend reversals.
Directional Movement Index (DMI):
Signal Length: The number of periods used for smoothing the ADX line.
Length: The number of periods used for calculating DMI.
Benefit: DMI consists of three lines: ADX, +DI (Plus Directional Indicator), and -DI (Minus Directional Indicator). ADX measures the strength of a trend, while +DI and -DI indicate the direction of the trend. DMI helps identify trend strength, trend direction, and potential trend reversals.
Stochastic Oscillator:
SmoothK: The number of periods used for smoothing %K line.
SmoothD: The number of periods used for smoothing %D line.
Length RSI: The number of periods used for calculating RSI within Stochastic.
Length Stoch: The number of periods used for calculating Stochastic.
Benefit: Stochastic Oscillator is a momentum indicator that compares the closing price of an asset to its price range over a specific period. It helps identify overbought and oversold conditions and potential trend reversals.
Moving Averages (MA):
MA50: Simple Moving Average with a length of 50 periods.
MA200: Simple Moving Average with a length of 200 periods.
Benefit: Moving averages are commonly used to
Advantages of the script compared to common indicators:
Comprehensive analysis: The script combines several indicators such as MACD, RSI, MFI, DMI, Stochastic Oscillator and Moving Averages. It thus provides a broader and more comprehensive view of the market and its development.
Synergy of indicators: Using multiple indicators increases the reliability and confirmation of signals. Combining different indicators can provide potentially stronger and more accurate signals of a trend change.
Identifying Oversold and Overbought Levels: RSI, MFI and Stochastic Oscillator are used to identify oversold and overbought levels in the market. This can help uncover opportunities to buy or sell in line with these levels.
Identifying trends and their strength: DMI and Moving Averages help identify trends in the market and provide information about their strength. This can help traders in deciding the appropriate time to enter and exit the market.
Early signal generation: The script generates signals based on a combination of various indicators, which can help traders identify potential trading opportunities at an early stage.
The main thing for me is that it helps me from overtrading, I only trade when I get an alert or see it on the chart. I recommend
I find it best to trade in the 1h and 2h time frame. The shorter ones like 15min and 30min are perfect for me to get out of the position.
It is important to note that no indicator guarantees 100% accuracy in generating signals and trading on financial

*Zig Zag Price, % Change w/RSI*With immense help from ©SimpleCryptoLife who reimagined this script for me, and to ©mmoiwgg and ©ocaptain who's ideas led to this updated version 5.
This indicator is fairly straight-forward and visually appealing because you get a running zig zag price, price % change with an added bonus - RSI. However you won't find zig zag lines but the script reacts the same by changing the inputs. The higher the value the less data points you'll see on the screen.
The main objective of this indicator is to be able to spot high and low prices easily with the price % change between the same 2 data sets. Additionally and arguably more importantly, with the RSI values associated with the high and low prices, you can spot divergences easily - meaning the price is making a higher high while conversely the RSI value at the next pop (around the same price as previous high) is lower which can mean that momentum has exhausted for the time being and a reversal could be imminent.
This script is meant only as a tool to try to enrich your trading journey and I hope it helps you become a more consistent and profitable trader. If you find it invaluable drop a like and comment. Good luck!

ChanLun ProChanLun, also known as Entanglement Theory or "缠论", is a highly regarded technical analysis methodology that originated in China. Since its introduction in 2006, ChanLun has rapidly gained significant attention and a strong following within the Chinese trader community due to its exceptional ability to navigate complex market dynamics.
ChanLun places great emphasis on market structure, price action, momentum, and the intricate interplay between market forces. It recognizes that the market operates in cyclical patterns and aims to capture the underlying structure and rhythm of price movements. Through meticulous analysis of the intricate relationships between price and time, it provides traders with a unique perspective on market trends, potential reversals, and critical turning points.
This indicator offers a meticulous and comprehensive implementation of the ChanLun theory. It facilitates in-depth analysis and visual representation of all essential components, encompassing “Candlestick Conversion”, "Candlestick Standardization", "Fractal", "Stroke", "Segment", "Pivot", and "Buying/Selling Point".
🟠 Algorithm
🔵 Step 1: Candlestick Conversion
In ChanLun, candlestick analysis focuses less on the opening/closing prices and wicks, but rather emphasizes the price range at which the stock price has reached. As a result, the initial step in ChanLun involves converting each candlestick to contain solely the high and low prices, disregarding other elements.
🔵 Step 2: Candlestick Standardization
In the second step, the converted candlesticks are standardized to ensure strict directional consistency and eliminate the presence of inner bars or outer bars. For any adjacent two candlesticks A and B where one’s price range completely encompasses another, A and B are merged into a new candlestick C. If A is trending up from its previous candle, then C will be defined such that high(C) = max(high(A), high(B)) and low(C) = max(low(A), low(B)). If A is trending down from its previous candle, then C will be defined such that high(C) = min(high(A), high(B)) and low(C) = min(low(A), low(B)).
After completing these steps, when considering any adjacent candlesticks A and B, we can always observe either of the following conditions:
1. high(A) > high(B) and low(A) > low(B)
2. high(A) < high(B) and low(A) < low(B)
The chart below illustrates how the candlesticks would appear after this step.
🔵 Step 3: Fractals
A "Fractal" refers to the pattern formed by three consecutive "standardized" candlesticks, where the middle candlestick shows a clear higher or lower value compared to the surrounding candlesticks. When considering three adjacent candlesticks, A, B, and C, we have either of the two conditions:
1. high(B) > high(A) and high(B) > high(C) and low(B) > low(A) and low(B) > low(C)
2. high(B) < low(A) and high(B) < low(C) and low(B) < low(A) and low(B) < low(C)
For #1 above, we refer to the combination of A, B, and C as a “Top Fractal”, whereas for #2 we designate it as a “Bottom Fractal”.
The chart below illustrates all the fractals, with the red triangles indicating the Top Fractals and the green triangles indicating the Bottom Fractals.
🔵 Step 4: Strokes
A “Stroke” is a line connecting a top fractal and a bottom fractal, subject to the following rules:
1. There must be at least one "free" candlestick positioned between these fractals, meaning it is not part of either the top or bottom fractal. This guarantees that a stroke encompasses a minimum range of five candlesticks from beginning to end.
2. The top fractal must have a higher price compared to the bottom fractal.
3. The endpoint fractals should represent the highest or lowest point throughout the entire span of the stroke. (There is an option within this indicator to enable or disable this rule.)
Strokes enable traders to identify and visualize significant price swings or trends while effectively filtering out minor fluctuations.
🔵 Step 5: Segments
A "Segment" is a higher-level line that connects the starting and ending points of at least three consecutive strokes, reflecting the current trend of the market structure. It continues to extend as new strokes emerge, until there is a break in the market structure. The break occurs when an uptrend forms a lower high and lower low, or when a downtrend forms a higher high and higher low. It's worth noting that during trading ranges, it is common for strokes to exhibit a higher high and lower low or a higher low and lower high pattern (similar to inner bars and outer bars). In such cases, the strokes will be merged in a similar manner as described earlier for candlesticks, until there is a distinct break in the market structure. Segments provide a relatively stable depiction of the market trend in a higher timeframe, as opposed to strokes.
It is important to note that the algorithm used to calculate segments from strokes can be recursively applied to the generated segments again, forming higher-level segments that represent the market trend on a even larger timeframe.
🔵 Step 6: Pivots
In ChanLun, the term "Pivot" does not indicate a price reversal point. Instead, it represents a trading range where the price of a security tends to fluctuate. Within a given "Segment," the pivot is determined by the overlap of two consecutive strokes moving in the opposite direction of the segment. When two downtrend strokes A and B form a pivot P within an uptrend segment S, the upper and lower bounds of the pivot are defined as follows:
1. upper(P) = min(high(A), high(B)
2. lower(P) = max(low(A), low(B))
The pivot range is typically where consolidation occurs and where there is a high trading volume.
If a future stroke, moving in the opposite direction of the current segment, overlaps with the upper and lower bounds of the pivot, it is merged into the existing pivot and extends the pivot along the x-axis. A new pivot is formed when two consecutive strokes moving in the opposite direction of the current segment, intersect with each other without overlapping the previous pivot.
Likewise, pivots can also be recursively identified within the higher-level segments. The blue boxes below represent the "Segment Pivots" that are identified within the context of higher-level segments.
🔵 Step 7: Buying/Selling Points
There are three types of buying/selling points defined in ChanLun.
1. Type 1 Buying and Selling Points: Also known as trend reversal points. These points are where the old segments terminate and new segments are generated.
2. Type 2 Buying and Selling Points: Also known as trend continuation points. These points occur while the price is in the midst of a trend and signify the continuation of the trend. In an uptrend, the Type 2 buying point is the rebound point after the price retraces to a previous low or support level, indicating that the price may continue to rise. In a downtrend, the Type 2 selling point is the pullback point after the price rallies to a previous high or resistance level, indicating that the price may continue to decline.
3. Type 3 Buying and Selling Points: These points indicate the retests of breakouts from pivot ranges. The presence of these retest points suggests that the price has the potential to continue its upward/downward movement above/below the pivot levels.
A discerning reader may notice that these buying/selling points are lagging indicators. For example, by the time a new segment is confirmed, multiple candlesticks have already occurred since the type 1 buying/selling point of that segment.
Indeed, it is true that the buying/selling points lag behind the actual market movements. However, ChanLun addresses this issue through the utilization of multi-timeframe analysis. By examining the confirmed buying/selling points in a lower timeframe, one can gather additional confidence in determining the overall trend of the higher timeframe.
🔵 Step 8: Divergence
Another core technique in ChanLun is the application of divergence to anticipate the emergence of type 1 buying/selling points. While MACD is the most commonly employed indicator for detecting divergence, other indicators such as RSI can also be utilized for this purpose.
🟠 Summary
In essence, ChanLun is a robust approach to technical analysis that integrates the careful examination and interpretation of price charts, the application of technical indicators and quantitative tools, and a keen attention to multiple timeframes. Its objective is to identify prevailing market trends and uncover potential trading prospects. What sets ChanLun apart is its holistic methodology, which blends both qualitative and quantitative analysis to facilitate informed and successful trading decisions.
🟠 NOTE
The freely available "ChanLun | AlgoTrader" script, published by the same account, incorporates only a limited set of fundamental concepts from ChanLun.
In contrast, this script is a premium invite-only version that represents a comprehensive implementation of the complete ChanLun methodology, specifically tailored for more experienced and professional traders.
________________________________________________________________________________
该指标严格按照缠论原文实现了包括“K线标准化”、“分型”、“笔”、“线段”、“中枢”和“买卖点”在内的所有关键元素。它旨在为缠友们提供一个准确可靠的缠论实现,以便快速而精准地分析市场,从而获得更优秀的交易业绩。
该指标的主要特点如下:
1. 实时标记所有缠论元素:该指标具备实时识别和标记分型、笔、线段、中枢和买卖点的功能,提供清晰的信号和准确的趋势判断。
2. 多种笔段算法选择:提供三种不同的笔算法(“老笔”、“新笔”和“4K”)以及两种线段算法(“特征序列”和“1+1终结”),满足不同交易者个性化需求,可根据偏好和策略选择最适合的算法。
3. 三级别联立:指标同步计算并显示笔、线段和递归高级段,提供更全面的市场动态分析。
4. 自定义颜色:用户可以根据个人喜好和需求自定义指标的颜色方案,与图表风格和视觉需求完美匹配。
5. 完美实现K线回放功能:指标充分利用了K线回放功能,让交易者能够回顾和分析历史市场数据,提高对市场趋势的研究和理解,增强市场洞察力和决策能力。

Monday_Weekly_Range/ErkOzi/Deviation Level/V1"Hello, first of all, I believe that the most important levels to look at are the weekly Fibonacci levels. I have planned an indicator that automatically calculates this. It models a range based on the weekly opening, high, and low prices, which is well-detailed and clear in my scans. I hope it will be beneficial for everyone.
***The logic of the Monday_Weekly_Range indicator is to analyze the weekly price movement based on the trading range formed on Mondays. Here are the detailed logic, calculation, strategy, and components of the indicator:
***Calculation of Monday Range:
The indicator calculates the highest (mondayHigh) and lowest (mondayLow) price levels formed on Mondays.
If the current bar corresponds to Monday, the values of the Monday range are updated. Otherwise, the values are assigned as "na" (undefined).
***Calculation of Monday Range Midpoint:
The midpoint of the Monday range (mondayMidRange) is calculated using the highest and lowest price levels of the Monday range.
***Fibonacci Levels:
// Calculate Fibonacci levels
fib272 = nextMondayHigh + 0.272 * (nextMondayHigh - nextMondayLow)
fib414 = nextMondayHigh + 0.414 * (nextMondayHigh - nextMondayLow)
fib500 = nextMondayHigh + 0.5 * (nextMondayHigh - nextMondayLow)
fib618 = nextMondayHigh + 0.618 * (nextMondayHigh - nextMondayLow)
fibNegative272 = nextMondayLow - 0.272 * (nextMondayHigh - nextMondayLow)
fibNegative414 = nextMondayLow - 0.414 * (nextMondayHigh - nextMondayLow)
fibNegative500 = nextMondayLow - 0.5 * (nextMondayHigh - nextMondayLow)
fibNegative618 = nextMondayLow - 0.618 * (nextMondayHigh - nextMondayLow)
fibNegative1 = nextMondayLow - 1 * (nextMondayHigh - nextMondayLow)
fib2 = nextMondayHigh + 1 * (nextMondayHigh - nextMondayLow)
***Fibonacci levels are calculated using the highest and lowest price levels of the Monday range.
Common Fibonacci ratios such as 0.272, 0.414, 0.50, and 0.618 represent deviation levels of the Monday range.
Additionally, the levels are completed with -1 and +1 to determine at which level the price is within the weekly swing.
***Visualization on the Chart:
The Monday range, midpoint, Fibonacci levels, and other components are displayed on the chart using appropriate shapes and colors.
The indicator provides a visual representation of the Monday range and Fibonacci levels using lines, circles, and other graphical elements.
***Strategy and Usage:
The Monday range represents the starting point of the weekly price movement. This range plays an important role in determining weekly support and resistance levels.
Fibonacci levels are used to identify potential reaction zones and trend reversals. These levels indicate where the price may encounter support or resistance.
You can use the indicator in conjunction with other technical analysis tools and indicators to conduct a more comprehensive analysis. For example, combining it with trendlines, moving averages, or oscillators can enhance the accuracy.
When making investment decisions, it is important to combine the information provided by the indicator with other analysis methods and use risk management strategies.
Thank you in advance for your likes, follows, and comments. If you have any questions, feel free to ask."
