Session VWAPsOVERVIEW
------------
This indicator automatically anchors VWAP lines at key trading session openings. By default, it calculates separate VWAPs starting at the London Open (03:00 EST) and New York Open (09:30 EST), allowing traders to track institutional price levels from these critical market sessions.
KEY FEATURES
------------
✓ Dual Session VWAPs - London and New York opens
✓ Fully Customizable Times - Set any session opening time
✓ Timezone Support - Choose from UTC-12 to UTC+14
✓ Color Customization - Personalize each VWAP line color
✓ Adjustable Line Width - Set line thickness (1-5)
✓ Visual Session Markers - Labels show "LDN" and "NY" at session starts
✓ Clean Chart Display - Minimal, professional appearance
HOW IT WORKS
------------
The indicator anchors a new VWAP calculation at the specified session opening times. Each VWAP continues to calculate throughout the day until the next session opening the following day, when it resets and starts fresh.
VWAP (Volume Weighted Average Price) is calculated using the typical price (HLC3) weighted by volume, providing dynamic support/resistance levels that reflect institutional trading activity.
DEFAULT SETTINGS
------------
• London Session: 03:00 UTC-5 (Blue line)
• New York Session: 09:30 UTC-5 (Red line)
• Timezone: UTC-5 / EST (adjustable)
CUSTOMIZATION
------------
All parameters are fully adjustable in the indicator settings:
- Session opening hours and minutes
- VWAP line colors
- Line width/thickness
- Timezone offset
USE CASES
------------
• Identify key institutional price levels
• Track session-specific support/resistance
• Monitor price action relative to session opens
• Combine with other strategies for confluence
• Observe how price reacts to VWAP during different sessions
IDEAL FOR
------------
• Intraday traders
• Scalpers
• Day traders focusing on London/New York sessions
• Traders using VWAP strategies
• Anyone tracking institutional order flow
NOTES
------------
- Works on all timeframes (recommended: 1min to 1hour)
- Best used on liquid instruments
- VWAPs reset daily at the specified session times
- Can be used standalone or combined with other indicators
SETTINGS GUIDE
------------
London Session Group:
- Hour: Session opening hour (0-23)
- Minute: Session opening minute (0-59)
- Color: VWAP line color
- Line Width: Thickness of the line
New York Session Group:
- Hour: Session opening hour (0-23)
- Minute: Session opening minute (0-59)
- Color: VWAP line color
- Line Width: Thickness of the line
Timezone:
- Select your local timezone (UTC-12 to UTC+14)
- Default: UTC-5 (EST)
Volume

Jin#10 HMA/OBV Pro Trader System (15m)HMA/OBV Pro Trader System Overview (15m Timeframe)
This system is designed to identify high-probability entry and exit points on the 15-minute chart by integrating multiple indicators for confirmation.
1. Trend and Confirmation
HMA Lines (Solid Lines): These are two Hull Moving Averages (HMA 8 and HMA 15).
Green/Red HMA 8 (Line 1): The faster HMA, showing short-term momentum.
Blue/Red HMA 15 (Line 3): The slower HMA, indicating the medium-term trend direction.
Trend Alignment: A strong trend requires the fast HMA (8) to be above the slow HMA (15) and both to be sloping favorably.
MTF Background Color (Candle Background): This represents the 30-minute trend filter.
Light Green/Teal: The 30-minute trend is upward and strong.
Light Orange/Red: The 30-minute trend is downward and strong.
This acts as a major confirmation filter for entries.
2. Trading Signals (Shapes)
🚀 BUY / 🔻 SELL: These are the Final Confirmation Signals. They appear when all conditions (HMA alignment, Stochastic, MACD, and the 30m MTF filter) are met.
⚠️ Pre-BUY / Pre-SELL: These are Warning/Early Signals indicating that most conditions on the 15m chart are aligned, but the 30m filter has not yet confirmed the trend direction.
🔥 Volatility Spike / 🧊 Volatility Crash (Small Circle): Alerts the user to an unusually large candle (ATR spike), signaling extreme volatility or a potential reversal.
3. Exit and Risk Management
ATR Trailing Stop (Dashed Line): This dynamic line serves as a Soft Exit or Stop-Loss Guide.
❌ Exit Long / Exit Short (X-Cross): This shape appears when the price crosses the ATR Trailing Stop, suggesting the existing position (Long or Short) should be closed immediately.
Dashed TP/SL Lines (Green/Red): These lines mark a calculated Take Profit (TP) and Stop Loss (SL) based on the entry price and the defined Risk-Reward Ratio (e.g., 1:1.5).

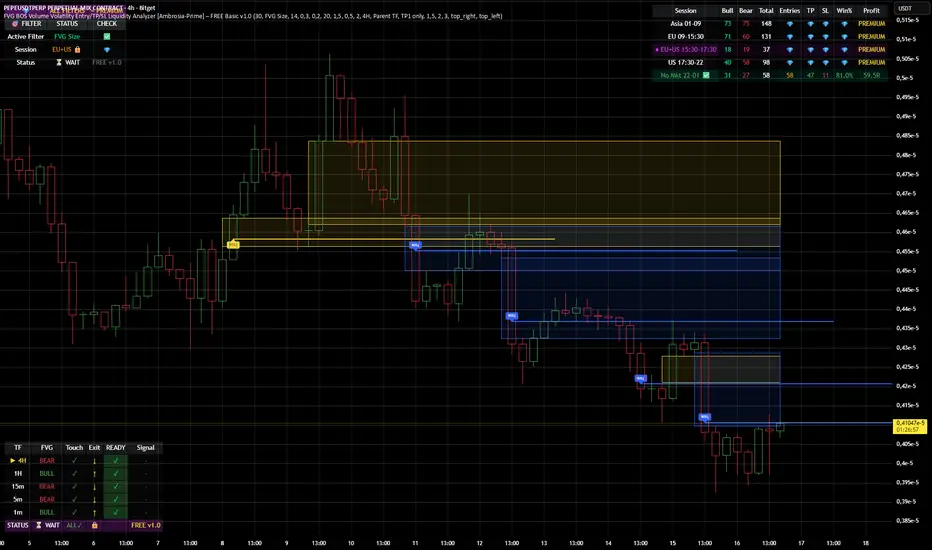
FVG BOS SMC Liquidity Analyzer - Ambrosia-Prime - Basic v1.0# 📘 USER GUIDE
# FVG BOS Volume Volatility Entry/TP/SL Liquidity Analyzer
## 🆓 FREE Basic v1.0 | by Ambrosia-Prime
---
## 📋 TABLE OF CONTENTS
1. (#what-is-this-indicator)
2. (#settings-explained)
3. (#understanding-the-tables)
4. (#your-first-trade)
5. (#free-vs-premium)
6. (#faq)
---
## 🎯 WHAT IS THIS INDICATOR?
The **FVG Analyzer** is a professional trading tool based on **Smart Money Concepts (SMC)** and **ICT strategies**. It automatically detects:
✅ **Fair Value Gaps (FVG)** - Market imbalances
✅ **Break of Structure (BOS)** - Trend confirmations
✅ **Multi-Timeframe Analysis** - 4H, 1H, 15m, 5m, 1m
✅ **Entry, Stop-Loss & Take-Profit** - Automatic level calculation
### The Debug Table shows you everything:
| TF | FVG | Touch | Exit | READY | Signal |
|-----|------|-------|------|-------|--------|
| ► 4H| BULL | ✓ | ↑ | ✓ | LONG |
| 1H | BULL | ✓ | ↑ | ✓ | LONG |
| 15m | BULL | ✓ | ↑ | ✓ | LONG |
When all timeframes show **READY** → **ENTRY SIGNAL!**
---
## ⚙️ SETTINGS EXPLAINED
### 👁 DISPLAY SETTINGS
| Setting | Description |
|---------|-------------|
| Show Bullish FVG | Display yellow FVG boxes |
| Show Bearish FVG | Display blue FVG boxes |
| Show BOS lines | Break of Structure lines |
| Show Session Stats | Statistics table (top right) |
| Show Debug Table | Cascade status (bottom left) |
| Show Entry/SL/TP | Entry lines on signals |
### 🎯 BASIC FILTER (Choose ONE)
In the **FREE Version** you can only activate **1 filter** at a time:
| Filter | What it does |
|--------|--------------|
| **None** | No filter active |
| **FVG Size** | Only FVGs larger than X × ATR |
| **Volume** | Only on above-average volume |
| **Volatility** | Only on normal volatility (not too wild) |
| **BOS only with FVG** | BOS only when open FVG exists |
| **Fill Delete** | FVG disappears when completely filled |
> 💎 **PREMIUM:** Use all 15+ filters simultaneously!
### 🔄 TOUCH + EXIT CASCADE
| Setting | Options | Recommendation |
|---------|---------|----------------|
| Cascade Parent TF | 4H, 1H, 15m | **4H** for Swing |
| Confirm EXIT by WICK | ON/OFF | **ON** for more signals |
| Entry Trigger Level | Lowest/Middle/Parent | **Parent TF** |
| Require ALL TFs | ON/OFF | **ON** for quality |
### 📊 TP SETTINGS
| Setting | Description |
|---------|-------------|
| TP Mode | TP1 only / TP1+TP2 / TP1+TP2+TP3 |
| TP1 Risk:Reward | e.g. 1.5 = 1.5× your risk |
| TP2 Multiplier | e.g. 2.0 = 2× TP1 |
| TP3 Multiplier | e.g. 3.0 = 3× TP1 |
---
## 📈 UNDERSTANDING THE TABLES
### 📍 Filter Status (Top Left)
```
┌─────────────────────────────────────┐
│ 💎 │ ALL FILTERS │ = PREMIUM │
├─────────────────────────────────────┤
│ Active Filter │ FVG Size │ ✅ │
│ Session │ EU 🔒 │ 💎 │
│ Status │ ⏳ WAIT │FREE v1.0│
└─────────────────────────────────────┘
```
- **Active Filter:** Your selected filter
- **Session:** Current trading session
- 🔒 = Locked (PREMIUM only)
- ✅ = Unlocked (No Market 22-01 CET)
- **Status:** WAIT / 🟢 LONG / 🔴 SHORT
### 📊 Session Stats (Top Right)
```
┌──────────────────────────────────────────────────────────┐
│ Session │Bull│Bear│Total│Entries│TP│SL│Win%│Profit│
├──────────────────────────────────────────────────────────┤
│ Asia 01-09 │173 │161 │ 334 │ 💎 │💎│💎│ 💎 │PREMIUM│
│ EU 09-15:30 │131 │146 │ 277 │ 💎 │💎│💎│ 💎 │PREMIUM│
│ EU+US 15:30-17:30│ 37 │ 42 │ 79 │ 💎 │💎│💎│ 💎 │PREMIUM│
│ US 17:30-22 │ 95 │106 │ 201 │ 💎 │💎│💎│ 💎 │PREMIUM│
│ No Mkt 22-01 ✅ │ 42 │ 52 │ 94 │ 14 │14│ 0│100%│ 9.8R │
└──────────────────────────────────────────────────────────┘
```
**In FREE you see:**
- ✅ Bull/Bear/Total FVGs for **ALL** sessions
- ✅ Complete stats only for **No Market (22-01 CET)**
- 💎 Other sessions = **PREMIUM**
### 🔍 Debug Table (Bottom Left)
Shows the **live status** of the cascade:
| Symbol | Meaning |
|--------|---------|
| ► | Parent timeframe (selected) |
| BULL/BEAR | FVG direction |
| ✓ (Touch) | Price touched the zone |
| ↑/↓ (Exit) | Price exited the zone |
| ✓ (READY) | Timeframe is ready |
| LONG/SHORT | Signal direction |
---
## 🚀 YOUR FIRST TRADE
### Preface - Why this Indicator is Different
This indicator can filter so **aggressively** that you receive few or almost no signals. **That was exactly my goal!**
I don't need 500 entries per day staring at a chart all day long.
**I only need 1-3 signals per day - and they should work.**
That was the goal. Quality over quantity.
---
### Step-by-Step Guide:
**1. Create a Watchlist**
- Create a watchlist in TradingView
- Add as many charts as your account allows
- Add the indicator to all charts
**2. Set up Alerts**
- Go to the **4H chart**
- Set up the alert:
- **FREE:** Only "No Market" session (22-01 CET)
- **PREMIUM:** All sessions available
- Select "Any Entry Signal"
**3. React to Alert Signal**
- When an alert comes → Switch to the chart
- Check the **Session Stats Table** (top right)
- There you see: Entry, TP, SL, Win%, Profit
**4. Optimize Entry**
- Open the **Settings** (gear icon)
- Adjust the **TP** until you win all trades
- *(Sometimes profit is higher when you lose one trade but have a higher TP)*
- When you've found the best profit result:
- **Take the set TP minus 10-20%**
- *(We don't want to be greedy, but we want to win!)*
**5. Manage Trade**
- The **SL price** is already provided
- The **TP price** adjusts to your settings
- Set your trade accordingly
**6. Done!**
- Start the trade
- Wait for the next signal on another chart
- Repeat!
---
### ⚠️ Important Note
> Remember: A trade can always hit SL!
> Only trade with money you can afford to lose.
>
> I wish you great success and let me know how successful you were.
> **I will read every comment and answer to the best of my ability.**
---
## 💎 FREE vs PREMIUM
### *Coming soon - Currently in Release Testing*
### What you get with FREE:
| Feature | FREE 🆓 |
|---------|---------|
| FVG Detection (all TFs) | ✅ |
| BOS Detection | ✅ |
| Cascade Logic | ✅ |
| Debug Table | ✅ |
| Session Stats Table | ✅ |
| Entry/SL/TP Lines | ✅ |
| Filters | **1 at a time** |
| Trading Sessions | **Only No Market (22-01)** |
| Alerts | **Only No Market** |
### What you get with PREMIUM:
| Feature | PREMIUM 💎 |
|---------|------------|
| Everything from FREE | ✅ |
| **15+ filters simultaneously** | ✅ |
| **All sessions unlocked** | ✅ |
| → Asia (01-09) | ✅ |
| → EU (09-15:30) | ✅ |
| → EU+US Overlap (15:30-17:30) | ✅ |
| → US (17:30-22) | ✅ |
| **Alerts for all sessions** | ✅ |
| **Session-based TP optimization** | ✅ |
| **HTF Zone Confluence Filter** | ✅ |
| **Structure Filter (HH/HL/LH/LL)** | ✅ |
| **RR Filter** | ✅ |
| **Trend EMA Filter** | ✅ |
| **Candle Quality Filter** | ✅ |
| **Cooldown Filter** | ✅ |
| **FVG Age Filter** | ✅ |
### 🚀 PREMIUM EDITION (Exclusive!)
The Premium version has **two different entry logics** - that's why the testing phase is still ongoing.
Finds setups with **10-100% potential!**
---
## ❓ FAQ
### "Why don't I see any entries?"
**Possible reasons:**
1. **Wrong session:** FREE only works 22:00 - 01:00 CET
2. **Cascade not READY:** All TFs must show ✓
3. **Filter blocking:** Check your active filter
4. **Already in trade:** "Single Trade" allows only 1 trade
### "What do the colors mean?"
| Color | Meaning |
|-------|---------|
| 🟡 Yellow | Bullish FVG / Entry line |
| 🔵 Blue | Bearish FVG |
| 🟢 Green | TP line / Positive |
| 🔴 Red | SL line / Negative |
| 🟣 Purple | EU+US Overlap Session |
### "Which timeframe should I use?"
| Your Style | Chart TF | Cascade Parent |
|------------|----------|----------------|
| Scalping | 1m - 5m | 15m |
| Daytrading | 5m - 15m | 1H |
| Swing | 15m - 1H | 4H |
### "Can I change the sessions?"
- **FREE:** No, only No Market (22-01) is available.
- **PREMIUM:** Yes, all sessions + session-based TP values!
---
## 📞 WANT MORE?
### Unlock PREMIUM:
- ✅ All Sessions
- ✅ All Filters
- ✅ 2 Entry Logics
- ✅ Priority Support
### Contact & Support:
📊 **TradingView:** (www.tradingview.com)
---
## 📜 CHANGELOG
### v1.0 FREE (December 2024)
- Initial Release
- Multi-TF FVG Detection
- BOS Detection
- Cascade Logic
- 1 Filter (Dropdown)
- No Market Session (22-01)
- Session Statistics
- Debug Table
---
## ⚠️ DISCLAIMER
This indicator is an **analysis tool** and not financial advice.
Trading involves risks. Past results do not guarantee future profits.
Only trade with capital you can afford to lose.
---
**Good luck with your trading! 🚀**
*Your Ambrosia-Prime*
---
*© 2024 Ambrosia-Prime. All rights reserved.*
Anchored VWAP: Monthly / Weekly / SessionsPlots up to five VWAP lines using the chart’s exchange timezone:
Monthly anchored VWAP: resets on the first bar at/after your chosen month start day + time.
Weekly anchored VWAP: resets on the first bar at/after your chosen weekday + time.
Up to 3 session anchored VWAPs: each resets on the first bar that enters its configured TradingView session window; optionally hides the line outside the session).
All VWAPs are computed from a selectable price source (default hlc3) and traded volume.

Big Trades Whale Detector [Volume Anomalies] By HKOverview The "Big Trade Detector" helps you spot institutional footprints by identifying volume anomalies that act as outliers compared to recent history. It uses statistical analysis (Standard Deviation) to filter out noise and highlight only significant buying or selling pressure.
Features:
Volume Decomposition: Approximates buy/sell volume based on price action within the candle (Close vs. Range).
3-Tier Detection: Uses dynamic thresholds to categorize volume spikes into Small, Medium, and Extreme events.
Smart Calculation: Compares current volume against the previous average to detect sudden shifts in momentum.
Visuals:
Green Circles (Below Bar): Unusual Buying Pressure (Support defense or Breakout).
Red Circles (Above Bar): Unusual Selling Pressure (Resistance defense or Dump).
Size Matters: The larger the circle, the higher the standard deviation (Sigma) of that volume event.

Auto Harmonic PatternThis advanced harmonic pattern recognition system represents the pinnacle of algorithmic pattern detection, utilizing precision-engineered Fibonacci validation algorithms with institutional-grade accuracy 📊✨. Built with sophisticated multi-layered filtering logic, it automatically identifies and validates high-probability reversal structures in real-time across all market conditions and timeframes 🎯.
🔥 Complete Pattern Detection Arsenal
This is the ONLY TradingView harmonic indicator that integrates all 16 major harmonic patterns with mathematically validated Fibonacci ratios:
🦇 Gartley Pattern
🦇 Bat Pattern
🦋 Butterfly Pattern
🦀 Crab Pattern
🎨 Leonardo Pattern
🦀 Deep Crab Pattern
🦈 Shark Pattern
🔐 Cypher Pattern
🕊️ White Swan Pattern
🔁 Three Drives Pattern
🔄 AB=CD Pattern
🌊 Wolfe Waves Pattern
5️⃣-0️⃣ Pattern
⭐ Nen Star Pattern
🦢 Black Swan Pattern
⚔️ Anti-Gartley Pattern
💎 Professional-Grade Features
The indicator employs real-time pattern validation with strict ratio tolerance controls ⚡, customizable visual alerts for pattern completion 🔔, automated multiple take-profit target plotting with precision Fibonacci extensions 💰, and integrated volume analysis for trade confirmation 📊. Each detected pattern includes three clearly marked TP levels to maximize your profit potential while maintaining optimal risk management.
✅ Want access to this indicator? Simply boost this indicator 🚀 and you'll receive immediate access to the most comprehensive and accurate harmonic pattern detection tool available on TradingView! 💪📈

DeltaReact - Volume and Orderflow ReactivityThis indicator is designed to visualise institutional participation and directional pressure using a multi-timeframe blend of volume expansion, delta imbalance, and trend context.
Unlike traditional volume or momentum tools, it focuses on relative change rather than absolute values.
Core Concepts
The script measures:
Volume expansion relative to its own moving baseline
Delta strength derived from directional volume imbalance
Directional agreement between delta, volume, and trend state
Multi-timeframe structure, allowing lower-timeframe signals to be viewed in higher-timeframe context
What Makes This Different
Most volume-based indicators treat volume and delta independently. This tool:
Normalises both metrics into percentage-based strength
Applies contextual filters to reduce noise
Highlights structural shifts rather than raw spikes
Provides clear visual hierarchy for participation intensity
How to Use
Strong delta + volume expansion suggests active participation
Directional alignment improves confidence
Signals are designed for confluence, not standalone entries
Works across assets and sessions without instrument-specific tuning
Access & Availability
This script is published as invite-only to control distribution.
If you would like to request access or learn more about usage, please contact the author via TradingView direct message.
Important Notes
This indicator is not a trading strategy and does not provide buy or sell signals.
It is intended as a decision-support tool to be used alongside risk management and broader market analysis.
Intraday Volume Pulse GSK-VIZAG-AP-INDIA📊 Intraday Volume Pulse — by GSK-VIZAG-AP-INDIA
Overview:
This indicator displays a simple and effective intraday volume summary in table format, starting from a user-defined session time. It provides an approximate breakdown of buy volume, sell volume, cumulative delta, and total volume — all updated in real-time.
🧠 Key Features
✅ Session Start Control
Choose the session start hour and minute (default is 09:15 for NSE).
🌐 Timezone Selector
View volume data in your preferred timezone: IST, GMT, EST, CST, etc.
📈 Buy/Sell Volume Estimation Logic
Buy Volume: When candle closes above open
Sell Volume: When candle closes below open
Equal: Volume split equally if Open == Close
🔄 Daily Auto-Reset
All volume metrics reset at the start of a new trading day.
🎨 Color-Coded Volume Insights
Buy Volume: Green shade if positive
Sell Volume: Red shade if positive
Cumulative Delta: Dynamic red/green based on net pressure
Total Volume: Neutral gray with emphasis text
🧾 Readable Number Formatting
Volumes are displayed in "K", "L", and "Cr" units for easier readability.
📌 Table Positioning
Choose from top/bottom corners to best fit your layout.
⚠️ Note
All data shown is approximate and based on candle structure — it does not reflect actual order book or tick-level data. This is a visual estimation tool to guide real-time intraday decisions.
✍️ Signature
GSK-VIZAG-AP-INDIA
Creator of practical TradingView tools focused on volume dynamics and trader psychology.

Trend + Liquidity Master Trend & Liquidity Master
A Professional All-in-One Trading System combining Dynamic Trend Analysis with Smart Money Liquidity Zones
---
## 🎯 Overview
The Trend & Liquidity Master is a comprehensive trading indicator that merges institutional-grade trend detection with smart money liquidity mapping. Designed for traders who want to align with market structure while identifying high-probability entry zones, this system provides clear visual signals backed by multi-layered confirmation filters.
## ⚡ Core Features
### 📊 **Adaptive Trend Cloud**
- Multi-Algorithm Support: Choose between EMA, SMA, HMA, or RMA for trend calculation
- Volatility-Based Bands: Dynamic ATR bands that expand/contract with market conditions
- Anti-Chop Filter: Maintains trend state during consolidation to reduce false signals
- Visual Clarity: Color-coded cloud system (Green = Bullish, Red = Bearish - customisable)
### 🧱 **Smart Liquidity Zones**
- Supply & Demand Boxes: Automatically identifies institutional support/resistance levels
- Pivot-Based Detection: Uses swing high/low analysis to map liquidity pools
- Dynamic Mitigation: Zones auto-delete when price invalidates them
- Clean Visual Design: Semi-transparent boxes that don't clutter your chart
### 🎯 **Multi-Filter Signal System**
- Volume Confirmation: Optional filter to ensure signals occur on above-average volume
- RSI Screening: Avoid overbought buys and oversold sells (toggleable)
- Trend Alignment: Signals only trigger on confirmed trend changes
- Clear Entry Labels: BUY/SELL markers appear directly on the chart
### 🖥️ **Professional HUD Dashboard**
Real-time market intelligence display showing:
- Trend Bias: Current market direction (Bullish/Bearish)
- Momentum Status: Strength classification (Strong/Neutral/Weak)
- Volume State: Current volume relative to average (High/Low)
- Customizable Position & Styling: Place anywhere on your chart
---
## 🛠️ Customization Options
### **Trend Engine**
- Adjustable MA type and length
- Volatility multiplier for band sensitivity
- Source selection (Close, Open, HL2, etc.)
### **Liquidity Detection**
- Pivot lookback period (sensitivity control)
- Zone extension bars
- Toggle zones on/off independently
### **Signal Filters**
- Enable/disable volume filter
- Enable/disable RSI filter
- Fine-tune to match your trading style
### **Visual Design**
- Custom colors for bullish/bearish/neutral states
- Candle coloring option
- Dashboard styling and positioning
- Adjustable text and UI sizing
---
## 📈 How to Use
1. Identify the Trend: Wait for price to break above the upper band (Bullish) or below the lower band (Bearish)
2. Watch for Signals: BUY labels appear when trend turns bullish with confirmation; SELL labels for bearish turns
3. Confirm with Liquidity: Use Supply/Demand zones as potential entry refinement or profit targets
4. Monitor the HUD: Check momentum and volume states for additional confluence
5. Set Alerts: Built-in alert conditions for automated notifications
---
## 💡 Best Practices
- **Higher Timeframes**: Works best on 15m+ charts for reduced noise
- **Trend Following**: This is a trend-following system—avoid counter-trend trades
- **Multiple Confirmations**: Combine signals with liquidity zones for highest probability setups
- **Risk Management**: Always use proper position sizing and stop losses
---
## 🔔 Alert System
Pre-configured alerts for:
- Long entry signals (Apex Buy Alert)
- Short entry signals (Apex Sell Alert)
- Automatic ticker symbol insertion
---
## 📝 Notes
- Maximum 50 boxes and lines for optimal performance
- Liquidity zones automatically manage themselves (old zones removed)
- All components can be toggled independently
- Compatible with all markets (Forex, Crypto, Stocks, Indices)
---
## 🎨 What Makes This Different?
You get the best of both worlds: smart money zones that show where liquidity sits, combined with clear trend signals that tell you when to act.
---
Ready to trade with institutional-grade market intelligence? Add the Trend & Liquidity Master to your chart today.
---
*Disclaimer: This indicator is for educational and informational purposes only. Past performance does not guarantee future results. Always conduct your own analysis and practice proper risk management.*

SCOTTGO - Buy Sell Volume📊 SCOTTGO - Buy Sell Volume Bars - Delta - Up Down Volume Bars
This indicator disaggregates the total volume traded on each bar into estimated Buying Volume and Selling Volume to visualize market pressure and dominance directly in a dedicated sub-pane.
Key Features:
Volume Disaggregation: Uses a standard formula to estimate how much of a bar's total volume was associated with upward (buying) pressure and how much was associated with downward (selling) pressure.
Visual Clarity: Plots the Buy Volume (teal, upward) and Sell Volume (red, downward) as separate columns against a transparent total volume background, allowing for quick assessment of pressure balance.
Real-Time Badge: A dynamic badge is fixed to the corner of the chart (default: Top Right) providing a numeric summary of the latest bar:
Buy %: Percentage of the bar's total volume estimated as Buying Volume.
Sell %: Percentage of the bar's total volume estimated as Selling Volume.
Delta %: The magnitude of the volume difference (Delta) as a percentage of total volume, indicating the strength of the dominant side.
Dominance Indicator: The background color of the badge changes dynamically to immediately signal whether Buying (customizable color, default: Teal) or Selling (customizable color, default: Red) pressure was dominant on the current bar.
Usage:
Traders can use this tool to identify periods of heavy accumulation (high Buy Volume) or distribution (high Sell Volume), providing insight into the conviction behind price movements.

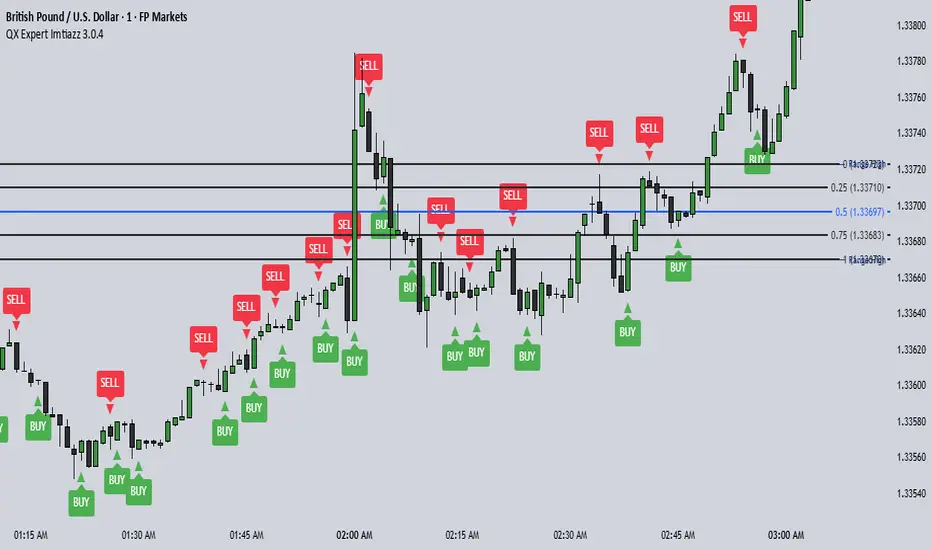
QX Expert Imtiazz 3.0.4 PROQX Expert Imtiazz 3.0.4 (qx_expert_imtiaz)
is a high-precision 1-minute binary scalping indicator, built using a hybrid trading strategy that combines momentum, structure, volume, and zone-based logic.
This indicator is specially designed for fast decision-making and short expiry trades in volatile market conditions.
---
🔹 Core Concepts Used
This indicator integrates multiple professional trading concepts into a single system:
QQE (Quantitative Qualitative Estimation)
Identifies momentum shifts and trend strength with reduced noise.
EMA Trend Filter
Confirms market direction and avoids counter-trend entries.
Smart Zones (Base & Reaction Zones)
Detects key price areas where reversals or continuations are most likely.
Volume Confirmation
Filters weak signals and confirms real market participation.
Footprint Logic (Price Acceptance / Rejection)
Analyzes candle behavior to validate buy/sell pressure.
---
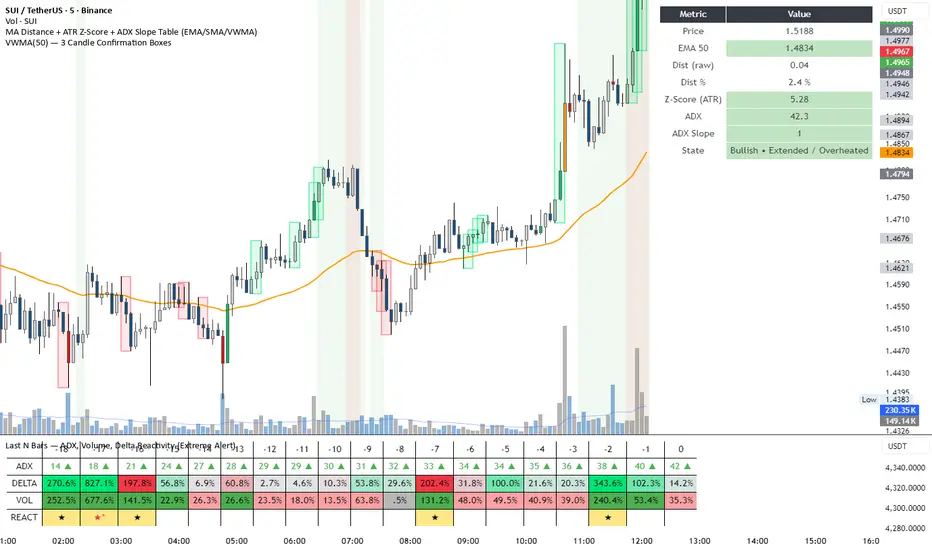
Momentum Engine: Stage AnalysisOverview: This dashboard is a comprehensive momentum analysis tool designed for the Indian stock market (adaptable to others). It evaluates a stock's health by analyzing its trend structure, relative strength against a benchmark, volume activity, and price volatility.
Dashboard Metrics & Interpretation: Each row in the dashboard provides a specific diagnostic check for the stock.
Trend Structure: Identifies the current phase of the stock's life cycle.
✅ Power Trend (Stage 2): The strongest bullish signal. The stock is in a confirmed uptrend indicating powerful momentum.
⚠️ Stage 2 (Developing): The stock price is rising, but the momentum alignment is not yet perfect. It is positive but may be in the early stages or correcting.
❌ Mixed / Stage 4: The stock is either in a downtrend (falling price) or moving sideways without clear direction. It is technically weak.
RS vs BenchmarkCompares the stock's performance against a selected market index (e.g., Nifty 50, Sensex, Smallcap).
💪 Beating : The stock is outperforming the market. Even if the market is flat, this stock is rising. This indicates market leadership.
⚠️ Lagging : The stock is underperforming. It is weaker than the general market, suggesting a lack of institutional interest.
Tightness (VCP) Checks if the price action is "tightening" (Volatility Contraction Pattern).
✅ Tight (VCP): The price swings are getting smaller and calmer. This "calm before the storm" often precedes a major breakout.
❌ Loose: The price action is wide and choppy. The stock is "noisy," making it difficult to manage risk effectively.
The Final Verdict: The "Verdict" synthesizes all metrics into a single actionable status.Verdict 🚀 A+ BREAKOUT🟩 Green: The Perfect Setup. The stock is in a Power Trend, beating the market, has tightened up (VCP), and is sitting just below the breakout point. High probability.
💪 VOL MOMENTUM🟦 Blue High Velocity. The stock has strong trend and volume but might be imperfect (e.g., a bit loose or volatile). Suitable for aggressive traders riding momentum.👀
WATCH LIST🟧 Orange Getting Ready. The stock has a great structure but is not ready to buy yet (e.g., price is too far from the pivot). Keep it on your radar.
WAIT⬜ Gray No Setup. The stock is weak, lagging, or broken. Ignore it for now.
⚠️ WARNING & DISCLAIMER
Trading involves substantial risk of loss. This tool is a technical analysis aid only and does not guarantee future performance.
No Guarantees: A "Power Trend" or "A+ Breakout" signal does not ensure the stock will rise. Market conditions can change instantly due to news, earnings, or global events.
Not Financial Advice: This script is for educational and analytical purposes only. It is not a recommendation to buy or sell any specific security.
Use Caution: Always perform your own research (DYOR) and use strict risk management (Stop Losses) regardless of what the indicator says. The indicator is based on historical data, which may not predict future movements.

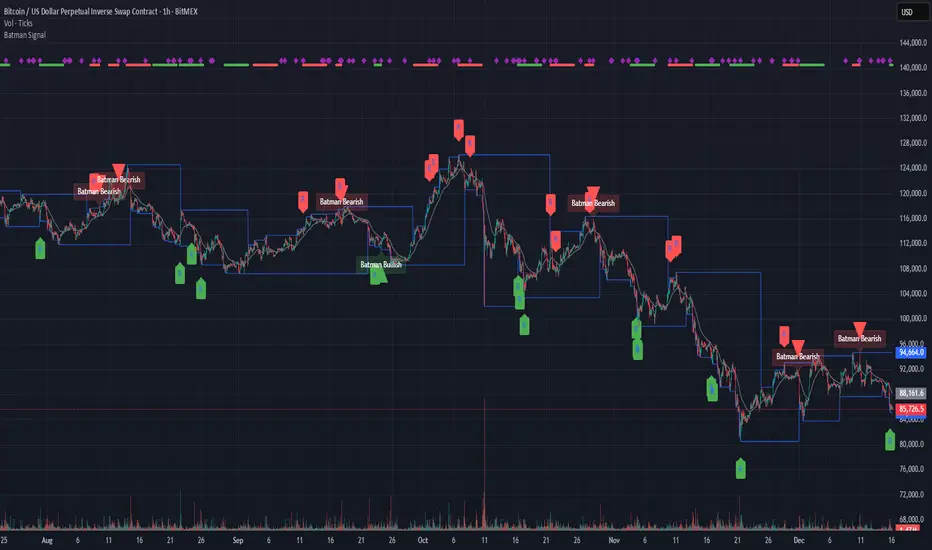
Batman SignalBATMAN SIGNAL: Identify Potential Reversal Patterns
The Batman Signal is designed to help spot potential reversal patterns that may indicate institutional activity at key price levels. It looks for a distinct "double rejection" structure, with the crucial second rejection accompanied by a liquidity spike (high volume), suggesting significant market participation.
🔑 KEY FEATURES
• Dynamic Support & Resistance Zones: Automatically calculates and draws key zones on your chart, giving an at-a-glance view of major price reaction levels where 'Batman' patterns are most likely to form.
• Momentum Clusters: See market bias instantly. Clusters of green or red dots in the top margin show where bullish or bearish patterns are actively forming. Nested purple diamonds within these clusters highlight high-volume liquidity spikes. Increasing concentration here can provide an early warning for the next major setup.
• Four Powerful, Independent Alerts: Each alert is a robust signal engineered to catch market turns. Use them separately or in sequence based on your style.
• Non-Repainting, Close-Based Signals: All final confirmation triangles plot ONLY AFTER the bar closes, providing dependable execution signals.
• Volume-Spike Confirmation: Core logic identifies "liquidity spikes" (high volume) at key rejection areas, filtering for significant market participation.
• Full Customization: Tune every aspect from trend sensitivity, zone detection, volume filters, pattern timing and structure to match any asset or timeframe.
🦇 THE FOUR BATMAN SIGNALS
The indicator scans for a specific "double rejection" structure:
• "Left Ear" – initial rejection at a key zone.
• "Right Ear" – volume-confirmed rejection at a similar level.
This creates four distinct, non-repainting alerts:
Bullish Right Ear Alert – Early warning at support.
Bearish Right Ear Alert – Early warning at resistance.
Confirmed Bullish Batman Signal – Final trigger after bar close.
Confirmed Bearish Batman Signal – Final trigger after bar close.
HOW TO READ THE CHART:
• Blue Lines – Dynamic support/resistance zones.
• "R" Labels & Purple Diamonds – Mark developing Right Ear rejections with volume spike.
• Green/Red Triangles – Show the confirmed, final Batman pattern signal.
• Clusters of Green/Red Dots – Show active bullish/bearish pattern zones (top margin).
• Nested Purple Diamonds – Highlight high-volume spikes within clusters.
• Gray EMA – Provides trend context.
⚙️ CUSTOMIZABLE INPUTS
Trend & Zones:
– Trend EMA Period – Adjust baseline trend sensitivity.
– Key Zone Lookback – Set how far back to scan for key levels.
– Zone Tolerance % – Fine-tune the zone width.
Pattern Logic:
– Min/Max Consolidation Bars – Control time window between Left and Right Ear.
– Min Wick Ratio for Right Ear – Filter for strong rejection wicks.
– Min Spike Size (ATR) – Set minimum volatility for the Right Ear.
Volume Filter (Right Ear Only):
– Toggle volume confirmation on/off.
– Volume Lookback Period – Bars used for average volume calculation.
– Min Volume Ratio – Right Ear volume must be this many times above average.
Visual Settings:
– Show/Hide labels and key zones.
– Customize bullish, bearish, and zone colors.
📘 HOW TO TRADE WITH IT
Apply the "Batman Signal" to your chart.
Watch price action at the blue zones and monitor the top-margin dot clusters for active momentum. Nested purple diamonds signal volume spikes.
Set alerts for your preferred signal type (Right Ear for early warning, or final Batman Signal for confirmation).
Alerts are robust and will fire on bar after print.
ALWAYS use sound risk management—define stop-loss and take-profit levels.
Recommended timeframes: 15min and 1 hour for optimal balance.
Works on all timeframes with appropriate tuning.
🔔 IMPORTANT ALERT SETUP TIP
When you change any input setting (e.g., Min Spike Size, Volume Filter), you MUST delete any existing alerts and create new ones.
TradingView saves alerts as a static snapshot of your settings at creation.
This ensures your alerts always match the strategy you see on the chart.
DISCLAIMER:
Note: This indicator is for informational purposes only and does not constitute financial advice.
Users are encouraged to backtest thoroughly and evaluate the indicator's performance in their trading strategy.
Liquidity Levels Pro Tool - thewallranka
Liquidity Levels Pro Tool is a market-structure and liquidity-mapping indicator designed to help discretionary futures and index traders identify statistically relevant price levels where reactions, continuations, or liquidity sweeps are more likely to occur.
This script is a decision-support tool, not a signal generator. It does not issue buy/sell alerts or predict future price movement. Instead, it organizes and scores liquidity information so traders can make their own contextual decisions.
What this indicator does
The script continuously detects and maintains liquidity zones derived from price pivots, then evaluates those zones using multiple structural and contextual factors:
Repeated price interaction (touches)
Freshness (time since last interaction)
Confluence with key reference levels
Reaction behavior after contact
Session relevance (RTH vs overnight)
Market regime (trend vs mean reversion)
Time-of-day effects (open, midday, power hour)
Only the most relevant zones—based on a dynamic scoring system—are displayed to reduce chart clutter and focus attention on levels that have historically mattered.
Core components
1. Liquidity Zones
Zones are built from pivot highs and lows and expanded into areas using a configurable tick-based padding. Nearby zones are merged to avoid redundancy.
Each zone is continuously evaluated and assigned a score (0–100) reflecting its relative importance.
2. Zone Scoring (No Lookahead)
Zone scores are based on:
Number of confirmed interactions
Recency of the last touch
Confluence with prior day/week levels, VWAP, and Opening Range
Reaction quality after touches (speed and follow-through)
Session alignment (zones that “work” in the current session are favored)
Penalties after liquidity sweeps
Zones are not forward-looking and do not rely on future data.
3. Context Engine
The script classifies the current environment using VWAP slope and distance:
Trend (up or down)
Mean reversion
Mixed/transition
Time-of-day context (Open, Midday, Power Hour) is also tracked internally and influences zone scoring.
This context is displayed in the HUD to support situational awareness, not automated decisions.
4. Liquidity Sweeps
Optional sweep detection highlights situations where price trades beyond a zone and closes back inside, indicating potential stop runs or failed breakouts.
Sweeps are rate-limited and applied conservatively to avoid visual noise.
5. Trade Planning Levels (Optional)
When enabled, the script highlights the nearest high-quality liquidity level above and below price based on score thresholds.
These are intended as reference targets, not trade entries or exits.
HUD (Heads-Up Display)
The on-chart HUD summarizes:
Key reference levels (prior day/week, Opening Range)
Nearest strong liquidity above/below price
Market regime and time-of-day context
Distance to levels (ticks or points)
The HUD is fully optional, positionable, and includes resizable modes (Small / Medium / Large) to fit different chart layouts.
How to use this tool
This indicator is best used as part of a discretionary trading process, for example:
Identifying areas where price is more likely to react or pause
Framing trades around higher-quality structure instead of arbitrary levels
Filtering setups based on session and regime context
Managing expectations near known liquidity rather than chasing price
It is intentionally designed not to provide trade signals.
Limitations and important notes
This script does not predict outcomes or guarantee reactions
High-scoring zones can still fail
Liquidity behavior is context-dependent and probabilistic
No performance claims or backtested results are provided
The indicator should not be used in isolation
Past behavior does not imply future results.
Chart and usage notes
The script is intended for standard time-based charts
Recommended for liquid futures and index products
Use a clean chart for clarity when publishing or sharing
No external indicators are required
Final note
Liquidity Levels Pro (Tool) — v6 is designed to organize complex market structure into a clear, readable framework, allowing traders to focus on execution and risk management rather than raw level detection.
This script reflects an analytical approach to intraday liquidity and structure, not an automated trading system.

Kriptano short sniperKriptano short sniper
An indicator for finding SHORT entry points after sharp price movements in the cryptocurrency market.
Features:
Pump Detector: Automatically detects price spikes on 15m, 30m, and 1h intervals with customizable thresholds.
Resistance Levels: Dynamic lines on 7 timeframes (5m-1W) with automatic deletion after a breakout.
Volume Profile: Volume distribution by price levels with a sentiment profile (bullish/bearish zones). Can help identify pump reversal points.
Kriptano short sniper
Индикатор для поиска точек входа в SHORT после резких ценовых движений на криптовалютном рынке.
Возможности:
Детектор пампа: автоматическое выявление скачков цены на интервалах 15m, 30m, 1h с настраиваемыми порогами
Уровни сопротивления: динамические линии с 7 таймфреймов (5m-1W) с автоудалением после пробития
Volume Profile: распределение объема по ценовым уровням с профилем настроений (бычьи/медвежьи зоны). Может помочь в определении точки разворота пампа.

DCT - Liquidity Heatmap - ProDCT - Liquidity Heatmap - Pro
Overview
This indicator maps liquidity concentration zones by analyzing volume distribution across price levels. It identifies areas where significant trading activity has accumulated, potentially indicating zones of interest for future price interaction.
Methodology
Volume Intensity Calculation
Each price level accumulates a normalized volume score calculated as:
- Volume Intensity = Current Bar Volume / SMA(Volume, lookback period)
- This normalization allows comparison across different volatility regimes and trading sessions
Level Construction
- Price levels are distributed symmetrically above and below current price using percentage-based spacing
- Each level maintains cumulative volume data, tracking both raw volume and normalized intensity
- Levels are visualized as zones with height proportional to the spacing parameter
Sweep Detection Logic
A level is marked as "swept" when price action crosses through it:
- Condition: Low ≤ Level Price AND High ≥ Level Price
- Swept levels stop accumulating new volume and can be styled differently (fade, hide, or preserve)
Color Intensity Grading
Zones are color-coded based on their normalized volume relative to the maximum observed:
- Purple: < 25% of max intensity
- Yellow: 25-50% of max intensity
- Orange: 50-75% of max intensity
- Red: > 75% of max intensity
Optional CVD (Cumulative Volume Delta) Mode
When enabled, directional volume is estimated using candle structure:
- Bullish candles: Buy pressure weighted by (Close - Open) / (High - Low)
- Bearish candles: Sell pressure weighted by (Open - Close) / (High - Low)
- Levels display green/red bias based on accumulated directional volume ratio
Adaptive System
The indicator includes a three-layer adaptive system:
1. Timeframe adaptation: Spacing, level count, and retention automatically adjust for M5 through Daily charts
2. Volatility adaptation: ATR-based adjustments widen spacing during high volatility and tighten during consolidation
3. Market type adaptation: Different imbalance thresholds for BTC/ETH, large altcoins, and small caps
Imbalance Detection
Buy/sell imbalance markers appear when the ratio of accumulated buy volume to sell volume exceeds a configurable threshold (default 1.5x for BTC/ETH, 2.0x for small caps).
What Makes This Implementation Unique
- Dollar-denominated liquidity display: Labels show estimated liquidity in USD (K/M/B format) rather than abstract values
- Three-layer adaptive logic: Combines timeframe, volatility (ATR), and asset-class adjustments simultaneously
- Memory-optimized architecture: Automatic cleanup of old swept levels prevents performance degradation on extended charts
- Forward projection: Active levels extend into future bars for cleaner visualization
- Granular visibility controls: Each intensity tier can be toggled independently
Settings Guide
- Dynamic: Enable adaptive adjustments (recommended)
- Spacing: Distance between levels as % of price
- Levels: Number of levels above/below price
- CVD: Enable directional volume analysis
- Forward: Project levels ahead by specified bars
Usage Notes
- Works on both Perpetual and Spot crypto markets
- Optimized for crypto assets; results may vary on other instruments
- Higher timeframes show broader liquidity structure; lower timeframes show granular detail
- Combine with your own analysis framework
Disclaimer
This indicator visualizes historical volume distribution and does not predict future price movement. Not financial advice. Use appropriate risk management.

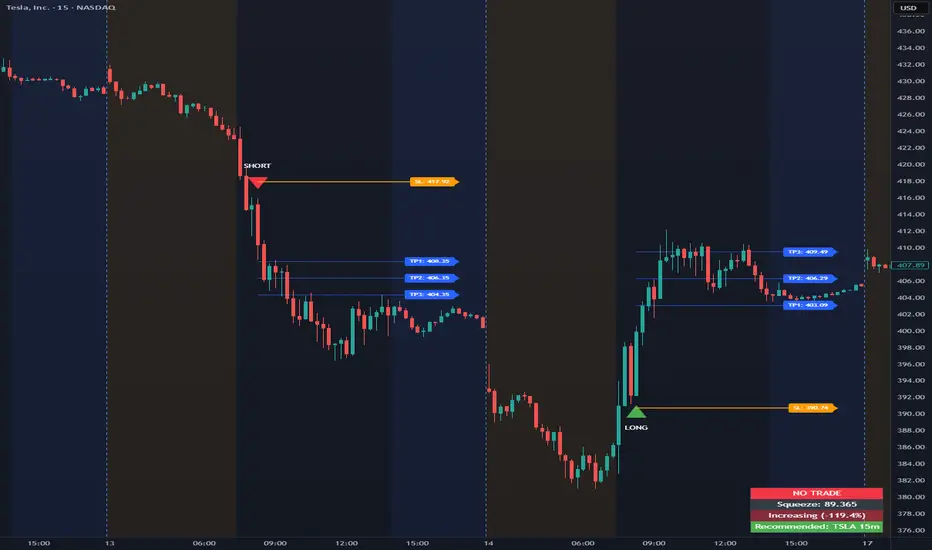
Opening Range Intraday IndicatorOpening Range Intraday Indicator
Summary
The Opening Range Intraday Indicator is a decision-support tool for intraday breakout entries. It combines an Opening Range Breakout (ORB) model with relative volume confirmation and a squeeze-style trend filter, then visualizes entries with clearly defined take-profit (TP) and stop-loss (SL) levels.
The indicator works on any ticker and any timeframe. However, its default parameters and internal logic are optimized for TSLA on the 15-minute chart, which is shown as a recommended context in the on-chart table for informational purposes only.
Core Logic
Opening Range Breakout
Establishes an opening range during the early session and monitors for confirmed breakouts above or below that range to generate potential intraday entries.
Relative Volume confirmation
Breakouts are validated using relative volume to help ensure participation and reduce low-quality signals during thin or inactive periods.
Squeeze / trend filter
A squeeze-style metric evaluates recent compression and directional behavior, helping to avoid entries during unfavorable or low-quality structural conditions.
Entry Visualization & Risk Levels
When a valid entry is confirmed, the indicator automatically:
Plots directional entry markers
Calculates and draws multiple take-profit levels
Draws a stop-loss level based on opening-range structure or ATR logic
Marks TP or SL hits directly on the chart for visual review
These visuals persist on the chart to allow traders to manually review trade structure and outcome over time.
On-Chart Table & Context Guidance
The indicator includes a compact on-chart table that displays:
Current squeeze value and short-term trend behavior
“No trade” conditions when structure is unfavorable
A recommended context message indicating whether the chart matches the optimized setup (TSLA on the 15-minute timeframe)
This message is informational only and does not restrict signals or functionality on other symbols or timeframes.
Flexibility & Controls
Users can customize:
Take-profit and stop-loss display behavior
Tight or standard stop-loss logic
Quiet windows near session close to suppress alerts
Visual settings and table positioning
This allows the indicator to be adapted to different instruments, volatility profiles, and execution styles.
Important Notes
This indicator does not execute trades and does not include automated backtesting or performance statistics.
TP/SL markers are visual aids only and are intended for manual review, not statistical validation.
Results will vary by symbol, timeframe, execution, and market conditions.
This indicator is intended as a research and decision-support tool for experienced intraday traders who understand execution risk, volatility, and position sizing. It should be used alongside proper risk management and independent analysis.
Raeinex Momentum Liquidity IndexEntry arrow signals with volumetric momentum (buying and selling pressure) and the possibility to use all entry signals as liquidity area for price retest.

Session HeatmapIntraday Seasonality
Overview
Analyzes historical patterns by time of day. Identifies when volatility, volume, and open interest changes tend to be highest or lowest.
Features
Multiple Metrics: TR (volatility), Volume, and Open Interest changes
Flexible Grouping: View patterns by weekday or month to spot day-of-week or seasonal effects
Heatmap Visualization: Blue (low) to Red (high) color scale for quick pattern recognition
Percentile Mode: Reduces outlier impact by using 5th-95th percentile range
Timezone Support: Display in UTC alongside your local time
Metrics Explained
TR: Volatility - when markets move most
Volume: Liquidity - when participation is highest
OI Increase: When new positions are opened
OI Decrease: When positions are closed
OI Net: Net open interest change
Usage
Set your timezone and preferred slot size (30min/1H)
Choose a date range (relative or custom)
Select a metric to analyze
Use "Group By" to see weekday or monthly patterns
Switch to Percentile color scale if outliers dominate
Notes
Chart timeframe should be equal to or smaller than Slot Size
OI metrics require Binance Perpetual symbols
DST is not automatically adjusted; consider seasonal shifts for US/EU sessions

15min Candle > 20% of Daily ATRThis Pine Script® (v6) indicator, titled "15min Candle > 20% of Daily ATR", detects unusually large 15-minute candles by comparing their size (full range or body) to a user-defined percentage (default 20%) of the previous day's Average True Range (ATR, default 14-period).

Current and Previous Period Anchored VWAPanchored VVWAPS and previous month VWAP extend out into the following month. Includes 1SD for both

Pulsar Heatmap CVD/OBV [by Oberlunar]Pulsar Heatmap CVD/OBV by Oberlunar is a non-repainting order-flow-like indicator designed to support fast, practical decisions—especially for day trading and scalping. It blends OBV and CVD into a structured heatmap with three lanes (OBV, CVD, and a blended COMBO) and splits each lane into two halves: flow pressure and price reaction (PriceΔ) . All values are normalised into the same range, so the intensity of each component is easy to compare at a glance.
In a simple sense, Pulsar Heatmap aims to provide a clean, integrated order-flow view: one framework that turns well-known volume concepts into a clearer read of market pressure and response. Personally, it feels like the kind of tool I would have always wanted on my chart, because it brings familiar information together into a more organic picture that is easier to use in real time.
Visually, the indicator is built around three main elements: the heatmap lanes , a pulsing triangle HUD , and a timed dashboard table . Under the hood, it follows a clear hierarchy: a Bias layer (directional context with a confidence percentage), a strict Signal layer (triggered only when full alignment occurs, with optional confirmation and stickiness), and optional timing logic based on ROC + Acceleration to validate impulses and highlight potential Exhaustion or Absorption regimes. With the option "Safe Mode" enabled, calculations update only on confirmed bars, so signals remain stable and do not repaint.
Optionally, the script can also print signal arrows/labels on the main chart only when a real Signal triggers (not when you only have Bias). To keep the chart clean, the same-direction label is not repeated unless the next signal appears at a more advantageous price than the previous one (for shorts: a higher price; for longs: a lower price). If the direction flips (SHORT → LONG or LONG → SHORT), label printing is re-enabled immediately.
What makes Pulsar Heatmap feel different is that it doesn’t leave you with two separate lines and a lot of guesswork. It organises the information into a readable decision map: pressure , response , agreement , disagreement , impulse , and timing . It was built with scalping in mind, but it’s not limited to scalping: the structure is useful whenever you want context first, and a strict trigger only when alignment is truly present.
Clean Trend Alignment (Ideal Continuation)
A “best case” scenario where flow and price response agree across lanes, so the system produces a high-confidence direction and a clean trigger. Show the heatmap with consistent colouring, the Bias band strong, and a confirmed signal/bias.
Setup 1 — Long Signal (Clean Alignment + Impulse)
In this example, Pulsar Heatmap transitions into a clear long setup when the system prints a LONG SIGNAL . The key idea is simple: the indicator does not enter on “bias” alone. It waits for full alignment across the internal lanes, optionally reinforced by the ROC/Acceleration impulse layer, and only then does it confirm a signal on a closed bar (Safe Mode).
What to highlight on the screenshot
The LONG SIGNAL label: this is the only moment the setup is considered “triggered”.
The LONG BIAS % label: this is context (direction + confidence), not the trigger.
The Triangle HUD : it visually summarises which component is driving the move (OBV/CVD/COMBO weight).
The Timed Table : show that Exhaustion is OFF while impulse metrics are supportive ( dynROC U and dynACC U positive).
If present, the Absorption state (e.g., ABS_LONG + “tight range”): it often appears during compression before expansion, and it adds context to why the breakout can accelerate.
How to read this long setup
Context : Bias is long (even if the % is not huge yet), and the system is not showing exhaustion.
Trigger : A LONG SIGNAL appears only after full alignment (with confirmation bars). If dynamic gating is enabled, the signal is valid only when the impulse agrees.
Quality checks : Positive dynROC and dynACC support the timing; absence of exhaustion reduces the risk of “late entry”. Absorption/tight range can indicate a “pressure build-up” phase.
Practical scalping execution (simple rule set)
Entry timing: consider the entry only on (or immediately after) the confirmed LONG SIGNAL candle.
Risk idea: invalidate the setup if the signal flips, or if price falls back into the compression/range that preceded the move (common absorption-breakout logic).
Exit clue: if Exhaustion turns ON or impulse weakens (acceleration flips), treat it as a warning to reduce exposure or take profit.
Setup 2 — Short Signal After Compression (Absorption → Release)
In this screenshot the short trade idea is not coming from “red candles” alone, but from a very specific sequence: the heatmap shows a shift into bearish alignment, the system prints a SHORT SIGNAL , and the timed module confirms that the market was in a tight range while sell pressure started to dominate.
What this image is really showing
You have a SHORT SIGNAL label on the chart: this is the trigger moment (not the bias).
The context reads SHORT BIAS 18% : it’s supportive, but the execution decision is driven by the signal.
The table shows Absorption = SHORT with a tight range (Range % is low): this often means price was compressed while one side kept applying pressure.
dyn metrics are negative ( dynROC U < 0 and dynACC U < 0): the impulse is coherent with the short direction, so the move is not just “random drift.”
How to read the heatmap here
Earlier, the lanes are mixed (more “two-sided”), then near the signal, the heatmap becomes decisively bearish. That change matters: it tells you the market stopped being balanced and started leaning in one direction with better internal coherence.
Why is this short “high quality” in scalping terms
Compression first : absorption/tight range means the market was storing energy.
Alignment next : the signal appears when the internal lanes agree.
Impulse last : negative ROC + negative acceleration support a real downside push, reducing the odds of a weak, slow fade.
Simple ensure-you-don’t-overtrade rule
Treat the SHORT SIGNAL as the only “go” moment. If you only see bias without signal, or the heatmap stays mixed/disagreeing, it’s usually a lower-quality scalp environment.
Disagreement Zone (Mixed Votes, Higher Risk) — A Practical Exit Area
In this screenshot, Pulsar Heatmap is clearly warning that the market is no longer “one-sided”. You can still see a directional context ( SHORT BIAS 11% ), but the key message is the DISAGREE tag: the reminder that the internal votes are split and the flow/price components are no longer moving in a clean, coherent way.
What this means in a trend continuation is very practical: a Disagreement Zone is often a good EXIT area . When you are already in a short trend, this is the moment where continuation becomes less reliable and where the market can start rotating, stalling, or snapping back.
Why it works as an exit trigger
In a healthy continuation, the lanes tend to stay aligned. Here they don’t: one or more halves contradict the dominant direction.
That loss of coherence typically shows up before the chart becomes obvious, so it can act as an early warning.
For scalping, this is where risk/reward often deteriorates: spreads, noise, and whipsaws increase exactly when the indicator starts disagreeing.
How to use it in a simple way
If you are already short , treat DISAGREE as a signal to take profit, tighten the stop, or scale out .
Avoid adding to the position inside disagreement: even if bias remains short, the internal structure is not “clean” enough to justify aggressive continuation entries.
If later the heatmap returns to full alignment and a new SHORT SIGNAL appears (ideally at a better price), then the continuation becomes actionable again.
“DISAGREE during a short continuation: coherence breaks down. In practice, this is often an exit/scale-out zone, not a fresh entry zone.”
Setup 3 — Neutral State (Stand-By Zone, No Trade Yet)
In the following screenshot, Pulsar Heatmap is doing something very important: it is clearly saying NEUTRAL 0% . Even if, visually, price could “look” like it might resume upward, the indicator is not providing a directional edge yet. This is a classic stand-by condition: the market is transitioning, and the internal components are not aligned enough to justify a directional scalp.
“Neutral 0%: mixed votes and no dominant driver. Even if the price looks promising, Pulsar stays in stand-by until bias rebuilds and a confirmed signal appears.”
What to highlight on the screenshot
The centre label NEUTRAL 0% : this is the key message—no bias strength worth following.
The heatmap is mixed/transitioning: lanes are not consistently one colour, meaning votes are not coherent.
The triangle HUD sits close to the centre: it visually reflects “no dominant driver” right now.
The table can still show background context (e.g., Absorption with a tight range), but that does not override neutrality: it’s information, not a trigger.
How to interpret “Neutral” in practice
When the indicator is neutral, it means the system sees a balance between pressure and reaction (or conflicting components), so direction is statistically less reliable. In scalping terms, this is usually where spreads and noise can eat you alive if you force entries.
Why this is still useful (even without a trade)
Neutral is not “nothing”—it is a filter. It prevents you from trading when the signal quality is low, and it forces the workflow to be clean: wait for Bias to build, then wait for a confirmed Signal , and only then treat it as a real setup.
What you wait for next
If the market turns bullish again, you want to see heatmap alignment returning and eventually a confirmed LONG SIGNAL —however, in the following examples, the heatmap does not follow the trade completely (unlike the previous generated long signal). Thus, a long entry is very risky.
If the market rolls over, you want the opposite: bearish alignment and a confirmed SHORT SIGNAL . Until one of these happens, Neutral = stand-by .
Setup 4 — Impulse + Exhaustion (Late-Stage Move, Don’t Chase)
In this screenshot, you’re basically seeing a “timing warning” configuration. Price prints a sharp bearish extension, but Pulsar Heatmap is not presenting it as a clean continuation setup: the center read is NEUTRAL 0% , while the timed engine shows both Absorption = SHORT and Exhaustion = SHORT . That combination often means: the downside pressure was real, but the move is already in a late/fragile phase (good for managing an existing short, not for opening a new one).
How to read it (practical scalping logic)
Absorption SHORT = there was compression/tight action with persistent bearish pressure building under the surface.
Exhaustion SHORT = the impulse is “spent” or destabilising (acceleration signature is no longer healthy for continuation entries).
Neutral 0% on the main HUD = the system is not granting directional confidence anymore, even if the last candles look aggressive.
Translation: if you were already short, this zone is often for taking profit / tightening risk . If you are not in, it’s usually a wait-for-reset moment.
Possible mean reversions in yellow
Those yellow tiles are the indicator’s “caution prints” (the same colour family used to express DISAGREE ). They appear when the internal structure becomes mixed —i.e., some halves/lanes are not supporting the dominant direction cleanly (or a divergence-style conflict is detected). In practice, they often mark the transition from clean pressure to noisy/late pressure , which is exactly where chasing entries tends to be punished.
How to use them
In a trend continuation, yellow tiles are a strong hint to stop adding and to manage risk more defensively (or treat the phase as “risky trend reversion”).
When they show up near an extension candle (like here), they often signal that the move is shifting into a less stable regime—better for protecting profits than for initiating new entries.
Stepping back for a moment, OBV (On-Balance Volume) and CVD (Cumulative Volume Delta) are both classic tools for studying volume flow, but they differ in what they measure. OBV tracks cumulative volume using price direction: it adds volume on up closes and subtracts it on down closes. CVD tracks the net difference between buying and selling pressure, aiming to reflect the effective push from buyers versus sellers. Both describe the "force behind price" , but from different angles.
OBV is the more traditional approach. It increases when the market closes higher and decreases when it closes lower, so it often works well as a trend-support and divergence tool: if price rises while OBV falls, that mismatch can suggest weakness beneath the move. Because it relies on the close-to-close direction, OBV naturally aligns with trend confirmation across bars.
CVD , instead, is about the ongoing battle between buyers and sellers. Conceptually, it accumulates the net delta between aggressive buying and aggressive selling over time. Positive values tend to indicate stronger buying pressure; negative values indicate stronger selling pressure. Its focus is the tug-of-war itself—who is pushing, rather than simply whether the bar ended up closing up or down.
The practical differences are straightforward. OBV uses the closing direction to assign the full volume, so it tends to be more connected to the overall trend structure. CVD is usually more sensitive to shifts in pressure and can react faster when the market changes character. OBV is commonly used to confirm trends and highlight divergences; CVD is commonly used to spot early pressure changes and moments where one side starts to dominate.
This is also why combining them inside one normalised framework can be so effective. You are not relying on a single volume interpretation. You are pairing a trend-confirmation view (OBV) with a pressure-sensitive view (CVD), and you are making them comparable in a shared scale so agreement and divergence become immediately visible. When they agree, conviction is clearer. When they diverge, you often see important information—hesitation, absorption, or pressure that the price is not fully accepting.
👁️ by Oberlunar ⭐

Kinetic Scalper [BULLBYTE]KINETIC SCALPER - ADVANCED MOMENTUM & CONFLUENCE TRADING SYSTEM
A SOPHISTICATED MULTI-FACTOR ANALYSIS INDICATOR FOR PRECISION ENTRIES
The Kinetic Scalper is a comprehensive trading analysis tool that combines volume-weighted momentum calculations, multi-oscillator divergence detection, and a proprietary 15-factor confluence scoring system to identify high-probability reversal setups across all timeframes.
WHAT MAKES THIS INDICATOR ORIGINAL
This is NOT a simple mashup of existing indicators.
The Kinetic Scalper features a completely custom momentum engine called the "Kinetic Pulse" - a volume-weighted momentum oscillator with Fisher Transform normalization that fundamentally differs from standard RSI or other momentum indicators. Every component feeds into a unified algorithmic framework designed specifically for this system.
KEY INNOVATIONS:
KINETIC PULSE ENGINE
Unlike standard RSI which uses simple price changes, the Kinetic Pulse applies:
→ Volume weighting to price movements (high-volume moves carry more weight)
→ EMA smoothing instead of traditional SMA (faster response to changes)
→ Fisher Transform normalization for improved signal clarity
→ Adaptive period adjustment based on current volatility regime
→ Result: A momentum oscillator that responds to conviction, not just price noise
15-FACTOR CONFLUENCE SCORING SYSTEM
Every signal is graded based on the number of confirming factors present:
→ Momentum position (oversold/overbought extremes)
→ Momentum velocity (direction change confirmation)
→ Momentum acceleration (strength of reversal)
→ Multi-oscillator divergence (price vs. 3 oscillators)
→ Volume confirmation (above-average participation)
→ Volume delta analysis (buying vs. selling pressure)
→ Higher timeframe alignment (trend confirmation from larger timeframe)
→ Session timing (major forex session awareness)
→ Structure clearance (clear path to profit targets)
→ Support/resistance proximity (confluence with key levels)
→ Market regime filtering (trending vs. choppy conditions)
Signals are graded A+, A, or B based on how many factors align:
• CONSERVATIVE MODE: A+ requires 12+ factors, A requires 9+, B requires 7+
• BALANCED MODE: A+ requires 10+ factors, A requires 7+, B requires 5+
• AGGRESSIVE MODE: A+ requires 8+ factors, A requires 5+, B requires 3+
TRADE ANALYSIS STATE MACHINE
A sophisticated monitoring system that tracks trade conditions in real-time using:
→ 5-state analysis framework (Factors Aligned / Positive Bias / Mixed Signals / Factors Weakening / Negative Bias)
→ Hysteresis-based transitions (different thresholds to enter vs. exit states)
→ Confidence smoothing with EMA (reduces noise, prevents flip-flopping)
→ Minimum commitment periods before state changes
→ Override logic for significant events (near TP/SL, momentum reversals)
→ Result: Stable, actionable guidance that doesn't change on every bar
INSTRUMENT-AWARE CALIBRATION
Automatically detects what you're trading and applies optimized parameters:
→ Forex Majors: Standard ATR, high session weight
→ Forex Crosses: Tighter stops, moderate session weight
→ Crypto: Wider stops (1.8x multiplier), reduced session weight (24/7 markets)
→ Indices: Moderate-wide stops, high session weight
→ Commodities: Moderate stops, moderate session weight
WHAT THIS INDICATOR DOES
The Kinetic Scalper is designed to identify high-confluence reversal opportunities by analyzing multiple dimensions of market behavior simultaneously.
CORE FUNCTIONS:
1. SIGNAL GENERATION
→ Identifies potential reversal points at oversold/overbought extremes
→ Confirms with multi-oscillator divergence detection
→ Validates with volume, higher timeframe, and structural analysis
→ Filters out low-probability setups automatically
→ Grades signals based on total confluence factors present
2. AUTOMATED TRADE TRACKING
→ Calculates structure-based or ATR-based stop loss levels
→ Projects take profit targets using risk-to-reward ratios
→ Monitors live position status (P/L, distance to targets, R-multiple)
→ Tracks TP1 and TP2 hits automatically
→ Displays outcome markers (TP HIT, PARTIAL WIN, STOPPED)
3. REAL-TIME CONDITION MONITORING
→ Analyzes 6 factor categories during active trades
→ Provides confidence scoring (0-100 scale)
→ Generates actionable guidance based on current market state
→ Alerts when conditions deteriorate or improve
→ Helps with trade management decisions
4. COMPREHENSIVE MARKET ANALYSIS
→ Session detection (Asian, London, New York, Overlap)
→ Volatility regime identification (Low, Normal, High, Extreme)
→ Trend state classification (Trending Up/Down, Ranging, Transitioning)
→ Volume analysis (relative volume and delta approximation)
→ Choppiness filtering (blocks signals in ranging markets)
WHY USE THIS INDICATOR
PROBLEM: Most momentum indicators generate too many false signals at extremes.
SOLUTION: The Kinetic Scalper requires MULTIPLE confirming factors before generating a signal, dramatically reducing noise and focusing on high-confluence setups.
ADVANTAGES:
✓ QUALITY OVER QUANTITY
→ Signal grading ensures you can filter for only the highest-quality setups
→ A+ signals have 10-12+ confirming factors aligned
→ Cooldown periods prevent over-trading the same move
✓ COMPLETE TRADE FRAMEWORK
→ Entry signals with confluence justification
→ Calculated stop loss based on market structure or ATR
→ Two profit targets with clear risk-to-reward ratios
→ Live trade monitoring with factor analysis
→ Outcome tracking and visual markers
✓ ADAPTIVE TO MARKET CONDITIONS
→ Volatility-based period adjustment for momentum calculations
→ Instrument-specific ATR multipliers
→ Session awareness for forex traders
→ Higher timeframe trend filtering
→ Automatic regime detection (trending vs. choppy)
✓ TRANSPARENT METHODOLOGY
→ Every input has detailed tooltips explaining its purpose
→ Signal tooltips show exactly why a signal was generated
→ Dashboard displays all relevant market conditions
→ Factor scores are visible during trades
→ No "black box" mystery calculations
✓ NON-REPAINTING & RELIABLE
→ All signals use barstate.isconfirmed (only on closed bars)
→ Higher timeframe data uses lookahead_off with historical offset
→ No future data access or repainting behavior
→ What you see is what you get - signals don't disappear or move
HOW THE INDICATOR WORKS
SIGNAL GENERATION PROCESS:
STEP 1: MOMENTUM ANALYSIS
The Kinetic Pulse engine calculates volume-weighted momentum:
→ Price changes are weighted by volume ratio vs. 20-bar average
→ High-volume moves have more influence on the oscillator
→ Gains and losses are smoothed using EMA (not SMA like RSI)
→ Fisher Transform is applied for normalization to 0-100 scale
→ Result: Momentum reading that emphasizes conviction, not noise
STEP 2: REVERSAL DETECTION
The indicator looks for potential reversal conditions:
→ Kinetic Pulse reaching oversold zone (below dynamic lower threshold)
→ Momentum velocity turning positive after being negative (for longs)
→ OR bullish divergence detected on multiple oscillators
→ Price making lower lows while oscillators make higher lows = divergence
STEP 3: MULTI-OSCILLATOR DIVERGENCE CONFIRMATION
Divergence is validated across three sources:
→ Kinetic Pulse divergence
→ CCI divergence
→ Stochastic divergence
→ Multiple oscillators confirming divergence increases signal reliability
STEP 4: CONFLUENCE FACTOR SCORING
The system evaluates all 15 possible confirming factors:
→ Momentum position: Is pulse oversold/overbought? (+0 to +2 points)
→ Momentum direction: Is velocity reversing? (+0 to +2 points)
→ Momentum acceleration: Is reversal strengthening? (+0 to +1 point)
→ Divergence count: How many oscillators show divergence? (+0 to +2 points)
→ Volume strength: Is volume above 1.3x average? (+0 to +1 point)
→ Volume delta: Is cumulative delta positive/negative? (+0 to +1 point)
→ HTF alignment: Does higher timeframe support direction? (+0 to +2 points)
→ Session timing: Is it a prime trading session? (+0 to +1 point)
→ Clear air: Is path to targets clear of obstacles? (+0 to +1 point)
→ Structure confluence: Are we near support/resistance? (+0 to +1 point)
→ Market regime: Is market trending, not choppy? (+0 to +1 point)
Total possible score: 15 points
Minimum for signal: 3-12 points depending on sensitivity mode
STEP 5: FILTER VALIDATION
Before generating a signal, additional checks are performed:
→ Volume must be above minimum threshold (if filter enabled)
→ Higher timeframe must not oppose the signal direction (if filter enabled)
→ Target path must be clear of major resistance/support (if filter enabled)
→ Volatility must not be EXTREME (blocks signals in chaos)
→ Risk-to-reward ratio must meet minimum requirement
→ Cooldown period must have elapsed since last signal
STEP 6: SIGNAL GRADING
If all filters pass, the signal is graded based on score:
→ A+ Grade: Highest confluence (8-12+ factors depending on sensitivity)
→ A Grade: High confluence (5-9+ factors)
→ B Grade: Moderate confluence (3-7+ factors)
Only graded signals (A+, A, or B) are displayed.
STEP 7: TRADE LEVEL CALCULATION
Stop loss and targets are calculated automatically:
STOP LOSS METHODS:
• Structure-Based: Uses recent swing low/high with ATR buffer, constrained by min/max ATR limits
• ATR-Based: Pure ATR multiplier with min/max constraints
• Fixed ATR: Simple ATR multiplier, no adjustments
TARGET CALCULATION:
• TP1: Entry ± (Stop Distance × Target 1 R:R)
• TP2: Entry ± (Stop Distance × Target 2 R:R)
• Default: TP1 at 1.0 R:R (1:1), TP2 at 2.0 R:R (1:2)
STEP 8: TRADE MONITORING
Once a signal is taken, the indicator tracks:
→ Current P/L in ticks and R-multiples
→ Distance to each target in ATR units
→ Distance to stop loss in ATR units
→ TP1 hit detection (marks with label, updates lines)
→ TP2 hit detection (closes trade, marks outcome)
→ Stop loss hit detection (closes trade, differentiates partial vs. full loss)
STEP 9: FACTOR ANALYSIS (DURING TRADES)
The Trade Analysis Panel monitors 6 key factor categories:
→ Momentum: Is momentum still aligned with trade direction? (-15 to +15 pts)
→ Position: Current R-multiple position (-12 to +12 pts)
→ Volume: Is volume still supportive? (-6 to +6 pts)
→ HTF Alignment: Does HTF still support trade? (-6 to +8 pts)
→ Target Proximity: How close are we to targets? (0 to +10 pts)
→ Stop Proximity: Are we dangerously close to stop? (-15 to +3 pts)
Raw scores are summed and smoothed using 5-bar EMA to create Confidence Score (0-100).
STEP 10: STATE MACHINE TRANSITIONS
Based on smoothed confidence, the system transitions between 5 states:
→ FACTORS ALIGNED (72+): Everything looks good
→ POSITIVE BIAS (58-72): Conditions favorable
→ MIXED SIGNALS (48-58): Neutral conditions
→ FACTORS WEAKENING (22-48): Concerning signals
→ NEGATIVE BIAS (<22): Poor conditions
Hysteresis prevents rapid flipping between states (different entry/exit thresholds).
RECOMMENDED TIMEFRAMES & INSTRUMENTS
TIMEFRAME VERSATILITY:
Despite the name "Scalper," this indicator works on ALL timeframes:
✓ LOWER TIMEFRAMES (1m - 15m)
→ Ideal for: Scalping and very short-term trades
→ Expect: More signals, faster trades, requires active monitoring
→ Best for: Forex majors, liquid crypto pairs
→ Tip: Use Conservative sensitivity to reduce noise
✓ MID TIMEFRAMES (15m - 1H)
→ Ideal for: Intraday trading and day trading
→ Expect: Moderate signal frequency, 1-4 hour trade duration
→ Best for: Forex, indices, major crypto
→ Tip: Balanced sensitivity works well here
✓ HIGHER TIMEFRAMES (4H - Daily)
→ Ideal for: Swing trading and position trading
→ Expect: Fewer signals, higher-quality setups, multi-day trades
→ Best for: All instruments
→ Tip: Can use Aggressive sensitivity for more opportunities
INSTRUMENT COMPATIBILITY:
✓ FOREX MAJORS (EUR/USD, GBP/USD, USD/JPY, etc.)
→ Auto-detected or manually select "Forex Major"
→ Session filtering is highly valuable here
→ London/NY overlap generates best signals
✓ FOREX CROSSES (EUR/GBP, AUD/NZD, etc.)
→ Auto-detected or manually select "Forex Cross"
→ Slightly tighter stops applied automatically
→ Session weight reduced vs. majors
✓ CRYPTOCURRENCIES (BTC, ETH, SOL, etc.)
→ Auto-detected or manually select "Crypto"
→ Wider stops (1.8x multiplier) due to volatility
→ Session filtering less relevant (24/7 markets)
→ Works well on both spot and perpetual futures
✓ INDICES (S&P 500, NASDAQ, DAX, etc.)
→ Auto-detected or manually select "Index"
→ Session opens (NY, London) are important
→ Moderate stop widths applied
✓ COMMODITIES (Gold, Silver, Oil, etc.)
→ Auto-detected or manually select "Commodity"
→ Moderate stops and session awareness
→ Works well on both spot and futures
VISUAL ELEMENTS EXPLAINED
SIGNAL MARKERS:
The indicator offers 3 display styles (choose in settings):
• PREMIUM STYLE (Default)
→ Signal appears below/above candles with connecting line
→ Background panel with grade badge (LONG , SHORT , etc.)
→ Entry price displayed
→ Direction arrow pointing to entry candle
→ Most informative, best for detailed analysis
• MINIMAL STYLE
→ Simple dot marker with grade text next to it
→ Clean, unobtrusive design
→ Best for mobile devices or cluttered charts
→ Less visual noise
• CLASSIC STYLE
→ Diamond marker with grade badge below/above
→ Traditional indicator aesthetic
→ Good balance between info and simplicity
ALL STYLES INCLUDE:
→ Signal tooltips with complete trade plan details
→ Grade display (A+, A, or B)
→ Color coding (bright colors for A+, standard for A/B)
SIGNAL TOOLTIP CONTENTS:
When you hover over any signal marker, you'll see:
→ Signal direction and grade
→ Confluence score (actual points vs. required)
→ Reason for signal (divergence type, reversal pattern)
→ Complete trade plan (Entry, Stop, TP1, TP2)
→ Risk in ticks
→ Risk-to-reward ratios
→ Market conditions at signal (Pulse value, HTF status, Volume, Session)
TRADE LEVEL LINES:
When Trade Tracking is enabled:
• ENTRY LINE (Yellow/Gold)
→ Solid horizontal line at entry price
→ Shaded zone around entry (±ATR buffer)
→ Label showing entry price
→ Extends 20-25 bars into future
• STOP LOSS LINE (Orange/Red)
→ Dashed line at stop level
→ Label showing stop price and distance in ticks
→ Turns dotted and changes color after TP1 hit (breakeven implied)
→ Deleted when trade closes
• TAKE PROFIT 1 LINE (Blue)
→ Dotted line at TP1 level
→ Label showing price and R:R ratio (e.g., "1:1.0")
→ Turns solid and changes to green when hit
→ Deleted after TP1 hit
• TAKE PROFIT 2 LINE (Blue)
→ Solid line at TP2 level
→ Label showing price and R:R ratio (e.g., "1:2.0")
→ This is the "full win" target
→ Deleted when trade closes
OUTCOME MARKERS:
When trade milestones are reached:
• - Green label appears when first target is touched
• - Green label when second target is touched (trade complete)
• - Red label if stop loss hit before any target
• - Orange label if TP1 hit but then stopped out
PREVIOUS DAY LEVELS:
If enabled (Show Previous Day Levels):
• PDH (Previous Day High) - Solid red/orange line
→ Label shows "PDH: "
→ Useful resistance reference for intraday trading
• PDL (Previous Day Low) - Solid green line
→ Label shows "PDL: "
→ Useful support reference for intraday trading
BACKGROUND TINTS:
Subtle background colors indicate states:
→ Light green tint: Active long position being tracked
→ Light red tint: Active short position being tracked
→ Light orange tint: Extreme volatility warning (signals blocked)
DASHBOARD GUIDE
The indicator features TWO dashboard panels:
━━━━━━━━━━━━━━━━━━━━━━━━━━━━━━━━━━━━━━━━━━━━━━━━━━━━━━━━━━━━━━━━━━━━━━━━━━━━━
MAIN DASHBOARD (Top Right by default)
━━━━━━━━━━━━━━━━━━━━━━━━━━━━━━━━━━━━━━━━━━━━━━━━━━━━━━━━━━━━━━━━━━━━━━━━━━━━━
WHEN NO TRADE IS ACTIVE:
→ Bias: Current market bias (BULLISH, BEARISH, NEUTRAL, LEAN LONG/SHORT)
→ Based on Kinetic Pulse position and velocity
→ Helps you understand overall momentum direction
→ Pulse: Current Kinetic Pulse value (0-100 scale)
→ <30 = Oversold (potential long setups developing)
→ >70 = Overbought (potential short setups developing)
→ 40-60 = Neutral zone
→ Volatility: Current volatility regime (LOW, NORMAL, HIGH, EXTREME)
→ Calculated from ATR ratio vs. 100-period average
→ EXTREME volatility blocks all signals (too chaotic)
→ Trend: Market state classification
→ TREND UP / TREND DOWN: ADX > 25, directional movement clear
→ RANGING: ADX < 20, choppy conditions
→ TRANSITIONING: ADX 20-25, developing conditions
→ VOLATILE: Extreme ATR regime
→ Session: Current forex session
→ ASIAN (00:00-08:00 UTC)
→ LONDON (07:00-16:00 UTC)
→ NEW YORK (13:00-22:00 UTC)
→ LDN/NY (13:00-16:00 UTC) - Overlap period, highest volatility
→ OFF-HOURS: Outside major sessions
→ Volume: Current volume vs. 20-bar average
→ Displayed as multiplier (e.g., "1.45x" = 45% above average)
→ Green if >1.3x (high volume, bullish for signal quality)
→ Red if <0.8x (low volume, bearish for signal quality)
→ HTF: Higher timeframe analysis status
→ BULLISH: HTF momentum supports longs
→ BEARISH: HTF momentum supports shorts
→ NEUTRAL: No clear HTF direction
→ Best Score: Highest confluence score currently available
→ Shows both long and short scores
→ Format: " / "
→ Example: "8/7 " means long score is 8, threshold is 7, long is leading
→ Helps you anticipate which direction might signal next
→ PDH/PDL: Previous day high and low prices
→ Quick reference for intraday support/resistance
WHEN TRADE IS ACTIVE:
→ Trade: Direction and grade (e.g., "LONG ")
→ Entry: Entry price of current trade
→ P/L: Current profit/loss
→ Shown in ticks and R-multiples
→ Format: "+45 | +0.75R" or "-20 | -0.35R"
→ Green when positive, red when negative
→ TP1: First target status
→ Shows price and distance if not hit
→ Shows "HIT" in green if reached
→ TP2: Second target price and distance
→ Stop: Stop loss price and current distance from stop
→ Bars: Number of bars since entry (trade duration)
━━━━━━━━━━━━━━━━━━━━━━━━━━━━━━━━━━━━━━━━━━━━━━━━━━━━━━━━━━━━━━━━━━━━━━━━━━━━━
TRADE ANALYSIS PANEL (Bottom Left by default)
━━━━━━━━━━━━━━━━━━━━━━━━━━━━━━━━━━━━━━━━━━━━━━━━━━━━━━━━━━━━━━━━━━━━━━━━━━━━━
This panel provides algorithmic analysis of market conditions. It does NOT provide investment advice or recommendations.
WHEN NO TRADE IS ACTIVE:
Shows scanning status and signal readiness:
→ Long/Short Readiness Gauges
→ Visual bar showing proximity to signal threshold
→ Score display (e.g., "8/7" means 8 points scored, 7 needed)
→ "RDY" indicator when threshold reached
→ Status Messages
→ "Scanning for setups..." - Normal scanning mode
→ "Long setup ready - cooldown: X bars" - Signal qualified but in cooldown
→ "Oversold conditions - watch for reversal" - Setup developing
→ "Choppy conditions detected" - Warning about market state
→ "Extreme volatility - signals blocked" - Safety filter active
WHEN TRADE IS ACTIVE:
Header shows current analysis state:
→ FACTORS ALIGNED (Green) - Everything looks good, confidence 72+
→ POSITIVE BIAS (Light Green) - Conditions favorable, confidence 58-72
→ MIXED SIGNALS (Blue) - Neutral conditions, confidence 48-58
→ FACTORS WEAKENING (Orange) - Concerning signals, confidence 22-48
→ NEGATIVE BIAS (Red) - Poor conditions, confidence <22
Confidence Score:
→ Displayed as percentage (0-100%)
→ Visual gauge (|||||.....)
→ Trend indicator (Rising, Falling, Stable)
→ Shows momentum of confidence change
Factor Breakdown (if enabled):
Shows 6 factor categories with individual scores:
→ Momentum: Is momentum aligned with trade? (-15 to +15 points)
→ Positive if velocity matches trade direction
→ Negative if momentum opposes trade
→ Position: Current R-multiple analysis (-12 to +12 points)
→ Positive if trade is in profit
→ Negative if underwater
→ Score increases as profit grows
→ Volume: Is volume supportive? (-6 to +6 points)
→ Positive if volume above average
→ Negative if volume weak
→ HTF Align: Higher timeframe status (-6 to +8 points)
→ Positive if HTF still supports trade direction
→ Negative if HTF turned against trade
→ Target: Proximity to profit targets (0 to +10 points)
→ Higher score when approaching targets
→ Bonus if TP1 already hit and near TP2
→ Stop Dist: Distance from stop loss (-15 to +3 points)
→ Negative if dangerously close to stop (<0.3 ATR)
→ Positive if well away from stop (>1.5 ATR)
Each factor shows:
• Score value with +/- indicator
• Trend symbol: + (improving), - (deteriorating), = (stable)
• Visual gauge
Guidance Messages:
→ "TARGET 2 APPROACHING" - TP2 within 0.3 ATR
→ "TARGET 1 APPROACHING" - TP1 within 0.3 ATR
→ "STOP PROXIMITY WARNING" - Stop within 0.3 ATR
→ "Factors aligned - Holding" - Positive state, stay in trade
→ "Conditions favorable" - Still looking good
→ "Conditions mixed - " - Neutral assessment
→ "Factors deteriorating" - Warning of weakening setup
→ "Confluence weakening - secure gains" - Consider exit if profitable
COMPACT MODE (Mobile-Friendly):
→ Reduces panel size by showing only essential info
→ Factor icons instead of full breakdowns
→ Simplified guidance messages
→ Perfect for smaller screens
SETTINGS GUIDE
MASTER SETTINGS:
Instrument Type
→ Purpose: Optimizes ATR multipliers and session weights for your asset
→ Options: Auto-Detect (recommended), Forex Major, Forex Cross, Crypto, Index, Commodity
→ Default: Auto-Detect
→ When to change: If auto-detection is incorrect for your symbol
Signal Sensitivity
→ Purpose: Controls how many factors required before generating signals
→ Options:
• Conservative: Requires 12+ for A+, 9+ for A, 7+ for B (fewer, highest quality)
• Balanced: Requires 10+ for A+, 7+ for A, 5+ for B (recommended)
• Aggressive: Requires 8+ for A+, 5+ for A, 3+ for B (more frequent)
→ Default: Balanced
→ When to change: If you want fewer signals (Conservative) or more opportunities (Aggressive)
Enable Trade Signals
→ Purpose: Master on/off switch for signal generation
→ Default: ON
→ When to disable: If you only want to use the analysis dashboards without signals
Enable Trade Tracking
→ Purpose: Tracks active trades and monitors conditions until TP/SL hit
→ Default: ON
→ When to disable: If you manage trades manually and don't want automatic tracking
Show Entry/Stop/Target Levels
→ Purpose: Displays trade plan lines and labels on chart
→ Default: ON
→ When to disable: If you prefer clean charts or manage levels yourself
DISPLAY SETTINGS:
Color Theme
→ Purpose: Optimizes colors for your chart background
→ Options: Dark (for dark charts), Light (for light charts)
→ Default: Dark
Signal Display Style
→ Purpose: Visual style of signal markers
→ Options:
• Premium: Badge with line and background panel (most detailed)
• Minimal: Simple dot with grade text (cleanest)
• Classic: Diamond marker with badge (traditional)
→ Default: Premium
Signal Distance
→ Purpose: How far signal labels appear from price bars (in ATR units)
→ Range: 0.5 to 10.0
→ Default: 2.0
→ When to adjust: Increase to 3.0-4.0 if signals hide behind candle wicks
TP/SL Label Distance
→ Purpose: Spacing of price labels to prevent overlap
→ Range: 0.5 to 5.0
→ Default: 1.5
Show Previous Day Levels
→ Purpose: Display PDH/PDL reference lines
→ Default: ON
→ Best for: Intraday traders who respect previous day levels
MAIN DASHBOARD:
Show Main Dashboard
→ Purpose: Toggle visibility of market conditions table
→ Default: ON
Main Dashboard Position
→ Options: Top Right, Top Left, Bottom Right, Bottom Left
→ Default: Top Right
→ When to change: To avoid overlap with TradingView's built-in panels
TRADE ANALYSIS PANEL:
Show Trade Analysis Panel
→ Purpose: Toggle factor analysis dashboard
→ Default: ON
Analysis Panel Position
→ Options: Top Right, Top Left, Bottom Right, Bottom Left, Middle Right, Middle Left
→ Default: Bottom Left
→ Recommended: Bottom Right or Middle Right to avoid overlap with Main Dashboard
Compact Mode
→ Purpose: Reduces panel size for mobile or smaller screens
→ Default: OFF
→ When to enable: Mobile trading, small screens, or minimalist preference
Show Factor Details
→ Purpose: Displays individual factor scores vs. overall confidence only
→ Default: ON
→ When to disable: For more compact view showing only state and confidence
RISK MANAGEMENT:
Stop Loss Method
→ Purpose: How stop loss distance is calculated
→ Options:
• Structure-Based: Uses swing highs/lows with ATR buffer (recommended)
• ATR-Based: Pure ATR multiplier with min/max constraints
• Fixed ATR: Simple multiplier, no adjustments
→ Default: Structure-Based
→ Impact: Structure-Based respects market geometry but constrains within safe limits
ATR Stop Multiplier
→ Purpose: Multiplier for ATR-based stop calculation
→ Range: 0.5 to 3.0
→ Default: 1.5
→ When to adjust:
• Increase to 2.0-2.5 for more breathing room (fewer false stops)
• Decrease to 1.0-1.2 for tighter stops (but more stop-outs)
Maximum Stop Distance (ATR)
→ Purpose: Cap on stop width to prevent excessive risk
→ Range: 1.0 to 5.0
→ Default: 2.5
→ Impact: If structure-based stop exceeds this, ATR-based stop is used instead
Minimum Stop Distance (ATR)
→ Purpose: Floor on stop width to avoid noise-induced stops
→ Range: 0.2 to 1.0
→ Default: 0.5
→ Impact: Prevents stops too tight to survive normal volatility
Target 1 Risk/Reward Ratio
→ Purpose: R:R for first profit target
→ Range: 0.5 to 2.0
→ Default: 1.0 (1:1 ratio)
→ Common values: 1.0 for quick profit taking, 1.5 for patient trading
Target 2 Risk/Reward Ratio
→ Purpose: R:R for second profit target (full win)
→ Range: 1.0 to 4.0
→ Default: 2.0 (1:2 ratio)
→ Common values: 2.0-3.0 for balanced risk/reward
Minimum R:R Required
→ Purpose: Filters out signals with poor risk/reward
→ Range: 0.5 to 2.0
→ Default: 1.0
→ Impact: Signals where potential reward doesn't meet this ratio are rejected
→ WARNING: Always ensure your position sizing means a stop loss = no more than 1-2% of your account, regardless of R:R ratio
SIGNAL FILTERS:
Session Awareness
→ Purpose: Weights signals higher during major forex sessions
→ Default: ON
→ Impact: Doesn't block signals, but session quality factors into scoring
→ Best for: Forex traders
Session Timezone
→ Purpose: Timezone for session calculations
→ Options: UTC, America/New_York, Europe/London, Asia/Tokyo, Asia/Hong_Kong
→ Default: UTC
→ When to change: Match your broker's server time
Higher Timeframe Alignment
→ Purpose: Checks HTF momentum before generating signals
→ Default: ON
→ Impact: Filters counter-trend signals, improves quality
→ Recommended: Keep enabled
HTF Timeframe
→ Purpose: Which higher timeframe to check
→ Default: Auto (blank field)
→ Auto selection:
• 1m chart → 5m HTF
• 5m chart → 15m HTF
• 15m chart → 1H HTF
• 1H chart → 4H HTF
• 4H+ chart → Daily HTF
→ Manual override: Enter any timeframe (e.g., "60" for 1-hour)
Volume Confirmation
→ Purpose: Requires above-average volume for signals
→ Default: ON
→ Impact: Filters low-liquidity false signals
→ Recommended: Keep enabled
Minimum Volume Ratio
→ Purpose: Volume threshold vs. 20-bar average
→ Range: 0.3 to 2.0
→ Default: 0.8 (80% of average)
→ When to adjust:
• Increase to 1.2-1.5 for only high-volume signals
• Decrease to 0.5-0.7 for more permissive filtering
Structure Clearance Check
→ Purpose: Ensures clear path to targets (no nearby resistance/support)
→ Default: ON
→ Impact: Prevents trades with immediate obstacles
→ Recommended: Keep enabled
Minimum Bars Between Signals
→ Purpose: Cooldown period after each signal
→ Range: 1 to 10
→ Default: 3
→ Impact: After a signal, this many bars must pass before another in same direction
→ When to adjust:
• Increase to 5-7 to prevent over-trading
• Decrease to 1-2 for faster re-entries
ADVANCED TUNING:
Momentum Period
→ Purpose: Base period for Kinetic Pulse calculation
→ Range: 5 to 30
→ Default: 14
→ When to adjust:
• Lower (8-10): More responsive, noisier
• Higher (18-21): Smoother, slower to react
→ Note: If Adaptive Period enabled, this is adjusted automatically
Adaptive Period
→ Purpose: Auto-adjusts momentum period based on volatility
→ Default: ON
→ Impact: Shortens period in high volatility, lengthens in low volatility
→ Recommended: Keep enabled for automatic optimization
Divergence Lookback
→ Purpose: How far back to search for divergence patterns
→ Range: 10 to 60
→ Default: 30
→ When to adjust:
• Shorter (15-20): Only recent divergences
• Longer (40-50): Catches older divergences (may be less relevant)
Swing Detection Bars
→ Purpose: Bars required on each side to confirm swing high/low
→ Range: 2 to 7
→ Default: 3
→ Impact on stops:
• Lower (2-3): More swing points, potentially tighter stops
• Higher (5-7): Only major swings, wider stops
Choppiness Index Threshold
→ Purpose: Threshold above which market considered choppy
→ Range: 38.2 to 80.0
→ Default: 61.8
→ Impact:
• Lower (50-55): Stricter quality filter (fewer signals in ranging markets)
• Higher (65-70): More permissive (allows signals in choppier conditions)
HOW TO READ SIGNALS
SIGNAL ANATOMY:
When a signal appears, you'll see:
1. DIRECTIONAL MARKER
→ Arrow, dot, or diamond pointing to entry candle (depends on style)
→ Positioned below price for LONG, above price for SHORT
→ Connected to price with line (Premium style)
2. GRADE BADGE
→ Displays signal quality: LONG , SHORT , etc.
→ Color coding:
• Bright green/cyan for A+ longs
• Standard green for A/B longs
• Bright pink/magenta for A+ shorts
• Standard red for A/B shorts
3. ENTRY PRICE (Premium style only)
→ Shows exact entry price at signal generation
4. TOOLTIP (all styles)
→ Hover over signal to see complete trade plan
→ Includes: Entry, Stop, TP1, TP2, Risk, R:R ratios, market conditions, signal reason, confluence score
INTERPRETING GRADES:
→ A+ SIGNALS (Highest Quality)
• 8-12+ confirming factors aligned
• Multiple divergences OR strong momentum reversal
• HTF alignment + volume + session timing + clear structure
• These are your highest-probability setups
• Recommended action: Give these priority, consider larger position size
→ A SIGNALS (High Quality)
• 5-9+ confirming factors aligned
• Good confluence, most key factors present
• Missing 1-2 optimal conditions
• These are still quality trades
• Recommended action: Standard position size, solid setups
→ B SIGNALS (Moderate Quality)
• 3-7+ confirming factors aligned
• Minimum viable confluence
• May be missing HTF alignment, volume, or session timing
• Higher variance outcomes
• Recommended action: Smaller position size or skip if conservative
SIGNAL NARRATIVE:
Each signal tooltip includes a narrative explaining WHY it was generated:
→ "Multi-divergence at oversold extreme"
• Multiple oscillators showing bullish divergence
• Kinetic Pulse in oversold zone
• High-quality reversal setup
→ "Bullish divergence near support"
• Divergence detected
• Price near key support level (swing low or PDL)
• Structure confluence
→ "Momentum reversal with HTF alignment"
• Kinetic Pulse velocity reversing
• Higher timeframe supports direction
• Strong trend-following setup
→ "Oversold momentum reversal"
• Extreme Kinetic Pulse reading reversing
• May not have divergence but strong momentum shift
READING THE TRADE PLAN:
Every signal comes with a complete trade plan:
→ ENTRY: The close price of the signal candle
• This is where the signal triggered
• If using limit orders, you might improve on this price
→ STOP: Calculated stop loss level
• Based on your Stop Loss Method setting
• Distance shown in ticks
• Risk tolerance: Ensure this represents ≤1-2% of your account
→ TP1: First profit target
• Default: 1:1 risk-reward
• This is your partial profit or first exit
• Consider taking 50% off at TP1
→ TP2: Second profit target
• Default: 1:2 risk-reward
• This is your "full win" target
• Hold remaining position for this level
SIGNAL FREQUENCY EXPECTATIONS:
Frequency varies by timeframe, sensitivity, and market conditions:
→ AGGRESSIVE MODE
• Lower timeframes (1m-5m): 5-15 signals per day
• Mid timeframes (15m-1H): 2-5 signals per day
• Higher timeframes (4H-D): 1-3 signals per week
→ BALANCED MODE (Default)
• Lower timeframes: 3-8 signals per day
• Mid timeframes: 1-3 signals per day
• Higher timeframes: 2-5 signals per week
→ CONSERVATIVE MODE
• Lower timeframes: 1-4 signals per day
• Mid timeframes: 0-2 signals per day
• Higher timeframes: 1-3 signals per week
Note: Frequency also depends on market volatility and trending vs. ranging conditions.
Example - Kinetic Scalper Trade Sequence
Here's an example showing the complete trade lifecycle with all dashboard transitions, annotations, and descriptions.
INSTRUMENT & TIMEFRAME DETAILS
Symbol: Nifty 50 Index (NSE)
Date: December 15, 2025
Session: London session (active trading hours)
Instrument Type: Index (auto-detected)
TRADE SEQUENCE BREAKDOWN
SCREENSHOT 1: Pre-Signal Setup Building (Image 1)
Time: ~12:00-14:30 UTC+5:30(approx.)
Price Action: Uptrend showing signs of exhaustion near 26,200
Market State: Price at session highs
Main Dashboard (Top Right):
- Bias: LEAN SHORT
- Pulse: 58.9 (approaching overbought)
- Volatility: NORMAL
- Trend: TRANSITIONING
- Session: LONDON (favorable timing)
- Volume: 0.98x (slightly below average)
- HTF: BULLISH (caution for counter-trend)
- Best Score: 9/5 (Short score building)
- PDH/PDL: 26098.25 / 25938.95
Trade Analysis Panel (Bottom Left):
- Status: NO ACTIVE TRADE
- Long Score: 5/5 (RDY)
- Short Score: 9/5 (RDY)
- Panel Message: "Short pattern developing - score: 9"
Description :
Setup Development Phase: The indicator identifies a potential short opportunity as price reaches the previous day's high. The short confluence score has climbed to 9/15 points, meeting the 'Balanced' sensitivity threshold for a Grade B signal. Notice the 'LEAN SHORT' bias and the Kinetic Pulse reading of 58.9 approaching overbought territory. The Trade Analysis panel shows 'Short pattern developing' with 9/5 factors aligned. Key factors: momentum approaching reversal zone, price at resistance (PDH), and London session providing favorable conditions.
SCREENSHOT 2: Signal Generated & Trade Entered (Image 2)
Time: ~13:00 UTC+5:30 (signal bar)
Entry Price: 26,184.65
Signal Grade: Grade
Main Dashboard (Top Right):
- Trade: SHORT
- Entry: 26184.65
- P/L: 5.95 pts | +0.2R (early positive movement)
- TP1: 26157.00 (33.2 pts away)
- TP2: 26129.35 (60.84 pts away)
- Stop: 26212.30 (22.1 pts away)
- Bars: 1 (just entered)
Trade Analysis Panel (Bottom Left):
- Header: TRADE ANALYSIS
- Status Bar: "Conditions mixed - improving 57%"
- Confidence: 57% RISING
- Factor Breakdown:
- Momentum: -4 (velocity not yet aligned)
- Position: +4 (slight profit)
- Volume: +2 = (volume present)
- HTF Align: +2 = (not strongly aligned)
- Target: +0 - (far from TP)
- Stop Dist: +3 - (good distance)
- Bottom Status: "Conditions mixed - Monitoring"
- Disclaimer: "Analysis only - Not financial advice"
Description:
Signal Activation: A Grade A short signal triggers at 26,184.65 after the short confluence score reached qualifying levels. The indicator places a structure-based stop loss at 26,212.30 (27.65 points risk) with dual targets at 1:1 and 1:2 risk-reward ratios.
The Trade Analysis Panel immediately begins monitoring with an initial confidence score of 57% - classified as 'MIXED SIGNALS' but showing a 'RISING' trend. Factor analysis reveals: momentum not yet aligned (-4 points as price just reversed), position slightly favorable (+4 points already +0.2R), volume adequate (+2), HTF showing weak alignment (+2 as we're counter-trend), stop well-placed (+3), but targets still distant (0 points).
Notice how the Main Dashboard switches from market scanning mode to active trade tracking, now displaying entry price, live P/L in both points (5.95 pts) and R-multiples (+0.2R), and distances to all key levels. The analysis panel provides real-time factor scoring to help monitor trade health.
SCREENSHOT 3: TP1 Hit - Trade Performing Well (Image 3)
Time: ~14:20 UTC+5:30(approx)
Price: ~26,154 (TP1 zone)
Bars in Trade: 29
Main Dashboard (Top Right):
- Trade: SHORT
- Entry: 26184.65
- P/L: 30.85 pts | +1.12R (excellent progress)
- TP1: HIT (displayed in green)
- TP2: 26129.35 (24.44 pts away)
- Stop: 26212.30 (58.5 pts away - well protected)
- Bars: 29
Trade Analysis Panel (Bottom Left):
- Header: TRADE ANALYSIS
- Status Bar: "Multiple factors positive"
- Confidence: 78% RISING
- Factor Breakdown:
- Momentum: +8 = (ALIGNED)
- Position: +8 + (strong profit zone)
- Volume: +2 + (continued support)
- HTF Align: +8 = (now strongly aligned)
- Target: +10 + (TP1 achieved, approaching TP2)
- Stop Dist: +3 + (excellent cushion)
- Bottom Status: "Multiple factors positive"
- Visual State: Green background (FACTORS ALIGNED state)
Description:
Trade Execution Phase - First Target Achieved: After 29 bars , price reaches the first take-profit target at 26,157.00. The ' ' marker confirms partial profit taking. Current P/L shows +30.85 points (+1.12R), exceeding the initial 1:1 risk-reward.
The Trade Analysis Panel shows dramatic improvement - confidence has surged to 78% (FACTORS ALIGNED state) with most factors now positive:
- Momentum factor improved to +8 (velocity aligned with trade direction)
- Position factor at +8 (over +1R profit zone)
- HTF Align jumped to +8 (higher timeframe now confirming the move)
- Target factor maxed at +10 (TP1 achieved, TP2 within reach)
- Stop Distance at +3 (58.5 points cushion providing safety)
Notice the panel status displays 'Multiple factors positive' with a green-tinted background, indicating optimal trade conditions. The confidence trend shows 'RISING' suggesting continued momentum. With TP1 secured and only 24.44 points to TP2, the trade is well-positioned for a full 1:2R win.
SCREENSHOT 4: TP2 Reached - Trade Complete (Image 4)
Time: ~15:00+ UTC+5:30
Final Exit: 26,129.35 (TP2)
Final Result: Full TP2 win
Main Dashboard (Top Right):
- Bias: NEUTRAL (reverted to scanning mode)
- Pulse: 45.2 (returned to neutral zone)
- Volatility: NORMAL
- Trend: TREND DOWN (confirmed the move)
- Session: LONDON
- Volume: 1.26x (increased as move developed)
- HTF: BEARISH (fully aligned post-trade)
- Best Score: 5/5 (neutral after completion)
Trade Analysis Panel (Bottom Left):
- Status: NO ACTIVE TRADE (reverted)
- Long Score: 5/5 (RDY)
- Short Score: 5/5 (RDY)
- Panel Message: "Scanning - prime session active"
- Light blue/cyan background (back to scanning mode)
Description:
Trade Completion - Full Target Achieved: The short trade reaches its second take-profit target at 26,129.35, securing a complete 1:2 risk-reward win. The ' ' marker confirms the exit. Final results:
- Entry: 26,184.65
- Exit: 26,129.35
- Profit: 55.30 points (approximately +2.0R)
- Outcome: Full TP2 success
Post-Trade Analysis: After trade closure, the indicator automatically returns to market scanning mode. The Main Dashboard reverts to showing market conditions rather than trade metrics. Notice how the 'Trend' now displays 'TREND DOWN' - confirming the move we captured. Volume increased to 1.26x during the winning move, validating the signal quality.
The Trade Analysis Panel switches back to 'NO ACTIVE TRADE' status and resumes displaying long/short setup scores. The confidence-based factor monitoring was instrumental throughout the trade:
- Initial entry at 57% confidence (MIXED SIGNALS)
- Peak confidence of 78% at TP1 (FACTORS ALIGNED)
- Real-time factor updates helped confirm trade validity
This example demonstrates the indicator's complete workflow: setup identification → signal generation → entry execution → live trade monitoring → systematic exit at targets.
KEY FEATURES DEMONSTRATED
1. Dual Dashboard System
- Main Dashboard: Market conditions (scanning) → Trade metrics (active position)
- Analysis Panel: Setup scores (scanning) → Factor-based confidence (in-trade)
2. Visual Trade Management
- Color-coded entry zones (yellow)
- Risk levels clearly marked (red dashed stop)
- Profit targets with R:R ratios labeled
- Achievement markers ( , )
3. Real-Time Factor Analysis
- 6-factor scoring system (Momentum, Position, Volume, HTF, Target, Stop Dist)
- Confidence percentage with trend indicators
- State machine (MIXED → FACTORS ALIGNED)
- Hysteresis prevents false state changes
4. Risk Management
- Structure-based stop placement (respects swing highs)
- Multiple take-profit levels (1:1 and 1:2 R:R)
- Live P/L tracking in points and R-multiples
- Distance monitoring to all key levels
This complete example showcases the indicator's progression from setup identification through trade completion, demonstrating how the dual-dashboard system and factor-based analysis provide continuous trade guidance. The structured stop-loss and dual-target approach delivered the planned 1:2 risk-reward ratio with systematic, rule-based execution.
ALERT SYSTEM
The indicator includes 9 built-in alert conditions:
SIGNAL ALERTS:
→ High-Grade Long Signal (A+)
• Triggers only on A+ long signals
• For traders who want only the highest-quality longs
• Message: "KINETIC SCALPER: LONG @ "
→ High-Grade Short Signal (A+)
• Triggers only on A+ short signals
• For traders who want only the highest-quality shorts
• Message: "KINETIC SCALPER: SHORT @ "
→ Long Signal
• Triggers on ANY qualified long signal (A+, A, or B)
• For traders who want all long opportunities
• Message: "KINETIC SCALPER: LONG @ "
→ Short Signal
• Triggers on ANY qualified short signal
• For traders who want all short opportunities
• Message: "KINETIC SCALPER: SHORT @ "
TRADE MANAGEMENT ALERTS:
→ TP1 Hit
• Triggers when first profit target is reached
• Useful for partial profit taking notifications
• Message: "KINETIC SCALPER: TP1 REACHED"
→ TP2 Reached
• Triggers when second profit target is reached
• Trade is complete, full win achieved
• Message: "KINETIC SCALPER: TP2 REACHED"
→ Stop Loss Hit
• Triggers when stop loss is reached
• Important for trade management and risk tracking
• Message: "KINETIC SCALPER: STOP LOSS"
ANALYSIS STATE ALERTS:
→ Analysis State: Negative Bias
• Triggers when factor analysis enters "Negative Bias" state
• Warning that trade conditions are deteriorating
• Consider reducing position or preparing to exit
• Message: "KINETIC SCALPER: Analysis state changed to NEGATIVE BIAS"
→ Analysis State: Factors Weakening
• Triggers when factor analysis enters "Factors Weakening" state
• Caution that confluence is diminishing
• Monitor trade closely
• Message: "KINETIC SCALPER: Analysis state changed to FACTORS WEAKENING"
HOW TO SET UP ALERTS:
1. Click the "Create Alert" button in TradingView
2. Condition: Select "Kinetic Scalper "
3. Choose your desired alert from the dropdown
4. Configure your alert options:
→ Once Per Bar Close (recommended for non-repainting)
→ Frequency: Once Per Bar Close or Only Once
5. Set expiration and notification methods (popup, email, webhook, etc.)
6. Create alert
RECOMMENDED ALERT STRATEGY:
For active traders:
→ Set "Long Signal" and "Short Signal" alerts for all opportunities
→ Set "TP1 Hit", "TP2 Reached", and "Stop Loss Hit" for trade management
→ Consider "Analysis State: Negative Bias" for trade monitoring
For selective traders:
→ Set only "High-Grade Long Signal (A+)" and "High-Grade Short Signal (A+)"
→ Focus on the absolute highest-quality setups
→ Set TP/SL alerts for position management
USAGE TIPS & BEST PRACTICES
SIGNAL SELECTION:
✓ GRADE MATTERS
→ A+ signals have statistically more confluence factors
→ If you're conservative, trade only A+ signals
→ B signals can work but require more discretion
✓ CONFLUENCE WITH YOUR ANALYSIS
→ Use this indicator as CONFIRMATION, not sole decision criteria
→ Combine with your own support/resistance analysis
→ Check for fundamental events (news, economic data)
→ Respect major round numbers and psychological levels
✓ SESSION TIMING (Forex)
→ Best signals often occur during London/NY overlap
→ Avoid signals 10 minutes before major news releases
→ Asian session signals can be valid but lower liquidity
✓ TIMEFRAME CONFLUENCE
→ If you get an A+ signal on 15m, check if 1H chart agrees
→ Higher timeframe confirmation adds conviction
→ Avoid signals that oppose the daily/4H trend
TRADE MANAGEMENT:
✓ POSITION SIZING
→ ALWAYS size positions so stop loss = 1-2% of account
→ Never risk more than you can afford to lose
→ Smaller position on B signals, standard on A, larger on A+ (within limits)
✓ PARTIAL PROFIT TAKING
→ Consider taking 50% off at TP1
→ Move stop to breakeven after TP1 hit
→ Let remaining position run to TP2
✓ TRAILING STOPS
→ The indicator doesn't auto-trail stops (manual decision)
→ After TP1, you might manually move stop to entry (breakeven)
→ Consider ATR-based trailing stop for runners
✓ WATCH THE ANALYSIS PANEL
→ If state changes to "Factors Weakening" while in profit, consider exit
→ "Negative Bias" during a trade is a strong warning
→ "Factors Aligned" confirms your trade thesis is still valid
RISK MANAGEMENT:
✓ NEVER IGNORE STOPS
→ The calculated stop is there for a reason
→ Moving stop further away increases risk exponentially
→ If stopped out, accept it and wait for next setup
✓ AVOID REVENGE TRADING
→ If you get stopped out, resist urge to immediately re-enter
→ Signal cooldown helps with this
→ Wait for next qualified signal
✓ RESPECT VOLATILITY WARNINGS
→ If indicator shows "EXTREME" volatility, signals are blocked for a reason
→ Don't force trades in chaotic conditions
→ Wait for regime to normalize
✓ CORRELATION RISK
→ Be aware of correlation if trading multiple pairs
→ EUR/USD and GBP/USD are highly correlated
→ Don't stack risk on correlated instruments
OPTIMIZATION:
✓ START WITH DEFAULTS
→ Default settings are well-tested
→ Don't over-optimize for recent market behavior
→ Give settings at least 20-30 trades before judging
✓ TIMEFRAME-SPECIFIC ADJUSTMENTS
→ Lower timeframes: Consider increasing Signal Distance to 3.0-4.0
→ Higher timeframes: ATR Stop Multiplier might go to 2.0-2.5
→ Crypto: Ensure Instrument Type is set to "Crypto" for proper stops
✓ SENSITIVITY CALIBRATION
→ Too many signals? Switch to Conservative
→ Missing good setups? Try Balanced or Aggressive
→ Quality > Quantity always
✓ KEEP A JOURNAL
→ Track which signal grades work best for you
→ Note which sessions produce best results
→ Review stopped trades for patterns
THINGS TO AVOID:
✗ DON'T chase signals after several bars have passed
✗ DON'T ignore the stop loss or move it further away
✗ DON'T overtrade by taking every B-grade signal
✗ DON'T trade during major news if you're not experienced
✗ DON'T use this as your only analysis tool
✗ DON'T expect 100% win rate (no indicator has this)
✗ DON'T risk more than 1-2% per trade regardless of signal grade
UNDERSTANDING THE METHODOLOGY
WHY VOLUME WEIGHTING?
Traditional momentum oscillators treat all price moves equally. A 10-point move on low volume is weighted the same as a 10-point move on high volume.
The Kinetic Pulse corrects this by:
→ Calculating volume ratio vs. 20-bar average
→ Applying square root transformation to volume ratio (prevents extreme weights)
→ Multiplying price changes by volume weight
→ Result: High-volume moves influence the oscillator more than low-volume noise
This helps filter false breakouts and emphasizes moves with participation.
WHY FISHER TRANSFORM?
Fisher Transform is a mathematical transformation that:
→ Normalizes probability distributions
→ Creates sharper turning points
→ Amplifies extremes while compressing the middle
→ Makes overbought/oversold levels more distinct
Applied to the Kinetic Pulse, it helps identify genuine extremes vs. noise.
WHY MULTI-OSCILLATOR DIVERGENCE?
Single-source divergence can give false signals. By requiring divergence confirmation across multiple oscillators (Kinetic Pulse, CCI, Stochastic), the system filters out:
→ Divergences caused by calculation quirks in one oscillator
→ Temporary momentum anomalies
→ False divergence on noisy, low-timeframe charts
Multiple sources confirming the same pattern increases reliability.
WHY ADAPTIVE PERIODS?
Fixed periods can be:
→ Too slow during high volatility (miss fast reversals)
→ Too fast during low volatility (generate noise)
The adaptive system:
→ Shortens period when ATR ratio > 1.3 (high volatility = need faster response)
→ Lengthens period when ATR ratio < 0.7 (low volatility = need noise filtering)
→ Keeps period in reasonable range (60% to 140% of base period)
→ Result: Oscillator adjusts to current market pace automatically
WHY HYSTERESIS IN STATE MACHINE?
Without hysteresis, the analysis state would flip-flop on every bar, creating:
→ Confusing, contradictory guidance
→ Analysis paralysis
→ Lack of actionable information
Hysteresis solves this by:
→ Using different thresholds to ENTER vs. EXIT a state
→ Example: Enter "Factors Aligned" at 72+ confidence, but don't exit until <62
→ This creates stable states that persist through minor fluctuations
→ Requires minimum commitment period (3 bars) before state changes
→ Overrides commitment for significant events (near TP/SL)
→ Result: Stable, trustworthy analysis that changes only when truly warranted
WHY CONFIDENCE SMOOTHING?
Raw factor scores fluctuate bar-by-bar based on momentary conditions. Smoothing:
→ Uses 5-period EMA on raw confidence scores
→ Filters out single-bar anomalies
→ Preserves genuine trends in confidence
→ Prevents false state transitions
→ Result: More reliable assessment of actual trade health
WHY INSTRUMENT-SPECIFIC PARAMETERS?
Different instruments have different characteristics:
→ Forex is highly liquid, respects technical levels well, standard ATR works
→ Crypto is extremely volatile, needs wider stops (1.8x) to avoid false stops
→ Indices respect session opens strongly, session weighting is important
→ Commodities fall in between
Auto-detection applies research-based multipliers automatically.
WHY STRUCTURE-BASED STOPS?
ATR-based stops can:
→ Place stop in middle of consolidation (easily hit)
→ Ignore obvious invalidation levels
→ Be too tight during expansion or too wide during contraction
Structure-based stops:
→ Use actual swing highs/lows (where traders actually place stops)
→ Add small ATR buffer to avoid stop hunting
→ Constrain within min/max ATR limits for safety
→ Result: Stops that respect market geometry while managing risk
DISCLAIMER & RISK WARNING
READ THIS CAREFULLY BEFORE USING THIS INDICATOR
This indicator is provided for EDUCATIONAL and INFORMATIONAL purposes only.
❌ NOT FINANCIAL ADVICE
This indicator does NOT constitute financial advice, investment recommendations, or solicitation to buy or sell any financial instrument. All information is for educational purposes only.
❌ NO GUARANTEES
→ Past performance does NOT guarantee future results
→ No indicator can predict future price movements with certainty
→ Signal grades represent confluence, NOT win probability
→ A+ signals can lose, B signals can win - markets are probabilistic
❌ SUBSTANTIAL RISK
Trading financial instruments involves SUBSTANTIAL RISK of loss:
→ You can lose your entire investment
→ Leveraged trading amplifies both gains AND losses
→ Never trade with money you cannot afford to lose
→ Never risk more than 1-2% of your account per trade
❌ YOUR RESPONSIBILITY
→ All trading decisions are YOUR responsibility
→ You must conduct your own analysis before entering trades
→ Consult a licensed financial advisor before trading
→ Understand the risks specific to your jurisdiction and situation
→ Only trade with capital you can afford to lose completely
❌ NO HOLY GRAIL
→ This indicator is a TOOL, not a complete trading system
→ It should be used as part of a broader analysis framework
→ Combine with your own technical analysis, risk management, and judgment
→ No indicator works 100% of the time in all market conditions
❌ ANALYSIS PANEL DISCLAIMER
The "Trade Analysis Panel" provides ALGORITHMIC ANALYSIS of market factors.
→ It does NOT provide investment advice or recommendations
→ Factor scores are mathematical calculations, not predictions
→ Guidance messages are informational, not directives
→ All trading decisions remain your responsibility
❌ BACKTESTING LIMITATIONS
→ This is an indicator, not a strategy, so no backtesting results are provided
→ Any backtesting you perform includes hindsight bias and optimization bias
→ Historical performance does not indicate future performance
→ Slippage, commissions, and real-world execution differ from backtests
❌ MARKET CONDITIONS
→ This indicator performs differently in trending vs. ranging markets
→ Extreme volatility can produce false signals or whipsaws
→ Low liquidity periods increase execution risk
→ Major news events can invalidate technical analysis
BY USING THIS INDICATOR, YOU ACKNOWLEDGE:
→ You have read and understood this disclaimer
→ You accept full responsibility for your trading decisions
→ You understand the substantial risks involved in trading
→ You will not hold the author liable for any losses incurred
→ You are using this tool as part of your own due diligence process
KEY FEATURES SUMMARY
✅ Volume-Weighted Kinetic Pulse Engine (proprietary momentum calculation)
✅ 15-Factor Confluence Scoring System (graded signals: A+, A, B)
✅ Multi-Oscillator Divergence Detection (Pulse + CCI + Stochastic)
✅ Higher Timeframe Trend Alignment Filter
✅ Adaptive Period Adjustment (volatility-responsive)
✅ Instrument-Aware Calibration (Forex, Crypto, Indices, Commodities)
✅ Structure-Based Stop Loss Calculation (respects swing highs/lows)
✅ Automated Trade Tracking (entry, stop, TP1, TP2, P/L)
✅ Real-Time Factor Analysis State Machine (5-state system with hysteresis)
✅ Session Awareness (Asian, London, New York, Overlap)
✅ Volatility Regime Detection (blocks signals in extreme conditions)
✅ Choppiness Filter (reduces signals in ranging markets)
✅ Volume Confirmation (relative volume and delta analysis)
✅ Clean Air Check (validates clear path to targets)
✅ Comprehensive Dashboards (market conditions + trade analysis)
✅ Customizable Display (3 signal styles, color themes, positioning)
✅ 9 Built-In Alert Conditions (signals, TP/SL hits, state changes)
✅ Fully Non-Repainting (barstate.isconfirmed, lookahead_off)
✅ Previous Day Levels (PDH/PDL reference lines)
✅ Mobile-Friendly Compact Mode (for smaller screens)
TECHNICAL SPECIFICATIONS
→ Pine Script Version: v6
→ Indicator Type: Overlay (displays on price chart)
→ License: Mozilla Public License 2.0
→ Copyright: BULLBYTE
→ Object Limits: 300 labels, 100 lines, 50 boxes
→ Memory Management: Automatic cleanup system (FIFO queue)
→ Repainting: Non-repainting (signals confirmed on bar close)
→ Timeframe Support: All timeframes (1s to Monthly)
→ Instrument Support: Forex, Crypto, Indices, Commodities, Stocks
→ HTF Data Handling: lookahead_off with historical offset
VERSION HISTORY
v1.0 - Initial Release
→ Kinetic Pulse engine with volume weighting and Fisher Transform
→ 15-factor confluence scoring system
→ Trade analysis state machine with hysteresis
→ Automated trade tracking and monitoring
→ Dual dashboard system (market conditions + factor analysis)
→ 9 alert conditions
→ 3 signal display styles
→ Instrument-aware calibration
→ Full risk management framework
WHO IS THIS INDICATOR FOR?
IDEAL FOR:
✓ Scalpers and day traders seeking high-confluence reversal entries
✓ Swing traders who want quality over quantity
✓ Traders who appreciate systematic, rules-based analysis
✓ Multi-timeframe traders who value HTF confirmation
✓ Forex traders who respect session timing
✓ Crypto traders needing volatility-adjusted parameters
✓ Traders who want complete trade management (entry, stop, targets)
✓ Analytical traders who want transparency in signal generation
NOT IDEAL FOR:
✗ Traders seeking a "set and forget" holy grail system
✗ Traders who don't want to learn the methodology
✗ Traders unwilling to accept losing trades as part of the process
✗ Traders who need constant signals (this is a quality-focused system)
✗ Traders who ignore risk management
FINAL THOUGHTS
The Kinetic Scalper is the result of extensive research into momentum behavior, volume confirmation, and multi-factor confluence analysis. It's designed to identify high-probability reversal setups while maintaining strict risk management and providing complete transparency.
This is NOT a magic solution. It's a sophisticated TOOL that requires:
→ Understanding of the methodology
→ Proper risk management discipline
→ Patience to wait for quality setups
→ Willingness to accept losses as part of trading
→ Integration with your own analysis and judgment
Used properly as part of a complete trading plan, the Kinetic Scalper can help you identify high-confluence opportunities and manage trades systematically.
Remember: Quality over quantity. Discipline over emotion. Risk management over everything.
Trade smart. Trade safe.
© 2025 BULLBYTE | Kinetic Scalper v1.0 | For Educational Purposes Only
