Market Structure Volume Time Velocity ProfileThis is the Market Structure Volume Time Velocity Profile (MSVTVP). It combines event-based profiling with advanced metrics like Time and Velocity (Flow Rate). Instead of fixed time periods, profiles are anchored to critical market events (Swings, Structure Breaks, Delta Breaks), giving you a precise view of value development during specific market phases.
## The 3 Dimensions of the Market
Unlike standard tools that only show Volume, MSVTVP allows you
to switch between three critical metrics:
1. **VOLUME Profile (The "Where"):**
* Shows standard acceptance. High volume nodes (HVN)
are magnets for price.
2. **TIME Profile (The "How Long"):**
* Similar to TPO, it measures how long price spent at each
level.
* **High Time:** True acceptance and fair value.
* **Low Time:** Rejection or rapid movement.
3. **VELOCITY Profile (The "How Fast"):**
* Measures the **speed of trading** (Contracts per Second).
This reveals the hidden intent of market participants.
* **High Velocity (Fast Flow):** Aggression. Initiative
buyers/sellers are hitting market orders rapidly. Often
seen at breakouts or in liquidity vacu.
* **Low Velocity (Slow Flow):** Absorption. Massive passive
limit orders are slowing price down despite high volume.
Often seen at major reversals ("hitting a brick wall").
Key Features:
1. **Event-Based Profile Anchoring:** The indicator starts a new
profile based on one of three user-selected events
('Profile Anchor'):
- **Swing:** A new profile begins when the 'impulse baseline'
(derived from intra-bar delta) changes. This baseline
adjusts when a new **price pivot** is confirmed: When a
price **high** forms, the baseline moves to the **lower**
of its previous level or the peak delta (max of
delta O/C) at the pivot. When a price **low** forms, it
moves to the **higher** of its previous level or the
trough delta (min of delta O/C) at the pivot.
- **Structure:** A new profile begins immediately on the bar
that *confirms* a market structure break (e.g., a new HH
or LL, based on a sequence of price pivots).
- **Delta:** A new profile begins immediately on the bar
that *confirms* a break in the *cumulative delta's*
market structure (e.g., a new HH or LL in the delta).
Both 'Swing' and 'Delta' anchors are derived from the same
**continuous (non-resetting) Cumulative Volume Profile Delta (CVPD)**,
which is built from the intra-bar statistical analysis.
2. **Statistical Profile Engine:** For each bar in the anchored
period, the indicator builds a volume profile on a lower
'Intra-Bar Timeframe'. Instead of simple tick counting, it
uses advanced statistical models:
- **Allocation ('Allot model'):** 'PDF' (Probability Density
Function) distributes volume proportionally across the
bar's range based on an assumed statistical model
(e.g., T4-Skew). 'Classic' assigns all volume to
the close.
- **Buy/Sell Split ('Volume Estimator'):** 'Dynamic'
applies a model that analyzes candle wicks and
recent trend to estimate buy/sell pressure. 'Classic'
classifies all volume based on the candle color.
3. **Visualization & Lag:** The indicator plots the final
profile (as a polygon) and the developing statistical
lines (POC, VA, VWAP, StdDev).
- **Note on Lag:** All anchor events require `Pivot Right Bars`
for confirmation.
- In 'Structure' and 'Delta' mode, the developing lines
(POC, VA, etc.) are plotted using a **non-repainting**
method (showing the value from `pivRi` bars ago).
- In 'Swing' mode, the profile is plotted **retroactively**,
starting *from the bar where the pivot occurred*. The
developing lines are also plotted with this full
`pivRi` lag to align with the past data.
4. **Flexible Display Modes:** The finalized profile can be displayed
in three ways: 'Up/Down' (buy vs. sell), 'Total' (combined
volume), and 'Delta' (net difference).
5. **Dynamic Row Sizing:** Includes an option ('Rows per Percent')
to automatically adjust the number of profile rows (buckets)
based on the profile's price range.
6. **Integrated Alerts:** Includes 13 alerts that trigger for:
- A new profile reset ('Profile was resetted').
- Price crossing any of the 6 developing levels (POC,
VA High/Low, VWAP, StdDev High/Low).
- **Alert Lag Assumption:** In 'Swing' mode, alerts are
delayed to match the retroactively plotted lines.
In 'Structure' and 'Delta' modes, alerts fire in
**real-time** based on the *current price* crossing
the *current (repainting)* value of the metric, which
may **differ from the non-repainting plotted line.**
**Caution: Real-Time Data Behavior (Intra-Bar Repainting)**
This indicator uses high-resolution intra-bar data. As a result, the
values on the **current, unclosed bar** (the real-time bar) will
update dynamically as new intra-bar data arrives. This includes
the values used for real-time alerts in 'Structure' and
'Delta' modes.
---
**DISCLAIMER**
1. **For Informational/Educational Use Only:** This indicator is
provided for informational and educational purposes only. It does
not constitute financial, investment, or trading advice, nor is
it a recommendation to buy or sell any asset.
2. **Use at Your Own Risk:** All trading decisions you make based on
the information or signals generated by this indicator are made
solely at your own risk.
3. **No Guarantee of Performance:** Past performance is not an
indicator of future results. The author makes no guarantee
regarding the accuracy of the signals or future profitability.
4. **No Liability:** The author shall not be held liable for any
financial losses or damages incurred directly or indirectly from
the use of this indicator.
5. **Signals Are Not Recommendations:** The alerts and visual signals
(e.g., crossovers) generated by this tool are not direct
recommendations to buy or sell. They are technical observations
for your own analysis and consideration.
Volume

Periodic Volume Time Velocity ProfileThis is the Periodic Volume Time Velocity Profile (PVTVP). It is an advanced professional profiling tool that goes beyond standard volume analysis by introducing Time and Velocity (Flow Rate) as profile dimensions.
By analyzing high-resolution intra-bar data, it builds
precise profiles for any custom period (Session, Day, Week, etc.),
helping you understand not just *where* the market traded,
but *how* it traded there.
## The 3 Dimensions of the Market
Unlike standard tools that only show Volume, PVTVP allows you
to switch between three critical metrics:
1. **VOLUME Profile (The "Where"):**
* Shows standard acceptance. High volume nodes (HVN)
are magnets for price.
2. **TIME Profile (The "How Long"):**
* Similar to TPO, it measures how long price spent at each
level.
* **High Time:** True acceptance and fair value.
* **Low Time:** Rejection or rapid movement.
3. **VELOCITY Profile (The "How Fast"):**
* Measures the **speed of trading** (Contracts per Second).
This reveals the hidden intent of market participants.
* **High Velocity (Fast Flow):** Aggression. Initiative
buyers/sellers are hitting market orders rapidly. Often
seen at breakouts or in liquidity vacuums.
* **Low Velocity (Slow Flow):** Absorption. Massive passive
limit orders are slowing price down despite high volume.
Often seen at major reversals ("hitting a brick wall").
## Key Features
1. **Statistical Volume Profile Engine:** For each bar in the selected
period, the indicator builds a complete volume profile on a lower
'Intra-Bar Timeframe'. Instead of simple tick counting, it uses
**statistical models ('PDF' allocation)** to distribute volume
across price levels and **advanced classifiers ('Dynamic' split)**
to determine the buy/sell pressure within that profile.
2. **Flexible Profile Display:** The **finalized profile** (plotted at
the end of each period) can be visualized in three distinct
ways: 'Up/Down' (buy vs. sell), 'Total' (combined volume),
and 'Delta' (net difference).
3. **Developing Key Levels:** The indicator also plots the developing
Point of Control (POC), Value Area (VA), VWAP, and Standard
Deviation bands in real-time as the period unfolds, providing
live insights into the emerging market structure.
4. **Dynamic Row Sizing:** Includes an option ('Rows per Percent')
to automatically adjust the number of profile rows (buckets)
based on the profile's price range, maintaining a consistent
visual density.
5. **Integrated Alerts:** Includes 12 alerts that trigger when the
main price crosses over or under the key developing levels:
POC, VWAP, Value Area High/Low, and the +/- Standard
Deviation bands.
**Caution: Real-Time Data Behavior (Intra-Bar Repainting)**
This indicator uses high-resolution intra-bar data. As a result, the
values on the **current, unclosed bar** (the real-time bar) will
update dynamically as new intra-bar data arrives. This behavior is
normal and necessary for this type of analysis. Signals should only
be considered final **after the main chart bar has closed.**
---
**DISCLAIMER**
1. **For Informational/Educational Use Only:** This indicator is
provided for informational and educational purposes only. It does
not constitute financial, investment, or trading advice, nor is
it a recommendation to buy or sell any asset.
2. **Use at Your Own Risk:** All trading decisions you make based on
the information or signals generated by this indicator are made
solely at your own risk.
3. **No Guarantee of Performance:** Past performance is not an
indicator of future results. The author makes no guarantee
regarding the accuracy of the signals or future profitability.
4. **No Liability:** The author shall not be held liable for any
financial losses or damages incurred directly or indirectly from
the use of this indicator.
5. **Signals Are Not Recommendations:** The alerts and visual signals
(e.g., crossovers) generated by this tool are not direct
recommendations to buy or sell. They are technical observations
for your own analysis and consideration.

1m EMA Scalper + Lot Size HUD [DIMS]1m EMA Scalper w/ Pre-Alert + Lot Size HUD
Purpose:
A short-term (1-minute) scalping strategy for assets like XAUUSD, GBPJPY, and GER30/GER40, showing precise buy/sell signals, stop-loss, take-profit, breakeven levels, and a dynamic lot size HUD for risk management.
Key Features:
Signals:
Buy/Sell signals generated using EMA crossover (fast vs slow) + RSI filter + optional candle/volume filter.
Signals only appear during selected trading sessions (London & NY).
Pre-alert signals appear 30 seconds before the candle closes, so you can prepare to enter.
Stop Loss / Take Profit / Breakeven:
SL calculated using ATR × multiplier and adjustable for spread.
TP follows a configurable risk:reward ratio.
Breakeven can be toggled on/off and uses a custom multiplier.
Lines have customizable length, width, and style.
Lot Size HUD:
Automatically calculates lot size based on account balance, risk % or fixed amount, and leverage.
Shows stop distance in pips/points.
HUD retains the value for 5 minutes after the signal candle.
Flashes 30 seconds before the candle closes to prepare for the trade.
Auto-adjusts for XAUUSD, GBPJPY, GER30/GER40.
Alerts:
Alerts for pre-alert signals and confirmed signals.
Can toggle alerts on/off for both types.
Customization & Display:
Toggle buy/sell signals, SL/TP/BE lines, and pre-alert arrows.
Works entirely on-chart, displaying only the essential arrows, lines, and HUD.
Summary:
It’s a ready-to-trade scalping tool that combines fast technical signal detection with risk management, pre-alert timing, and visual trade guidance — letting you focus on execution without manually calculating lot size or monitoring every candle.

12 Band Volume matched Candles📌 12 Band Volume matched Candles (Official Description)
12 Band Volume matched Candles is a next-generation volume-strength visualisation tool designed for traders who rely on precision, speed, and clarity.
Instead of colouring candles by price action or relative indicators, this script maps every candle to one of 12 absolute-volume strength bands, using real contract/share volume thresholds that you define.
No guessing.
No subjective smoothing.
No repainting.
Just pure, clean, calibrated volume pressure — visualised instantly.
🔥 Why This Indicator Exists
Traditional volume colouring is vague, delayed, or tied to assumptions (like moving averages).
Scalpers, orderflow watchers, and tape-readers all know the truth:
👉 The raw size of volume matters more than relative volume.
This tool removes all ambiguity and lets you define exact thresholds that match the behaviour of your market:
5k volume
10k volume
20k
35k
50k
70k
… all the way to
200k+ (or whatever instrument volume you want)
Those thresholds map to a 12-band spectrum, ranging from the coldest low-volume purples to the hottest high-volume reds.
The result?
A visual system that lets you read volume pressure instantly, the same way our RSI 12-band spectrum lets you read momentum immediately.
🎨 Premium 12-Band Colour Spectrum
This indicator uses the same refined colour spectrum as the In The Zone RSI – 12 Band script:
Weak Volume (Bands 1–6) – Cold Side
Ultra-dark violet
Deep purples
Cool blues
Light icy blue
Strong Volume (Bands 7–12) – Hot Side
Warm yellows
Oranges
Orange-reds
Deep maroons
Ultra-dark red for max volume
You instantly know:
When volume is dying
When volume is building
When a trend is being pushed
When a breakout has REAL participation
When a reversal is weak or strong
Your brain doesn’t need to “interpret” numbers — just read the colours.
⚙️ Key Features
✔ 12 Custom Volume Thresholds
Set exact volume values that match your instrument.
A perfect companion for multi-indicator visual alignment.
✔ Borders-Only Mode
Keep your chart clean and still read volume strength.
✔ Adjustable Brightness & Opacity
Fine-tune the aesthetic for dark or light chart themes.
✔ Legend Placement Options
Display the volume band legend in any corner of the chart.
✔ Zero Lag – Zero Repaint
Everything is based on historical volume — no tricks.
🚀 Who It’s For
This tool is extremely powerful for:
Scalpers
Momentum traders
Orderflow readers
Breakout traders
Reversal hunters
Algo / quant-style chart readers
Anyone who trades with candle-flow awareness
If you rely on the “feel” of a chart, volume rhythm, or momentum pressure — this indicator becomes a cheat-code.
🎯 Practical Uses
Spot when large players enter a move
Filter weak vs strong pullbacks
Confirm breakout candles
See exhaustion before reversals
Separate noise from real interest
Pair with IZ RSI + price structure for elite scalp precision
⭐ Why Traders Love It
Because it's clear.
Instant.
And it treats volume as the truth, not something to smooth or average.
This is how scalpers and tape-readers naturally think — now in a visual form.
🔥 Final Line
12 Band Volume matched Candles turns raw volume into a crystal-clear language.
Once you see volume this way, you will never go back to traditional colouring again.

High Volume Zones with Signals – HVZ█ OVERVIEW
"High Volume Zones with Signals – HVZ" is a technical analysis indicator that identifies High Volume Zones (HVZ) on the chart and draws them as fully customizable boxes. Perfect for traders using price action, ICT, and Smart Money Concepts. The indicator highlights key volume-based support/resistance levels, detects potential consolidation zones (very large candles), and generates precise breakout and exit signals. Flexible volume filters, ATR filter, and visual styling options ensure a clean and highly effective chart.
█ CONCEPTS
The indicator detects candles with volume significantly above the average (default ≥ 2× SMA of volume over 20 periods). Such candles often signal institutional activity and create strong supply/demand zones.
The ATR filter additionally identifies very large candles – frequently a sign of market capitulation (panic buying/selling). Within the range of such a candle, prolonged consolidation often occurs, especially on higher timeframes (e.g., 4H and above).
Why are HVZ important? High-volume zones are areas where the market has left a large number of orders – institutions return there to “refresh” liquidity before the next move. A breakout against the zone’s character triggers a Break signal:
- Bullish HVZ broken downward (close below the lower boundary) → Break Down (sell),
- Bearish HVZ broken upward (close above the upper boundary) → Break Up (buy).
Note: The indicator requires real exchange volume – it will not work correctly on instruments without reported volume (e.g., certain CFDs or forex).
█ FEATURES
- HVZ Detection: Automatic identification of high-volume zones with Volume SMA Length and Volume Multiplier filters; historical initialization up to 500 candles back.
- ATR Filter: Optional detection of very large candles (potential consolidation/capitulation) using - ATR Length and ATR Multiplier; three action modes:
Skip Zone – large candle creates no zone,
Separate Color – zone is drawn in a distinct style (gray by default),
Normal Zone – treated like a regular HVZ.
- Gray zones (large candles, Separate Color): generate exactly the same Break signals as regular zones – based solely on the original candle direction (bullish → Break Down on lower break, bearish → Break Up on upper break). Gray color is only a visual marker for potential consolidation/capitulation zones.
- Customizable Boxes: Separate styles for bullish and bearish zones (border color, background gradient, line thickness and style); adjustable background and 50 % midline transparency.
- Break & Exit Signals:
Break Up/Down – green/red triangle after a candle closes outside the zone (zone disappears, triangle remains as a trace).
Exit Up/Down – green/red circle when price leaves the zone without a full breakout.
Signal Type option: Break, Exit, or Both.
- Midline: Automatic dashed line at the 50 % zone level with independent transparency control.
- Chart Cleanup: Automatic removal of inactive zones older than 500 candles (max_boxes_count=500).
- Alerts: Built-in alerts for Break Up and Break Down with clear messages.
█ HOW TO USE
Add to Chart: Paste the script in Pine Editor or find it in TradingView’s indicator library.
Configure Settings:
- Volume Filter: Volume SMA Length (default 20) and Volume Multiplier (default 2.0) – higher multiplier = fewer but stronger zones.
- ATR Filter: Enable/disable, set ATR Length (14) and ATR Multiplier (3.5); choose action for very large candles (Skip Zone / Separate Color / Normal Zone).
- Box Style: Background transparency (90) and midline transparency (70).
- Bull/Bear Box Style: Border and gradient colors, line thickness (1-5).
- ATR Style: Separate colors for large-candle zones (gray by default).
- Signal Settings: Choose Signal Type (Break/Exit/Both) and signal colors.
Signal Interpretation:
- Break Up (green triangle below bar): Bearish HVZ broken upward → buy signal, continuation of uptrend.
- Break Down (red triangle above bar): Bullish HVZ broken downward → sell signal, continuation of downtrend.
- Exit Up/Down (circles): Price leaves zone without breakout – may signal end of correction or reversal setup.
- HVZ Zones: Price often returns to high-volume zones to clear orders. An unfilled zone remains a price magnet.
- 50 % Level (midline): Ideal target for partial take-profit or reaction point inside the zone.
Combine signals with other tools (e.g., RSI, MACD, higher timeframes) for higher confidence.
█ APPLICATIONS
- Price Action & ICT: HVZ act as dynamic S/R; in an uptrend look for buys after breaking a bearish HVZ, in a downtrend look for sells after breaking a bullish HVZ. If you trade retests instead of breakouts, increase Volume Multiplier to 2.5-3.0 – fewer zones but much stronger. Note that after breaking a very strong zone, price often pulls back deeply before continuing.
- Breakout Strategies: For maximum Break signals, lower Volume Multiplier to 1.5-1.8 – gives many high-quality entries in trending markets. Always trade in the direction of the prevailing trend (e.g., only longs in uptrends). Enter after a Break signal with confirmation from volume or momentum (MACD above zero, RSI >50 for longs, <50 for shorts).
█ NOTES
- The indicator requires real exchange volume – it will not function properly on instruments without reported volume (e.g., certain CFDs, forex).
- Always confirm signals with additional context (market structure, higher timeframe).

Directional Climactic VolumeCreated so that you can add this indicator to your panel and when there is an unusual volume spike on a coin, it will alert you.

QED All-In-One(COM)-The yellow diamond and blue star are strong "Long" signals when the LF indicator's pink line crosses below 10.
-The pink star and yellow star are strong "short" signals when the LF indicator(NOT STUPID RSI) is above 90.
-The oversold (exclamation mark) signal indicates that a strong upward or downward trend could be imminent.
SUBSCRIPTION IS NEEDEED.
----------------------------------------------------------------------------------------------------------------
when pink line hits the bottom (close to 0). go for long. same as the short (opposite way)
DO NOT ENTER WHEN PINK LINE IS IN THE MIDDLE (close to YELLOW LINE). That's not the bottom or top you are looking for.
imgur.com
**************************
-노란색 다이아몬드와 파란색 별은 "Long" 시그널로 LF지표 핑크색 라인이 하단 10을 통과할때 강력합니다.
-핑크색과 노란색 별은 "short"시그널로 LF지표가 90이상일때 강력합니다.
-과매도(느낌표) 시그널은 곧 상승/하락의 추세가 될 수 있음을 의미합니다.

NQ Gamma LevelsNQ Gamma Levels - Dynamic Options Flow Visualization
This indicator displays gamma exposure levels from QQQ options data, automatically scaled to NQ/MNQ futures prices. Simply copy gamma data from your dashboard and paste it into the indicator to see key support and resistance levels based on dealer positioning.
Features:
- Automatic QQQ to NQ price conversion using live 1-minute ratios
- Visual strength indicators - thicker/longer lines show stronger gamma concentrations
- Customizable colors for positive and negative gamma levels
- Dotted reference lines extending across the chart for easy price tracking
- Updates every minute to prevent chart clutter and jumping levels
- Filters to show only significant levels above your threshold
- Strongest positive and negative levels are automatically highlighted
The solid colored lines represent gamma strength - longer lines indicate higher concentration at that price level. Dotted lines provide continuous reference points across your chart. Green levels typically act as support (dealers long gamma), while red levels often act as resistance (dealers short gamma).
Best used on 1-5 minute timeframes for intraday trading. Paste fresh data from your options flow dashboard whenever you want updated levels.

Trading Range Aggression Histogram
This indicator is a histogram that accumulates the net volume of aggressive buying and selling per candle, representing the dominant market pressure within defined time-frame.
The indicator works by continuously summing volumes as long as the aggression remains in the same direction, resetting and reversing the accumulation when the pressure changes sides.
This creates visual waves that facilitate the perception of phases dominated by buyers and sellers over time. The tool is useful to identify moments of strength, weakness, and potential reversals in a dynamic market, especially in short-term trading.

Screener (SSA) [AlgoAlpha]🟠 OVERVIEW
This script is a multi-symbol screener that serves as a dashboard companion to the "Smart Signals Assistant (SSA)" indicator. Its purpose is to monitor the entire suite of SSA components—from the core signals to all confluence tools—across a customizable watchlist of up to 18 assets. By displaying the real-time status of each indicator in a single table, it allows traders to get a bird's-eye view of the market, quickly identify assets with strong trend confluence, and filter for high-probability setups without needing to switch charts.
The screener is designed to mirror the modularity of the main SSA indicator, allowing you to enable or disable components in the table to match your preferred trading dashboard.
🟠 CONCEPTS
The screener is built directly on the analytical framework of the Smart Signals Assistant, applying its complex, proprietary algorithms to each symbol in your watchlist and summarizing the results. The combination of these different analytical concepts is what gives the screener its utility, as it helps traders find opportunities where multiple, distinct strategies align.
Each column in the table represents a core trading concept:
Smart Signals: This is the primary signal engine, designed to identify potential entry points. It operates in different modes to capture both long-term swings and faster scalping opportunities.
Fair Value Trail (FVT): This component provides a dynamic, volatility-adjusted baseline for the trend. It acts as a form of dynamic support or resistance, helping to confirm the validity of a trend shown by the Smart Signals.
Trend Spine: This tool is designed to identify the underlying "backbone" of the market's trend. It filters out short-term price noise to provide a more stable, clear indication of the dominant market direction.
Trend Bias: This measures the strength and conviction behind a trend. It helps distinguish between a strong, accelerating move and a weak, decelerating one, adding a layer of momentum analysis.
Firmament Clouds: These are volatility-based bands that create dynamic overbought and oversold zones. They help identify when price is potentially overextended and due for a pullback or consolidation.
Trend-Range Classifier (TRC): A machine-learning model that analyzes market characteristics to classify the current environment as either "Trending" or "Ranging." This is crucial for helping traders apply the right strategy for the current conditions.
🟠 FEATURES
This screener organizes the complex data from the SSA indicator into a simple, color-coded table. Here is a breakdown of each column and its possible values:
Asset: Displays the ticker symbol for the asset being analyzed.
Smart Signals: Shows the latest signal from the core engine.
▲: A standard bullish signal has been detected.
▼: A standard bearish signal has been detected.
▲+: A strong bullish signal with higher conviction has been detected.
▼+: A strong bearish signal with higher conviction has been detected.
Fair Value Trail: Indicates the trend direction based on the volatility trail.
▲: The FVT is in a bullish trend (acting as dynamic support).
▼: The FVT is in a bearish trend (acting as dynamic resistance).
Trend Spine: Shows the direction of the core underlying trend.
▲: The underlying trend backbone is bullish.
▼: The underlying trend backbone is bearish.
Trend Bias: Measures the current momentum strength.
Strong▲: Strong and accelerating bullish momentum.
Weak▲: Bullish momentum exists but is weakening.
Strong▼: Strong and accelerating bearish momentum.
Weak▼: Bearish momentum exists but is weakening.
Firmament Clouds: Identifies overbought/oversold conditions relative to volatility.
Very Overbought / Overbought: Price is significantly extended above its recent range.
Very Oversold / Oversold: Price is significantly extended below its recent range.
Neutral: Price is trading within its normal volatility range.
Trend-Range Classifier: Displays the market state as determined by the ML model.
Trend: The market is in a trending environment, suitable for trend-following strategies.
Range: The market is in a ranging or consolidating environment, suitable for mean-reversion strategies.
Exit Signal Count: Tracks the number of take-profit signals that have occurred since the last primary Smart Signal.
0, 1, 2, 3...: A numerical count of exit signals. A higher number suggests a trend may be maturing or exhausting.
🟠 USAGE
The main purpose of the screener is to quickly identify assets where multiple components of the SSA system are in alignment, indicating a high-confluence trading opportunity.
1. Setup and Configuration:
Add the screener to your chart.
Go into the settings and populate the "Watchlist" group with the symbols you wish to monitor.
Ensure the settings for the components (Time Horizon, Signal Mode, etc.) are synchronized with the settings on your main SSA indicator for consistency.
2. Interpreting the Columns for Trading Decisions:
Start with the Big Picture (TRC): First, look at the "Trend-Range Classifier" column. If it shows "Trend," you should be looking for trend-following setups. If it shows "Range," you might avoid taking strong trend signals.
Establish Directional Bias (Spine & Bias): For trend-following, look for assets where the "Trend Spine" and "Trend Bias" agree. A "▲" in the Spine column combined with a "Strong▲" in the Bias column indicates a healthy and robust uptrend.
Time Your Entry (Smart Signals): Once you have an asset with a clear bias, watch the "Smart Signals" column for a fresh signal that aligns with that bias. A "▲+" signal appearing in an asset with a strong bullish bias across other columns is a high-confluence entry point.
Add Context (FVT & Clouds): Use the "Fair Value Trail" and "Firmament Clouds" to refine your entry. A buy signal is generally stronger if the FVT is also bullish ("▲") and the price is not in a "Very Overbought" state according to the clouds.
Manage the Trade (Exit Count): After entering a trade, keep an eye on the "Exit Signal Count." As the number increases, it serves as a warning that the trend is becoming extended and it might be time to take partial profits or tighten your stop-loss.
Script pago

Screener (MC) [AlgoAlpha]🟠 OVERVIEW
This script is a multi-symbol scanner that works as a companion to the "Momentum Concepts" indicator. It provides a comprehensive dashboard view, allowing traders to monitor the momentum signals of up to 18 different assets in real-time from a single chart. The main purpose is to offer a bird's-eye view of the market, helping you quickly identify assets with strong momentum confluence or potential reversal opportunities without having to switch between different charts.
The screener displays the status of all key components from the Momentum Concepts indicator, including the Fast Oscillator, Scalper's Momentum, Momentum Impulse Oscillator, and Hidden Liquidity Flow, organizing them into a clear and easy-to-read table.
🟠 CONCEPTS
The core of this screener is built upon the analytical framework of the "Momentum Concepts" indicator, which evaluates market momentum across multiple layers: short-term, medium-term, and long-term. This screener applies those complex, proprietary calculations to each symbol in your watchlist and visualizes the current state of each component.
Each column in the table represents a specific aspect of momentum analysis:
Fast Oscillator Columns: These columns reflect the short-term momentum. They show the immediate trend direction, whether the asset is in an overbought or oversold condition, and flag high-probability events like divergences, reversals, or diminishing momentum.
Scalper's Momentum Column: This column gives insight into medium-term momentum. It distinguishes between strong, sustained moves and weakening, corrective moves, which is useful for gauging the health of a trend.
Momentum Impulse Column: This column represents the dominant, long-term trend bias. It helps you understand the underlying market regime (bullish, bearish, or consolidating) to align your trades with the bigger picture.
Hidden Liquidity Flow Column: This column provides a unique view into the market's underlying liquidity dynamics. It signals whether there is net buying or selling pressure and uses special coloring to highlight periods of unusually high liquidity activity, which often precedes volatile price movements.
By combining these perspectives, the screener justifies its utility by enabling traders to make more informed decisions based on multi-layered signal confluence.
🟠 FEATURES
This screener organizes momentum data into several key columns. Here is a breakdown of each column and its possible values:
Asset: Displays the symbol for the asset being analyzed in that row.
Fast Oscillator Trend: Shows the immediate, short-term momentum direction.
▲: Indicates a bullish short-term trend.
▼: Indicates a bearish short-term trend.
–: Indicates a neutral or transitional state.
Fast Oscillator Valuation: Measures whether the asset is in a short-term overbought or oversold state.
OB: Signals an "Overbought" condition, often associated with bullish exhaustion.
OS: Signals an "Oversold" condition, often associated with bearish exhaustion.
Neutral: The asset is trading in a neutral zone, neither overbought nor oversold.
Scalper's Momentum: Assesses the strength and direction of medium-term momentum.
Strong▲: Strong bullish momentum.
Weak▲: Bullish momentum exists but is weakening or corrective.
Strong▼: Strong bearish momentum.
Weak▼: Bearish momentum exists but is weakening or corrective.
–: Neutral or no clear medium-term momentum.
Momentum Impulse: Identifies the dominant, long-term trend bias. A colored background indicates that the momentum is in a strong "impulse" phase.
▲: Indicates a bullish long-term bias.
▼: Indicates a bearish long-term bias.
0: Indicates a neutral or ranging market condition.
Hidden Liquidity Flow: Tracks underlying buying and selling pressure. The background color highlights periods of unusual liquidity activity.
▲: Positive liquidity flow, suggesting net buying pressure.
▼: Negative liquidity flow, suggesting net selling pressure.
–: Neutral liquidity flow.
Dim. Momentum: Provides an early warning that short-term momentum is beginning to fade.
● (Bullish Color): Bullish momentum is weakening.
● (Bearish Color): Bearish momentum is weakening.
–: No diminishing momentum detected.
Divergence: Flags classic or hidden divergences between price and the Fast Oscillator.
Div▲: A bullish divergence has been detected.
Div▼: A bearish divergence has been detected.
–: No active divergence signal.
Reversal: Signals a potential reversal when the Fast Oscillator crosses its trend line from an overbought or oversold zone.
Rev▲: A bullish reversal signal has occurred.
Rev▼: A bearish reversal signal has occurred.
–: No active reversal signal.
🟠 USAGE
The primary function of this screener is to quickly identify trading opportunities and filter setups based on momentum confluence across your watchlist.
1. Setup and Configuration:
Add the indicator to your chart.
Go into the script settings and populate the "Watchlist" group with the symbols you wish to monitor.
Adjust the settings for the various momentum components (Fast Oscillator, Scalper's Momentum, etc.) to align with your trading strategy. These settings will be universally applied to all symbols in the screener.
2. Interpreting the Columns for Trading Decisions:
Momentum Impulse & Hidden Liquidity Flow: Use these columns to establish a directional bias. A bullish "▲" in both columns on an asset suggests a strong underlying uptrend with supportive buying pressure, making it a good candidate for long positions.
Scalper's Momentum: Use this for entry timing and trend health. A "Strong▲" reading can confirm the strength of an uptrend, while a shift to "Weak▲" might suggest it's time to tighten stops or look for an exit.
Fast Oscillator Trend & Valuation: These are best for precise entry triggers. For a "buy the dip" strategy in an uptrend, you could wait for the Fast Oscillator to show "OS" (Oversold) and then enter when the "Trend" column flips back to "▲".
Dim. Momentum: This is an excellent take-profit signal. If you are in a long position and a bullish-colored "●" appears, it's a warning that the upward move is losing steam, and you might consider closing your trade.
Divergence & Reversal: These columns are for identifying potential turning points. A "Div▲" or "Rev▲" signal is a strong alert that a downtrend might be ending, making the asset a prime candidate to watch for a long entry.
3. Finding High-Probability Setups:
Trend Confluence: Look for assets where multiple components show alignment. For example, an ideal long setup might show a bullish "Momentum Impulse" (▲), a "Strong▲" reading in "Scalper's Momentum," and a bullish trend in the "Fast Oscillator." This indicates that the long-term, medium-term, and short-term momentums are all in agreement.
Reversal and Exhaustion: Use the "Divergence" and "Reversal" columns to spot potential turning points. A "Div▲" signal appearing in an asset that is in an oversold "Fast Oscillator Valuation" zone can be a strong indication of an upcoming bounce.
Script pago

Algorithm Predator - ML-liteAlgorithm Predator - ML-lite
This indicator combines four specialized trading agents with an adaptive multi-armed bandit selection system to identify high-probability trade setups. It is designed for swing and intraday traders who want systematic signal generation based on institutional order flow patterns , momentum exhaustion , liquidity dynamics , and statistical mean reversion .
Core Architecture
Why These Components Are Combined:
The script addresses a fundamental challenge in algorithmic trading: no single detection method works consistently across all market conditions. By deploying four independent agents and using reinforcement learning algorithms to select or blend their outputs, the system adapts to changing market regimes without manual intervention.
The Four Trading Agents
1. Spoofing Detector Agent 🎭
Detects iceberg orders through persistent volume at similar price levels over 5 bars
Identifies spoofing patterns via asymmetric wick analysis (wicks exceeding 60% of bar range with volume >1.8× average)
Monitors order clustering using simplified Hawkes process intensity tracking (exponential decay model)
Signal Logic: Contrarian—fades false breakouts caused by institutional manipulation
Best Markets: Consolidations, institutional trading windows, low-liquidity hours
2. Exhaustion Detector Agent ⚡
Calculates RSI divergence between price movement and momentum indicator over 5-bar window
Detects VWAP exhaustion (price at 2σ bands with declining volume)
Uses VPIN reversals (volume-based toxic flow dissipation) to identify momentum failure
Signal Logic: Counter-trend—enters when momentum extreme shows weakness
Best Markets: Trending markets reaching climax points, over-extended moves
3. Liquidity Void Detector Agent 💧
Measures Bollinger Band squeeze (width <60% of 50-period average)
Identifies stop hunts via 20-bar high/low penetration with immediate reversal and volume spike
Detects hidden liquidity absorption (volume >2× average with range <0.3× ATR)
Signal Logic: Breakout anticipation—enters after liquidity grab but before main move
Best Markets: Range-bound pre-breakout, volatility compression zones
4. Mean Reversion Agent 📊
Calculates price z-scores relative to 50-period SMA and standard deviation (triggers at ±2σ)
Implements Ornstein-Uhlenbeck process scoring (mean-reverting stochastic model)
Uses entropy analysis to detect algorithmic trading patterns (low entropy <0.25 = high predictability)
Signal Logic: Statistical reversion—enters when price deviates significantly from statistical equilibrium
Best Markets: Range-bound, low-volatility, algorithmically-dominated instruments
Adaptive Selection: Multi-Armed Bandit System
The script implements four reinforcement learning algorithms to dynamically select or blend agents based on performance:
Thompson Sampling (Default - Recommended):
Uses Bayesian inference with beta distributions (tracks alpha/beta parameters per agent)
Balances exploration (trying underused agents) vs. exploitation (using proven winners)
Each agent's win/loss history informs its selection probability
Lite Approximation: Uses pseudo-random sampling from price/volume noise instead of true random number generation
UCB1 (Upper Confidence Bound):
Calculates confidence intervals using: average_reward + sqrt(2 × ln(total_pulls) / agent_pulls)
Deterministic algorithm favoring agents with high uncertainty (potential upside)
More conservative than Thompson Sampling
Epsilon-Greedy:
Exploits best-performing agent (1-ε)% of the time
Explores randomly ε% of the time (default 10%, configurable 1-50%)
Simple, transparent, easily tuned via epsilon parameter
Gradient Bandit:
Uses softmax probability distribution over agent preference weights
Updates weights via gradient ascent based on rewards
Best for Blend mode where all agents contribute
Selection Modes:
Switch Mode: Uses only the selected agent's signal (clean, decisive)
Blend Mode: Combines all agents using exponentially weighted confidence scores controlled by temperature parameter (smooth, diversified)
Lock Agent Feature:
Optional manual override to force one specific agent
Useful after identifying which agent dominates your specific instrument
Only applies in Switch mode
Four choices: Spoofing Detector, Exhaustion Detector, Liquidity Void, Mean Reversion
Memory System
Dual-Layer Architecture:
Short-Term Memory: Stores last 20 trade outcomes per agent (configurable 10-50)
Long-Term Memory: Stores episode averages when short-term reaches transfer threshold (configurable 5-20 bars)
Memory Boost Mechanism: Recent performance modulates agent scores by up to ±20%
Episode Transfer: When an agent accumulates sufficient results, averages are condensed into long-term storage
Persistence: Manual restoration of learned parameters via input fields (alpha, beta, weights, microstructure thresholds)
How Memory Works:
Agent generates signal → outcome tracked after 8 bars (performance horizon)
Result stored in short-term memory (win = 1.0, loss = 0.0)
Short-term average influences agent's future scores (positive feedback loop)
After threshold met (default 10 results), episode averaged into long-term storage
Long-term patterns (weighted 30%) + short-term patterns (weighted 70%) = total memory boost
Market Microstructure Analysis
These advanced metrics quantify institutional order flow dynamics:
Order Flow Toxicity (Simplified VPIN):
Measures buy/sell volume imbalance over 20 bars: |buy_vol - sell_vol| / (buy_vol + sell_vol)
Detects informed trading activity (institutional players with non-public information)
Values >0.4 indicate "toxic flow" (informed traders active)
Lite Approximation: Uses simple open/close heuristic instead of tick-by-tick trade classification
Price Impact Analysis (Simplified Kyle's Lambda):
Measures market impact efficiency: |price_change_10| / sqrt(volume_sum_10)
Low values = large orders with minimal price impact ( stealth accumulation )
High values = retail-dominated moves with high slippage
Lite Approximation: Uses simplified denominator instead of regression-based signed order flow
Market Randomness (Entropy Analysis):
Counts unique price changes over 20 bars / 20
Measures market predictability
High entropy (>0.6) = human-driven, chaotic price action
Low entropy (<0.25) = algorithmic trading dominance (predictable patterns)
Lite Approximation: Simple ratio instead of true Shannon entropy H(X) = -Σ p(x)·log₂(p(x))
Order Clustering (Simplified Hawkes Process):
Tracks self-exciting event intensity (coordinated order activity)
Decays at 0.9× per bar, spikes +1.0 when volume >1.5× average
High intensity (>0.7) indicates clustering (potential spoofing/accumulation)
Lite Approximation: Simple exponential decay instead of full λ(t) = μ + Σ α·exp(-β(t-tᵢ)) with MLE
Signal Generation Process
Multi-Stage Validation:
Stage 1: Agent Scoring
Each agent calculates internal score based on its detection criteria
Scores must exceed agent-specific threshold (adjusted by sensitivity multiplier)
Agent outputs: Signal direction (+1/-1/0) and Confidence level (0.0-1.0)
Stage 2: Memory Boost
Agent scores multiplied by memory boost factor (0.8-1.2 based on recent performance)
Successful agents get amplified, failing agents get dampened
Stage 3: Bandit Selection/Blending
If Adaptive Mode ON:
Switch: Bandit selects single best agent, uses only its signal
Blend: All agents combined using softmax-weighted confidence scores
If Adaptive Mode OFF:
Traditional consensus voting with confidence-squared weighting
Signal fires when consensus exceeds threshold (default 70%)
Stage 4: Confirmation Filter
Raw signal must repeat for consecutive bars (default 3, configurable 2-4)
Minimum confidence threshold: 0.25 (25%) enforced regardless of mode
Trend alignment check: Long signals require trend_score ≥ -2, Short signals require trend_score ≤ 2
Stage 5: Cooldown Enforcement
Minimum bars between signals (default 10, configurable 5-15)
Prevents over-trading during choppy conditions
Stage 6: Performance Tracking
After 8 bars (performance horizon), signal outcome evaluated
Win = price moved in signal direction, Loss = price moved against
Results fed back into memory and bandit statistics
Trading Modes (Presets)
Pre-configured parameter sets:
Conservative: 85% consensus, 4 confirmations, 15-bar cooldown
Expected: 60-70% win rate, 3-8 signals/week
Best for: Swing trading, capital preservation, beginners
Balanced: 70% consensus, 3 confirmations, 10-bar cooldown
Expected: 55-65% win rate, 8-15 signals/week
Best for: Day trading, most traders, general use
Aggressive: 60% consensus, 2 confirmations, 5-bar cooldown
Expected: 50-58% win rate, 15-30 signals/week
Best for: Scalping, high-frequency trading, active management
Elite: 75% consensus, 3 confirmations, 12-bar cooldown
Expected: 58-68% win rate, 5-12 signals/week
Best for: Selective trading, high-conviction setups
Adaptive: 65% consensus, 2 confirmations, 8-bar cooldown
Expected: Varies based on learning
Best for: Experienced users leveraging bandit system
How to Use
1. Initial Setup (5 Minutes):
Select Trading Mode matching your style (start with Balanced)
Enable Adaptive Learning (recommended for automatic agent selection)
Choose Thompson Sampling algorithm (best all-around performance)
Keep Microstructure Metrics enabled for liquid instruments (>100k daily volume)
2. Agent Tuning (Optional):
Adjust Agent Sensitivity multipliers (0.5-2.0):
<0.8 = Highly selective (fewer signals, higher quality)
0.9-1.2 = Balanced (recommended starting point)
1.3 = Aggressive (more signals, lower individual quality)
Monitor dashboard for 20-30 signals to identify dominant agent
If one agent consistently outperforms, consider using Lock Agent feature
3. Bandit Configuration (Advanced):
Blend Temperature (0.1-2.0):
0.3 = Sharp decisions (best agent dominates)
0.5 = Balanced (default)
1.0+ = Smooth (equal weighting, democratic)
Memory Decay (0.8-0.99):
0.90 = Fast adaptation (volatile markets)
0.95 = Balanced (most instruments)
0.97+ = Long memory (stable trends)
4. Signal Interpretation:
Green triangle (▲): Long signal confirmed
Red triangle (▼): Short signal confirmed
Dashboard shows:
Active agent (highlighted row with ► marker)
Win rate per agent (green >60%, yellow 40-60%, red <40%)
Confidence bars (█████ = maximum confidence)
Memory size (short-term buffer count)
Colored zones display:
Entry level (current close)
Stop-loss (1.5× ATR)
Take-profit 1 (2.0× ATR)
Take-profit 2 (3.5× ATR)
5. Risk Management:
Never risk >1-2% per signal (use ATR-based stops)
Signals are entry triggers, not complete strategies
Combine with your own market context analysis
Consider fundamental catalysts and news events
Use "Confirming" status to prepare entries (not to enter early)
6. Memory Persistence (Optional):
After 50-100 trades, check Memory Export Panel
Record displayed alpha/beta/weight values for each agent
Record VPIN and Kyle threshold values
Enable "Restore From Memory" and input saved values to continue learning
Useful when switching timeframes or restarting indicator
Visual Components
On-Chart Elements:
Spectral Layers: EMA8 ± 0.5 ATR bands (dynamic support/resistance, colored by trend)
Energy Radiance: Multi-layer glow boxes at signal points (intensity scales with confidence, configurable 1-5 layers)
Probability Cones: Projected price paths with uncertainty wedges (15-bar projection, width = confidence × ATR)
Connection Lines: Links sequential signals (solid = same direction continuation, dotted = reversal)
Kill Zones: Risk/reward boxes showing entry, stop-loss, and dual take-profit targets
Signal Markers: Triangle up/down at validated entry points
Dashboard (Configurable Position & Size):
Regime Indicator: 4-level trend classification (Strong Bull/Bear, Weak Bull/Bear)
Mode Status: Shows active system (Adaptive Blend, Locked Agent, or Consensus)
Agent Performance Table: Real-time win%, confidence, and memory stats
Order Flow Metrics: Toxicity and impact indicators (when microstructure enabled)
Signal Status: Current state (Long/Short/Confirming/Waiting) with confirmation progress
Memory Panel (Configurable Position & Size):
Live Parameter Export: Alpha, beta, and weight values per agent
Adaptive Thresholds: Current VPIN sensitivity and Kyle threshold
Save Reminder: Visual indicator if parameters should be recorded
What Makes This Original
This script's originality lies in three key innovations:
1. Genuine Meta-Learning Framework:
Unlike traditional indicator mashups that simply display multiple signals, this implements authentic reinforcement learning (multi-armed bandits) to learn which detection method works best in current conditions. The Thompson Sampling implementation with beta distribution tracking (alpha for successes, beta for failures) is statistically rigorous and adapts continuously. This is not post-hoc optimization—it's real-time learning.
2. Episodic Memory Architecture with Transfer Learning:
The dual-layer memory system mimics human learning patterns:
Short-term memory captures recent performance (recency bias)
Long-term memory preserves historical patterns (experience)
Automatic transfer mechanism consolidates knowledge
Memory boost creates positive feedback loops (successful strategies become stronger)
This architecture allows the system to adapt without retraining , unlike static ML models that require batch updates.
3. Institutional Microstructure Integration:
Combines retail-focused technical analysis (RSI, Bollinger Bands, VWAP) with institutional-grade microstructure metrics (VPIN, Kyle's Lambda, Hawkes processes) typically found in academic finance literature and professional trading systems, not standard retail platforms. While simplified for Pine Script constraints, these metrics provide insight into informed vs. uninformed trading , a dimension entirely absent from traditional technical analysis.
Mashup Justification:
The four agents are combined specifically for risk diversification across failure modes:
Spoofing Detector: Prevents false breakout losses from manipulation
Exhaustion Detector: Prevents chasing extended trends into reversals
Liquidity Void: Exploits volatility compression (different regime than trending)
Mean Reversion: Provides mathematical anchoring when patterns fail
The bandit system ensures the optimal tool is automatically selected for each market situation, rather than requiring manual interpretation of conflicting signals.
Why "ML-lite"? Simplifications and Approximations
This is the "lite" version due to necessary simplifications for Pine Script execution:
1. Simplified VPIN Calculation:
Academic Implementation: True VPIN uses volume bucketing (fixed-volume bars) and tick-by-tick buy/sell classification via Lee-Ready algorithm or exchange-provided trade direction flags
This Implementation: 20-bar rolling window with simple open/close heuristic (close > open = buy volume)
Impact: May misclassify volume during ranging/choppy markets; works best in directional moves
2. Pseudo-Random Sampling:
Academic Implementation: Thompson Sampling requires true random number generation from beta distributions using inverse transform sampling or acceptance-rejection methods
This Implementation: Deterministic pseudo-randomness derived from price and volume decimal digits: (close × 100 - floor(close × 100)) + (volume % 100) / 100
Impact: Not cryptographically random; may have subtle biases in specific price ranges; provides sufficient variation for agent selection
3. Hawkes Process Approximation:
Academic Implementation: Full Hawkes process uses maximum likelihood estimation with exponential kernels: λ(t) = μ + Σ α·exp(-β(t-tᵢ)) fitted via iterative optimization
This Implementation: Simple exponential decay (0.9 multiplier) with binary event triggers (volume spike = event)
Impact: Captures self-exciting property but lacks parameter optimization; fixed decay rate may not suit all instruments
4. Kyle's Lambda Simplification:
Academic Implementation: Estimated via regression of price impact on signed order flow over multiple time intervals: Δp = λ × Δv + ε
This Implementation: Simplified ratio: price_change / sqrt(volume_sum) without proper signed order flow or regression
Impact: Provides directional indicator of impact but not true market depth measurement; no statistical confidence intervals
5. Entropy Calculation:
Academic Implementation: True Shannon entropy requires probability distribution: H(X) = -Σ p(x)·log₂(p(x)) where p(x) is probability of each price change magnitude
This Implementation: Simple ratio of unique price changes to total observations (variety measure)
Impact: Measures diversity but not true information entropy with probability weighting; less sensitive to distribution shape
6. Memory System Constraints:
Full ML Implementation: Neural networks with backpropagation, experience replay buffers (storing state-action-reward tuples), gradient descent optimization, and eligibility traces
This Implementation: Fixed-size array queues with simple averaging; no gradient-based learning, no state representation beyond raw scores
Impact: Cannot learn complex non-linear patterns; limited to linear performance tracking
7. Limited Feature Engineering:
Advanced Implementation: Dozens of engineered features, polynomial interactions (x², x³), dimensionality reduction (PCA, autoencoders), feature selection algorithms
This Implementation: Raw agent scores and basic market metrics (RSI, ATR, volume ratio); minimal transformation
Impact: May miss subtle cross-feature interactions; relies on agent-level intelligence rather than feature combinations
8. Single-Instrument Data:
Full Implementation: Multi-asset correlation analysis (sector ETFs, currency pairs, volatility indices like VIX), lead-lag relationships, risk-on/risk-off regimes
This Implementation: Only OHLCV data from displayed instrument
Impact: Cannot incorporate broader market context; vulnerable to correlated moves across assets
9. Fixed Performance Horizon:
Full Implementation: Adaptive horizon based on trade duration, volatility regime, or profit target achievement
This Implementation: Fixed 8-bar evaluation window
Impact: May evaluate too early in slow markets or too late in fast markets; one-size-fits-all approach
Performance Impact Summary:
These simplifications make the script:
✅ Faster: Executes in milliseconds vs. seconds (or minutes) for full academic implementations
✅ More Accessible: Runs on any TradingView plan without external data feeds, APIs, or compute servers
✅ More Transparent: All calculations visible in Pine Script (no black-box compiled models)
✅ Lower Resource Usage: <500 bars lookback, minimal memory footprint
⚠️ Less Precise: Approximations may reduce statistical edge by 5-15% vs. academic implementations
⚠️ Limited Scope: Cannot capture tick-level dynamics, multi-order-book interactions, or cross-asset flows
⚠️ Fixed Parameters: Some thresholds hardcoded rather than dynamically optimized
When to Upgrade to Full Implementation:
Consider professional Python/C++ versions with institutional data feeds if:
Trading with >$100K capital where precision differences materially impact returns
Operating in microsecond-competitive environments (HFT, market making)
Requiring regulatory-grade audit trails and reproducibility
Backtesting with tick-level precision for strategy validation
Need true real-time adaptation with neural network-based learning
For retail swing/day trading and position management, these approximations provide sufficient signal quality while maintaining usability, transparency, and accessibility. The core logic—multi-agent detection with adaptive selection—remains intact.
Technical Notes
All calculations use standard Pine Script built-in functions ( ta.ema, ta.atr, ta.rsi, ta.bb, ta.sma, ta.stdev, ta.vwap )
VPIN and Kyle's Lambda use simplified formulas optimized for OHLCV data (see "Lite" section above)
Thompson Sampling uses pseudo-random noise from price/volume decimal digits for beta distribution sampling
No repainting: All calculations use confirmed bar data (no forward-looking)
Maximum lookback: 500 bars (set via max_bars_back parameter)
Performance evaluation: 8-bar forward-looking window for reward calculation (clearly disclosed)
Confidence threshold: Minimum 0.25 (25%) enforced on all signals
Memory arrays: Dynamic sizing with FIFO queue management
Limitations and Disclaimers
Not Predictive: This indicator identifies patterns in historical data. It cannot predict future price movements with certainty.
Requires Human Judgment: Signals are entry triggers, not complete trading strategies. Must be confirmed with your own analysis, risk management rules, and market context.
Learning Period Required: The adaptive system requires 50-100 bars minimum to build statistically meaningful performance data for bandit algorithms.
Overfitting Risk: Restoring memory parameters from one market regime to a drastically different regime (e.g., low volatility to high volatility) may cause poor initial performance until system re-adapts.
Approximation Limitations: Simplified calculations (see "Lite" section) may underperform academic implementations by 5-15% in highly efficient markets.
No Guarantee of Profit: Past performance, whether backtested or live-traded, does not guarantee future performance. All trading involves risk of loss.
Forward-Looking Bias: Performance evaluation uses 8-bar forward window—this creates slight look-ahead for learning (though not for signals). Real-time performance may differ from indicator's internal statistics.
Single-Instrument Limitation: Does not account for correlations with related assets or broader market regime changes.
Recommended Settings
Timeframe: 15-minute to 4-hour charts (sufficient volatility for ATR-based stops; adequate bar volume for learning)
Assets: Liquid instruments with >100k daily volume (forex majors, large-cap stocks, BTC/ETH, major indices)
Not Recommended: Illiquid small-caps, penny stocks, low-volume altcoins (microstructure metrics unreliable)
Complementary Tools: Volume profile, order book depth, market breadth indicators, fundamental catalysts
Position Sizing: Risk no more than 1-2% of capital per signal using ATR-based stop-loss
Signal Filtering: Consider external confluence (support/resistance, trendlines, round numbers, session opens)
Start With: Balanced mode, Thompson Sampling, Blend mode, default agent sensitivities (1.0)
After 30+ Signals: Review agent win rates, consider increasing sensitivity of top performers or locking to dominant agent
Alert Configuration
The script includes built-in alert conditions:
Long Signal: Fires when validated long entry confirmed
Short Signal: Fires when validated short entry confirmed
Alerts fire once per bar (after confirmation requirements met)
Set alert to "Once Per Bar Close" for reliability
Taking you to school. — Dskyz, Trade with insight. Trade with anticipation.

Consolidation Value Zones (Recio)Consolidation Value Zones introduces an original algorithm to identify consolidation ranges and locate areas of importance within them. This new method "looks" at the chart and draws zones based on price with the goal of producing actionable zones which appear natural, as if they were found through a human analysis.
> Consider the following...
The chart image above displays Bitcoin, at no specific date, for no specific reason. What I have done here is simply glanced at the chart for about 5 seconds, and circled a few areas which stood out as "obvious" consolidation. It does not take a savant to look at a chart and circle ranging price. However, what we have just done defies many common systems for identifying consolidation. We have located ranges of various zone lengths, as small as roughly 25 bars to as large as roughly 100 bars. Regardless of this, we still determined these zones with our eyes and brain in a few seconds, for some it's practically instant. The issue with us humans doing this, is that we are subjective. We did not really use any concrete rules to determine these areas with our eyes. So the problem becomes "How do we identify these zones in a way which seems natural to us with a repeatable system?" Because of this, my approach is simply a logical attempt to reverse engineer our human intuition.
> Consolidation Value Zones
The name of this indicator is generic. To dissect it, we are identifying consolidation ranges, then using a volume profile to determine the value zone within that range. The specific method used to identify these consolidation zones is something I've personally been referring to as the "skewer" method. Another name that may fit better is "Linear Range Alignment/Overlap".
Ultimately, the goal is to locate a single price level or range that overlaps many adjacent bars.
This should, in theory, return areas of visually obvious consolidation.
> The Skewer Method (Identification Method & Bar Gap Allowances)
One consistent concept across the different identification methods for determining consolidation is time. How long do we chop around before calling it consolidation? This is the "Identification Threshold". Once we have located a consolidation zone "this" wide, we will then consider it as consolidation.
In the chart image above, we are considering a six-bar consolidation formation. The figure on the left shows an example of a perfect raw bar overlap, we can see that the six bars all overlap at one price range. This is a perfect example of what we are looking to identify as consolidation. Unfortunately, if this was all we looked at, we would have a very scarce identification method.
For that reason, we have the example on the right, which shows the additional allowances for the identification of these ranges. At most, the example on the right shows a gapless three-bar overlap. However, if we allow the identification to bridge across the gaps, we are able to draw a zone directly through the center and still be within our parameters. This allowance is the "Bar Gap Allowance" and will determine the leniency of the identification.
Between our identification threshold and bar gap allowance, we can start to piece together how the script is "looking" at our chart.
> Detecting Consolidation (Live Detection)
To aid in transparency and user understanding, the live detection calculation can be seen on the chart as a box, skewering the recent historical bars with a number next to it, indicating the number of bars found as potential consolidation.
As we can see in the chart image above, the script, by default, is looking for a 15-bar consolidation, with a 5-bar gap allowance. In the image, the specific gap count is labeled, we can see the script scan backwards as far as it can before counting five gaps in the data. Once that occurs, the detection stops.
Notice how the zone found is a range, consisting of all price levels which meet the parameters. The lower level of the range only had two gaps, but the upper level reached five.
> Consolidation Range and Value Zones (Volume Profiles)
Once the script has identified the consolidation formation, it calculates a volume profile across the identified consolidation range. From this it calculates and draws the Point of Control (POC) and Value Area in addition to the full consolidation range.
Once we have our zones drawn, and understand what they identify, we can go one step further and apply concepts from volume profile trading.
Range High/Low: Displays the current extent of the identified consolidation.
Value High/Low: Shows the specific area within the consolidation where buyers and sellers found the most value.
POC: The single point, where the most volume was transacted during consolidation.
In a balanced market, we would anticipate price to rotate around POC, oscillating from Value High (VAH) to Value Low (VAL). In contrast, a market in motion moves directionally, building volume at new price levels as value, naturally the POC shifts with it.
> Zone Extensions
Unlike many other scripts, there is no mitigation logic at play here, since crossing a zone simply tells us "buyers and sellers are not currently active here", but it does not guarantee that value cannot return or react from previous areas of value.
Obviously the current zone will always be most relevant, but historical zones can retain relevance depending on the context of the market.
Remember: Each area of consolidation is an area where buyers and sellers were once facing off, resulting in price's consolidation. Amidst this, the value zone was the area of greatest agreement between the participants at that time. When moving outside of a range, we would typically look at historical value areas and price's interaction with them for further context.
Due to the ever changing market, there is no fixed extension lookback that will cover every scenario. By default, the Extension Lookback is "1", meaning the script will extend the most recent zone forward until a new zone is detected.
Note: For clarity, zone extensions are colored differently from core zones.
The following chart image shows a few examples of these unique interactions.
As seen in the chart image, looking to previous areas of value as well as POC can provide context in the form of acceptance or rejection at these levels, providing further insight into the auction for us to respond to.
The zones do contain logic to maintain a clean display. By default, the zones extend conditionally when price returns to the previous consolidation range. If desired, the zones can be extended regardless of price action; this can be toggled with the option "Regardless Extension Mode", as seen below.
> Hollow Candles & Zone Merging
When consolidation is identified, a hollow candle is drawn; these can be used to see exactly when each zone is identified. It is important to understand that consolidation zones stemming from the same origin are merged into one zone. This is a frequent occurrence when the consolidation threshold is passed, but the consolidation continues. For this reason you will often see multiple hollow candles in the later areas of the zones.
Similarly, zones from different origin points that overlap are also merged into one consolidation zone. This ensures that no core zones overlap.
Additionally, every time a zone is merged, a new volume profile for the area is calculated.
> Bar Gap Allowance Type (Technical Explanation)
The specific bar gap allowance value can be altered, but so can the type of allowance being used. While some analyses may benefit from counting the total amount of bar gaps within the consolidation, others may benefit from detecting based on consecutive bar gaps.
The chart image above displays the gap counts for each gap allowance type.
The total bar gap allowance type will count until the gap amount is reached, then terminate detection once the allowed number of gaps has been exceeded.
The consecutive bar gap allowance type resets its count once it finds a valid bar within range, by doing so, it only counts the bars that separate each island of in-range bars.
Both methods have merit.
> Implementation
This identification method has proven effective to identify consolidation across market types. As a result, there cannot be one configuration of settings to fit every application. Adapting the detection type and method for each trader's specific market conditions is highly recommended.
When determining parameters, it is helpful to consider time, as it plays a major role in the identification method.
On a 1D chart, the default threshold of 15 corresponds to 15 days, or about 3 weeks depending on the ticker. To identify periods of one-week consolidation, a threshold of 5 would be suitable. To detect perfect gapless weeks, a bar gap allowance of 0 could be used, as seen in the chart image below.
Additional Example:
In the chart image above, we see a 15-second forex chart over the span of a few hours. The detection parameters are set up to detect 15-minute consolidation with a 2-minute max dead zone (consecutive bar gap).
> Detection Source
By default, the script detects consolidation ranges using the full extent of candle wicks. While this is traditional, detection can also be done using only the candle bodies. These identifications are much more nuanced, detecting only from confirmed candle price action; they do not trigger at the same frequency as wick detection.
Optionally, a "Wick/Body Average" can be chosen as the source for detection; as the name implies, this uses the average value between the candle body and its respective wick.
> Additional Settings
The settings mentioned thus far serve as core parameters for identifying consolidation. The following parameters are simply included for the benefit of the advanced user. It is not recommended to adjust these settings under normal circumstances.
- Value Area Percent: Default = 68.26, while traditionally 70 for volume profiles, 68.26 is accurate to the values of a standard bell-curve distribution. The differences are minimal in application.
- VP Rows: Default = 99, Sets the number of rows to be used when calculating the Volume Profiles (VP); note that higher values will lead to a slower calculation. Max value: 999
> Final Notes
If you have made it this far, thank you for reading.
I hope you find value in this new consolidation identification system and understand the logic behind it.
That's it.
Script pago

Liquidity Absorption OscillatorDescription:
The Liquidity Absorption Oscillator (LAO) is a sophisticated momentum indicator that measures how efficiently price moves relative to trading range while confirming momentum with volume-based liquidity flows. By combining price efficiency analysis with volume velocity, the LAO provides earlier and more reliable signals than traditional price-only oscillators, helping traders identify high-probability trend initiations and reversals.
🔍 Core Technology & Innovation:
Tri-Component Signal Processing:
Price Efficiency Ratio (PER): Measures how "cleanly" price moves by comparing net displacement to total trading range over the lookback period. High PER indicates trending markets with directional conviction.
Volume Velocity Ratio (VVR): Combines price momentum with volume confirmation, normalized by ATR to ensure consistent behavior across different instruments and volatility regimes.
Adaptive Smoothing: Dynamically adjusts responsiveness based on market conditions - becoming more stable during noisy periods and more responsive in clean trends.
Multi-Layer Signal Detection:
Confirmed Crossovers: Traditional zero-line crosses filtered by efficiency thresholds
Early Momentum Signals: Detects momentum shifts BEFORE zero-line crosses for optimal entry timing
Smart Divergence Detection: Identifies hidden bullish/bearish divergences with built-in quality filters
🎯 Trading Signals & Interpretation:
🟢 BULLISH SIGNALS:
Strong Buy: LAO crosses above zero line with medium/high efficiency (PER)
Early Buy: Momentum accelerates while LAO is still negative (anticipates reversal)
Divergence Buy: Price makes lower low while LAO forms higher low
🔴 BEARISH SIGNALS:
Strong Sell: LAO crosses below zero line with medium/high efficiency
Early Sell: Momentum decelerates while LAO is still positive (anticipates top)
Divergence Sell: Price makes higher high while LAO forms lower high
⚪ SIGNAL QUALITY FILTERING:
Automatic signal suppression during low-efficiency (choppy) market conditions
Configurable PER threshold ensures only high-quality signals are considered
📊 Visual Features:
Clean Oscillator Display: Smooth line plot with gradient fills above/below zero line
Multiple Coloring Options: Choose between no coloring, trend-based, or slope-based bar coloring
Professional Styling: Inspired by institutional-grade indicator design with subtle visual cues
Non-Repainting Logic: All signals confirmed on bar close for reliable backtesting
⚙️ Input Parameters:
Core Settings:
Lookback Period: Base period for efficiency and velocity calculations (default: 24)
Base Smooth Period: Starting point for adaptive smoothing (default: 8)
Min Efficiency for Signals: PER threshold for signal validation (default: 35)
Divergence Lookback: Bars to search for divergence patterns (default: 5)
UI Options:
Bar Coloring: Choose visual style (None, Trend, Slope)
🔔 Alert Conditions:
Buy/Sell Signal: Traditional zero-line crosses with quality filtering
Early Buy/Early Sell: Momentum-based signals before traditional crosses
All alerts use confirmed, non-repainting logic

VWAP / MA + Average Candle Size [MaximizedTrading]VWAP / MA + Average Candle Size
Bring structure and precision to your trading with the VWAP / MA + Average Candle Size indicator, a comprehensive tool that combines every major Moving Average and VWAP variation in one adaptive system. Built for traders who want flexibility, accuracy, and a clear view of market volatility, this indicator gives you full control over your preferred averaging method and visualizes dynamic ACS-based bands that adjust automatically to changing conditions.
🧠 Why I Created This Indicator
Every trader has a favorite moving average or VWAP setup, but switching between them, recalibrating settings, and adding volatility bands can be a hassle. I built this indicator to unify all those features into a single, streamlined tool. Whether you’re a scalper using anchored VWAPs or a swing trader relying on EMAs, this indicator adapts to your workflow instantly.
I also integrated the Average Candle Size (ACS) concept to bring volatility into the equation. By combining VWAP or MA with ACS-based bands, you can instantly visualize how volatile the market is — and use those bands as dynamic zones for stop-loss or take-profit placement. This way, your strategy adapts naturally to real-time market conditions instead of relying on fixed levels.
🔧 Key Features:
All-in-One VWAP & MA Selection:
Choose between VWAP, SMA, EMA, SMMA (RMA), WMA, or VWMA — all within a single indicator.
Switch seamlessly without adding multiple tools to your chart.
Full VWAP Flexibility:
Customize your VWAP with adjustable anchor points such as Session, Week, Month, or Year — ideal for both intraday and swing trading setups.
Dynamic ACS Bands:
Up to three adaptive bands are automatically calculated based on the Average Candle Size.
Each band expands or contracts with volatility, allowing you to gauge market rhythm at a glance.
Stop-Loss & Take-Profit Guidance:
Use ACS bands as natural dynamic levels — a practical way to set stop-losses or take-profits that move with volatility rather than against it.
Visual Volatility Insights:
Quickly see when the market is quiet or active. During low volatility, the bands tighten; during strong movements, they widen — making volatility visually intuitive.
Clean and Minimal Layout:
Optimized for clarity and performance. All elements are easy to toggle on or off depending on your trading style.
📸 Example!
In this example, VWAP is anchored to the session while ACS bands (×1 and ×3) dynamically expand and contract with market volatility. Notice how price often finds resistance near the outer bands — a perfect visual guide for potential take-profit or re-entry zones.
In another setup, the 50 EMA serves as the main trend filter, with ACS bands framing price movement. During quiet periods, bands stay close to price, while during volatility spikes, they widen — clearly showing changing market conditions.
💬 I am dedicated to making this indicator as practical and user-friendly as possible. Feedback is always welcome — feel free to leave a comment or suggestion for future improvements!

Adaptive Volume Trend - [RZ]Adaptive Volume Trend
Introduction
The Adaptive Volume Trend is a dynamic, volume-weighted trend detection indicator designed to identify significant directional shifts in market momentum. By integrating price and volume data into a single adaptive framework, it helps traders visualize when market participation supports upward or downward trends.
The indicator adapts to volatility conditions through statistical measures, offering a refined approach to trend confirmation beyond traditional moving averages.
Key Features
Dynamic Volume-Weighted Analysis : Utilizes a Volume-Weighted Moving Average (VWMA) combined with exponential smoothing to account for both price movement and traded volume.
Adaptive Thresholding : Implements a rolling standard deviation-based system that automatically adjusts sensitivity to volatility and market conditions.
Color-Coded Trend Visualization : Optional bar and line coloring dynamically represent bullish and bearish market states for intuitive chart interpretation.
Alert Conditions : Built-in alerts notify users when bullish or bearish thresholds are breached, enabling timely trading decisions.
Customizable Parameters : Users can modify VWMA length, smoothing period, threshold sensitivity, and color settings to align with their preferred trading style or asset characteristics.
How It Works
The indicator calculates a smoothed VWMA of the closing price weighted by trading volume, then compares the logarithmic deviation of price from this adaptive average. A dynamic standard deviation is applied over a defined period to establish upper and lower threshold bands that represent statistically significant price deviations.
When the oscillator crosses above the upper threshold, it signals potential bullish strength supported by rising volume.
When it falls below the lower threshold, it indicates bearish dominance or weakening momentum.
A scoring mechanism assigns values (+1 for bullish, –1 for bearish) which drive both bar and line color changes, providing immediate visual feedback.
The EMA overlay line, color-shifted by signal strength, further emphasizes ongoing directional trends.
This adaptive mechanism ensures responsiveness during high-volatility markets while filtering noise during consolidation phases.
ES
NVIDIA
GOLD
Conclusion
The Adaptive Volume Trend indicator offers traders a balanced, adaptive framework to analyze volume-backed price movements. By dynamically adjusting to volatility and market participation, it enhances the reliability of trend detection and visual clarity on charts. It serves as a valuable addition for traders seeking volume-informed trend confirmation and dynamic market structure insights.
Disclaimer
This indicator is provided for educational and analytical purposes only. It does not constitute financial advice or a recommendation to buy or sell any asset. Past performance is not indicative of future results. Users should conduct their own analysis and manage risk appropriately before making any trading decisions.

Price-Volume Correlation Strength (PVC)Overview
The Price-Volume Correlation Strength (PVC) indicator is a behavioral-analysis tool that quantifies the relationship between price movement and volume participation to distinguish t rue directional moves from false momentum or exhaustion traps .
It combines dynamic price–volume correlation logic, signal clustering, liquidity-sweep detection, and multi-day reference levels into a single, data-driven framework that adapts across all markets and timeframes.
⸻
1️⃣ Core Logic — Price vs Volume Correlation
At the heart of PVC is the belief that price without volume confirmation is deception .
The script evaluates whether volume supports or contradicts price direction using a rolling volume average and short-term price delta:
Price Direction Volume Behavior
↑ Price + ↑ Volume True Bull Move ✅ — Healthy rally with strong participation
↑ Price + ↓ Volume False Bull Move ⚠️ — Buyer exhaustion or fake breakout
↓ Price + ↑ Volume True Bear Move ✅ — Active selling pressure
↓ Price + ↓ Volume False Bear Move ⚠️ — Short covering / weak decline
Candles are automatically color-coded so that traders can instantly identify whether the current move is being supported (lime/red) or rejected (gray) by the underlying volume dynamics.
2️⃣ Signal Module — Trend Confirmation & Reversal
PVC tracks sequences of consecutive “true” bars to generate BUY or SELL signals once momentum aligns with sustained volume confirmation.
A built-in signal-strength filter (user-adjustable) ensures that only moves with multi-bar confirmation are considered.
Signals are non-repainting: once triggered, they persist until an opposite direction is confirmed.
3️⃣ Liquidity Sweep Engine
Markets often manipulate recent highs/lows to trigger stops before true reversals begin.
The Liquidity Sweep Engine detects these events by comparing current highs/lows to prior extremes and validating them with above-average volume bursts .
• Bullish Sweep (Blue dot below bar): liquidity taken below prior lows, buyers absorb volume → potential reversal up.
• Bearish Sweep (Blue dot above bar): liquidity taken above prior highs, sellers absorb volume → potential reversal down.
This module helps traders recognize Smart Money traps and stop-hunt zones that precede major turning points.
4️⃣ Adaptive Dashboard
A compact, on-chart dashboard summarizes the market state in real time:
• Price Direction — UP / DOWN / FLAT
• Volume Trend — RISING / FALLING
• Move Validity — True / False Move
• Signal Status — Active Buy / Sell / Mixed
• Recent Sweeps — Bull / Bear / Both / None
Border and grid colors are user-configurable for visual clarity.
⸻
5️⃣ Multi-Day OHLC & VWAP Suite
To complement the intraday correlation engine, PVC integrates a Multi-Day OHLC module that automatically projects up to 10 previous-day levels (High, Low, Close, and VWAP).
These act as natural liquidity magnets and reaction zones where price often pauses or reverses.
Users can customize:
• Line colors for each level type
• Universal or per-type line thickness
• Number of days to display (1–10)
This turns the indicator into a complete context map—linking current price–volume behavior with historical reference levels.
⸻
6️⃣ Alerts & Practical Use
Built-in alerts trigger on:
• True Bull Move / True Bear Move (momentum confirmation)
• Buy / Sell Signals (multi-bar strength filter)
• Bullish / Bearish Liquidity Sweep (stop-hunt detection)
Best use cases
• Identify whether a breakout is real or fading before entering.
• Confirm reversals with simultaneous volume confirmation + liquidity flush.
• Combine with VWAP or structure tools to align with institutional footprints.
⸻
7️⃣ Why PVC is Original
While most volume indicators only show totals or ratios, PVC focuses on behavioral correlation—the timing and agreement between price change and participation.
By merging price–volume validation, trap detection, and multi-day liquidity mapping inside one unified system, PVC provides a contextual narrative of market strength that no single classic indicator offers.
⸻
How to Use
1. Apply on any timeframe or instrument.
2. Observe candle colors for confirmation or divergence.
3. Watch the dashboard: when both Price UP + Volume Rising + True Move + Buy Active, the move has strong backing.
4. If “False Move” or “Liquidity Sweep” appears, expect a possible reversal.
5. Align entries with daily VWAP/High/Low zones for confluence.
⸻
⚠️ Disclaimer
This script is for educational and analytical purposes.
It does not constitute financial advice or a guaranteed signal system.
Always confirm with your broader trading strategy and risk management.
⸻

Smarter Money Volume Rejection Blocks [PhenLabs]📊 Smarter Money Volume Rejection Blocks – Institutional Rejection Zone Detection
The Smarter Money Volume Rejection Blocks indicator combines high-volume analysis with statistical confidence intervals to identify where institutional traders are actively defending price levels through volume spikes and rejection patterns.
🔥 Core Methodology
Volume Spike Detection analyzes when current volume exceeds moving average by configurable multipliers (1.0-5.0x) to identify institutional activity
Rejection Candle Analysis uses dual-ratio system measuring wick percentage (30-90%) and maximum body ratio (10-60%) to confirm genuine rejections
Statistical Confidence Channels create three-level zones (upper, center, lower) based on ATR or Standard Deviation calculations
Smart Invalidation Logic automatically clears zones when price significantly breaches confidence levels to maintain relevance
Dynamic Channel Projection extends confidence intervals forward up to 200 bars with customizable length
Support Zone Identification detects bullish rejections where smart money absorbs selling pressure with high volume and strong lower wicks
Resistance Zone Mapping identifies bearish rejections where institutions defend price levels with volume spikes and pronounced upper wicks
Visual Information Dashboard displays real-time status table showing volume spike conditions and active support/resistance zones
⚙️ Technical Configuration
Dual Confidence Interval Methods: Choose between ATR-Based for trend-following environments or StdDev-Based for range-bound statistical precision
Volume Moving Average: Configurable period (default 20) for baseline volume comparison calculations
Volume Spike Multiplier: Adjustable threshold from 1.0 to 5.0 times average volume to filter institutional activity
Rejection Wick Percentage: Set minimum wick size from 30% to 90% of candle range for valid rejection detection
Maximum Body Ratio: Configure body-to-range ratio from 10% to 60% to ensure genuine rejection structures
Confidence Multiplier: Statistical multiplier (default 1.96) for 95% confidence interval calculations
Channel Projection Length: Extend confidence zones forward from 10 to 200 bars for anticipatory analysis
ATR Period: Customize Average True Range lookback from 5 to 50 bars for volatility-based calculations
StdDev Period: Adjust Standard Deviation period from 10 to 100 bars for statistical precision
🎯 Real-World Trading Applications
Identify high-probability support zones where institutional buyers have historically defended price with significant volume
Map resistance levels where smart money sellers consistently reject higher prices with volume confirmation
Combine with price action analysis to confirm breakout validity when price approaches confidence channel boundaries
Use invalidation signals to exit positions when smart money zones are definitively breached
Monitor the real-time dashboard to quickly assess current market structure and active rejection zones
Adapt strategy based on calculation method: ATR for trending markets, StdDev for ranging conditions
Set alerts on confidence level breaches to catch potential trend reversals or continuation patterns
📈 Visual Interpretation Guide
Green Zones indicate bullish rejection blocks where buyers defended with high volume and lower wicks
Red Zones indicate bearish rejection blocks where sellers defended with high volume and upper wicks
Solid Center Lines represent the core rejection price level where maximum volume activity occurred
Dashed Confidence Boundaries show upper and lower statistical limits based on volatility calculations
Zone Opacity decreases as channels extend forward to indicate decreasing confidence over time
Dashboard Color Coding provides instant visual feedback on active volume spike and zone conditions
⚠️ Important Considerations
Volume-based indicators identify historical rejection zones but cannot predict future price action with certainty
Market conditions change rapidly and institutional activity patterns evolve continuously
High volume does not guarantee level defense as market structure can shift without warning
Confidence intervals represent statistical probabilities, not guaranteed price boundaries

Average Dollar Volume by Mashrab
Standard Mode: By default, it shows a 20-period SMA of the Dollar Volume. This is great for swing trading to see if money flow is increasing over days.
Day Trading Mode: Go to the indicator settings (User Input) and check "Reset Average Daily".
The line will now represent the Cumulative Average for today only.
Example: If it's 10:00 AM, the line shows the average dollar volume per bar since the market opened at 9:30 AM. This helps you spot if the current 5-minute bar is truly igniting compared to the rest of the morning.
How to Use for Day Trading
Add the script to your 1-minute chart.
Ensure "Reset Average Daily" is checked in the settings (I made it default to true for you).
Look at the Table in the top right:
Avg Dollar Vol: This tells you the average money flowing into the stock per minute today.
1% Threshold: This gives you the exact number your friend likely uses to gauge "minimum viable liquidity" or specific risk calculations.

Buy/Sell Volume Tracker [wjdtks255]Indicator Description
Function: Separates buy and sell volume based on candle direction (close ≥ open) and displays the buy−sell difference (hist_val) as a histogram.
Visuals: Buy/sell bars are distinguished by user-selectable colors and opacity; two moving averages (MA1 and MA2) are shown to smooth the flow.
Meaning: A positive histogram indicates buy dominance; a negative histogram indicates sell dominance.
Limitation: The current separation is estimated from candle direction and may differ from execution-side (tick/trade-side) based data.
Trading Rules (Summary)
Conservative trend-following long
Entry: Enter long when hist_val turns above 0 and MA1 crosses MA2 from below.
Stop-loss: Exit if hist_val falls back below 0 or MA1 drops below MA2.
Take-profit: Use a risk:reward of 1:1.5 or set targets based on ATR.
Short-term rebound long
Entry: Enter a short-term long when a large negative histogram region begins to narrow and shows a recovery sign.
Stop-loss: Exit if hist_val drops below the previous low or bearish candles continue.
Take-profit: Prefer quick partial profit-taking.
Short (sell) strategy
Entry: Enter short when hist_val falls below 0 and MA1 crosses MA2 from above.
Stop-loss / Take-profit: Apply the inverse rules of the long strategy.
Filters and risk management
Volume filter: Only accept signals when volume exceeds a fraction of average volume to reduce noise.
Entry strength: Require |hist_val| to exceed a historical average threshold (e.g., avg(|hist_val|, N) × factor) to strengthen signals.
Position sizing: Size positions so that account risk per trade is within limits (e.g., 1–2% of account equity).
Timeframe: Use short timeframes for scalping and 1h+ for swing trading.
Scalping Dashboard - Volume Candles + Liquidity ZonesScalping Dashboard - Volume Candles + Liquidity Zones
📊 Overview
A comprehensive scalping indicator designed for high-frequency traders on 1-5 minute timeframes. This all-in-one dashboard combines volume analysis, order flow metrics, technical indicators, and institutional liquidity zones to identify high-probability scalping opportunities.
🎯 Key Features
✅ Multi-Timeframe Analysis
Fast MACD (5/13/5) for momentum
Quick EMAs (9/20/50) for trend direction
Rapid Stochastic (5/3/3) for oversold/overbought conditions
Fast RSI (7) for extreme readings
✅ Advanced Order Flow Metrics
CVD (Cumulative Volume Delta): Tracks buy vs sell pressure over time
Delta Momentum: Measures acceleration in buying/selling
Buy/Sell Pressure Ratio: Real-time balance of market forces
Order Flow Imbalance: Detects aggressive buying or selling
Tape Speed: Measures how fast volume is hitting the market
✅ Institutional Liquidity Zones
Buy-Side Liquidity: Areas above price where short stop losses cluster
Sell-Side Liquidity: Areas below price where long stop losses cluster
Liquidity Sweeps: Detects "stop hunts" by institutions before reversals
✅ Volume-Based Candle Coloring
Visual representation of volume intensity
Extreme, High, Normal, and Low volume categories
Fully customizable color schemes
✅ Dynamic Support/Resistance
Volume-weighted price levels
Automatically updates every 3 bars
Shows distance to key levels
📈 Dashboard Indicators Explained
The bottom-left dashboard displays 14 real-time metrics:
▸ MACD (●)
Green = Bullish momentum
Red = Bearish momentum
Gray = Neutral
▸ Supp (Price)
Support level
Green highlight = at support (good for long entry)
▸ Res (Price)
Resistance level
Orange highlight = at resistance (good for short entry)
▸ EMA (●)
Green = Price above EMAs (bullish)
Red = Price below EMAs (bearish)
▸ Stoch (●)
Green = Oversold (<20)
Red = Overbought (>80)
Gray = Neutral
▸ RSI (●)
Green = Oversold (<30)
Red = Overbought (>70)
Gray = Neutral
▸ CVD (●)
Green = Cumulative buying pressure
Red = Cumulative selling pressure
▸ ΔCVD (●)
Green = Increasing buy pressure
Red = Increasing sell pressure
▸ Imbal (●)
Green = Buy imbalance (>2:1 ratio)
Red = Sell imbalance
▸ Vol (●)
Green/Yellow background = Volume surge (>2x average)
▸ Tape (●)
Green/Yellow background = Fast tape (>1.5x speed)
▸ Liq (↑↓●)
↑ = Bullish sweep or near sell-side liquidity
↓ = Bearish sweep or near buy-side liquidity
● = Neutral
▸ Score (#L or #S)
Quality score (0-8) for Long or Short setups
Higher numbers = Better quality trade
▸ SCALP (LONG/SHORT/WAIT)
Primary signal
Bright color = High quality (score ≥5)
Dim color = Decent quality (score =4)
Gray = Wait for better setup
🎨 Candle Color System
Volume-Based Colors
Bright Green/Red: Extreme volume (>2.5x average) - Major moves
Medium Green/Red: High volume (>1.5x average) - Strong activity
Dull Green/Red: Normal volume - Standard market activity
Gray: Low volume (<0.5x average) - Avoid trading
Signal-Based Colors
Lime: Strong Long signal (score ≥5)
Green: Decent Long signal (score =4)
Orange: Strong Short signal (score ≥5)
Red: Decent Short signal (score =4)
Candle Color Modes (adjustable in settings):
Volume Only: Pure volume intensity
Volume + Signals: Signals override volume when present (default)
Signals Only: Only shows entry signals
🔵 Chart Indicators
Support & Resistance Lines
Green Line: Volume-weighted support level
Red Line: Volume-weighted resistance level
Lines update dynamically based on 100-bar volume profile
Liquidity Zones
Cyan Circles/Dashed Lines: Buy-side liquidity (above price)
Where short stop losses cluster
Potential targets for bullish moves
Institutions may push price here before reversing down
Magenta Circles/Dashed Lines: Sell-side liquidity (below price)
Where long stop losses cluster
Potential targets for bearish moves
Institutions may push price here before reversing up
Entry Markers
Large Green Triangle (▲): High quality long entry (score ≥5)
Small Green Triangle (▲): Decent long entry (score =4)
Large Orange Triangle (▼): High quality short entry (score ≥5)
Small Red Triangle (▼): Decent short entry (score =4)
Liquidity Sweep Markers
Cyan X-Cross (below bar): Bullish liquidity sweep - "LIQ↑"
Price swept sell-side liquidity and reversed up
Strong buy signal
Magenta X-Cross (above bar): Bearish liquidity sweep - "LIQ↓"
Price swept buy-side liquidity and reversed down
Strong sell signal
🎯 How to Use This Indicator
For Long Scalps (Buy):
Wait for Dashboard Signal: SCALP = "LONG" with score ≥5
Confirm Multiple Green Dots: Look for EMA, CVD, ΔCVD, Imbal all green
Check Volume: Vol or Tape should show yellow background (surge)
Look for Confluence:
Price at or near Support level (green highlight)
Price near Sell-Side Liquidity (magenta line below)
RSI oversold (green dot)
Large green triangle appears on chart
Best Entry: On a bullish liquidity sweep (cyan X-cross)
For Short Scalps (Sell):
Wait for Dashboard Signal: SCALP = "SHORT" with score ≥5
Confirm Multiple Red Dots: Look for EMA, CVD, ΔCVD, Imbal all red
Check Volume: Vol or Tape should show yellow background (surge)
Look for Confluence:
Price at or near Resistance level (orange highlight)
Price near Buy-Side Liquidity (cyan line above)
RSI overbought (red dot)
Large orange triangle appears on chart
Best Entry: On a bearish liquidity sweep (magenta X-cross)
Three Types of Scalping Setups:
1. Quick Scalp (Fastest - 1-5 minute holds)
MACD or Stochastic crossover + Volume surge
At Support/Resistance level
Score ≥4
2. Momentum Scalp (Ride the wave - 5-15 minute holds)
Strong EMA alignment + CVD slope positive
Order flow imbalance + Fast tape
Volume surge with price structure
Score ≥5
3. Reversal Scalp (Fade extremes - 3-10 minute holds)
Stochastic + RSI extreme readings
At Support/Resistance OR liquidity sweep
CVD momentum reversal
Score ≥6
⚙️ Recommended Settings
Timeframes
Primary: 1-minute, 2-minute, 5-minute
Confirmation: Use 15-minute chart for overall trend direction
Asset Types
Forex pairs (high liquidity)
Crypto (BTC, ETH with high volume)
Futures (ES, NQ)
Major stocks during market hours
Risk Management
Target: 1-3 times your stop loss
Stop Loss: Below nearest liquidity zone for longs, above for shorts
Position Size: Never risk more than 1% per trade
Score ≥5: Take full position size
Score =4: Take half position size or skip
🔧 Customization Options
Input Groups
MACD Settings
Fast Length: 5 (scalping optimized)
Slow Length: 13
Signal Length: 5
EMA Settings
EMA 9, 20, 50 (fast scalping EMAs)
Stochastic Settings
%K Length: 5
%D Smoothing: 3
Smooth: 3
CVD Settings
MA Length: 10 (for CVD smoothing)
RSI Settings
Length: 7 (fast RSI)
Overbought: 70
Oversold: 30
Volume Settings
MA Length: 10
Extreme Multiplier: 2.5x
High Multiplier: 1.5x
Low Multiplier: 0.5x
Liquidity Zone Settings
Lookback Periods: 20
Swing Strength: 3
Show Liquidity Zones: On/Off
Show Liquidity Sweeps: On/Off
Support/Resistance Settings
Volume Lookback: 100 bars (~2 hours on 1-min chart)
Order Flow Settings
Imbalance Threshold: 2.0 (2:1 ratio)
Color Customization
All volume colors customizable
All signal colors customizable
All liquidity colors customizable
📊 Volume Legend (Top Right)
The small table in the top-right corner shows the volume intensity key:
Extreme: >2.5x average volume
High: >1.5x average volume
Normal: 0.5x to 1.5x average volume
Low: <0.5x average volume
🔔 Built-in Alerts
Set up these alerts to never miss a trade:
High Quality Long Scalp: Triggers when entry_long and score ≥5
High Quality Short Scalp: Triggers when entry_short and score ≥5
Bullish Liquidity Sweep: Triggers when sell-side liquidity is swept
Bearish Liquidity Sweep: Triggers when buy-side liquidity is swept
To set up: Right-click chart → Add Alert → Select condition → Create
💡 Pro Tips
Understanding Liquidity Zones
Buy-Side Liquidity = Where shorts have their stops = Price tends to wick up here
Sell-Side Liquidity = Where longs have their stops = Price tends to wick down here
Liquidity Sweep = Institution triggers stops, absorbs liquidity, then reverses
Best trades = Enter AFTER the sweep when price reverses back
Reading the Dashboard
All Green Dots + Yellow Volume = Strong Long Setup
All Red Dots + Yellow Volume = Strong Short Setup
Mixed Colors = Choppy/Neutral = Wait
Score 6+ = Highest probability trades
Score 3 or less = Avoid
Confluence is Key
Never trade on a single indicator. Wait for:
Dashboard score ≥5
Volume surge (yellow background)
At support/resistance OR liquidity zone
CVD and momentum aligned
Price structure confirmation (triangle marker)
Avoid These Situations
❌ Low volume periods (gray candles)
❌ Dashboard shows "WAIT"
❌ Score below 4
❌ No volume surge during entry
❌ Trading against higher timeframe trend
Best Trading Sessions
Forex: London open (3-5 AM EST), NY open (8-10 AM EST)
Crypto: Works 24/7, best during high volume periods
Stocks: First hour (9:30-10:30 AM EST), last hour (3-4 PM EST)
Futures: US session open (9:30 AM EST)
🎓 Understanding the Scoring System
The indicator calculates a quality score (0-8) for both long and short setups:
+1 point for each:
EMA bias aligned (price above/below EMA structure)
CVD momentum bias aligned (buying/selling pressure)
Buy/Sell pressure ratio aligned (>1.5x or <0.67x)
Volume strength (surge detected)
Order flow imbalance (>2:1 ratio)
Tape speed (>1.3x average)
Price structure (higher highs or lower lows)
Liquidity bias (sweep detected)
Score Interpretation:
7-8: Extremely high probability (rare, take immediately)
6: Very high probability (excellent trade)
5: High probability (good trade)
4: Decent probability (acceptable with tight stop)
3 or less: Low probability (wait for better setup)
📋 Quick Reference Card
Entry Checklist
Dashboard shows LONG or SHORT
Score is ≥5
Multiple indicators aligned (green or red dots)
Volume surge present (yellow background)
At support/resistance or liquidity zone
Triangle marker appeared on chart
Risk:Reward ratio is at least 1:2
Exit Strategy
Take Profit: At opposite liquidity zone or resistance/support
Stop Loss: Below sell-side liquidity (longs) or above buy-side liquidity (shorts)
Trail Stop: Move to breakeven after 1:1 risk:reward achieved
⚠️ Important Notes
This is NOT a holy grail: No indicator is 100% accurate. Always use proper risk management.
Backtest first: Paper trade or backtest on your specific instrument before using real money.
Market conditions matter: This indicator works best in trending or volatile markets, not in tight consolidation.
Combine with price action: Use the indicator as confluence with your own price action reading.
Adjust for your instrument: Different assets may require tweaking the sensitivity settings.
Lower timeframes = More noise: 1-minute charts have more false signals than 5-minute charts.
🔄 Version History
v1.0 - Initial release
Multi-indicator dashboard
Volume-based candle coloring
Support/Resistance detection
Entry signal generation
v2.0 - Current version
Added liquidity zone detection
Added liquidity sweep identification
Enhanced scoring system (now 0-8)
Added liquidity bias to entries
New alerts for liquidity sweeps
Improved dashboard with Liq indicator
📞 Support & Feedback
If you find this indicator helpful, please:
⭐ Give it a boost
💬 Share your results in the comments
🐛 Report any bugs or issues
💡 Suggest improvements
Disclaimer: This indicator is for educational purposes only. Trading involves significant risk. Past performance does not guarantee future results. Always trade responsibly and never risk more than you can afford to lose.
🏆 Credits
Created for serious scalpers who want institutional-level insights on retail charts. Combines order flow analysis, volume profiling, and liquidity mapping into one comprehensive tool.
Happy Scalping! 🚀📈
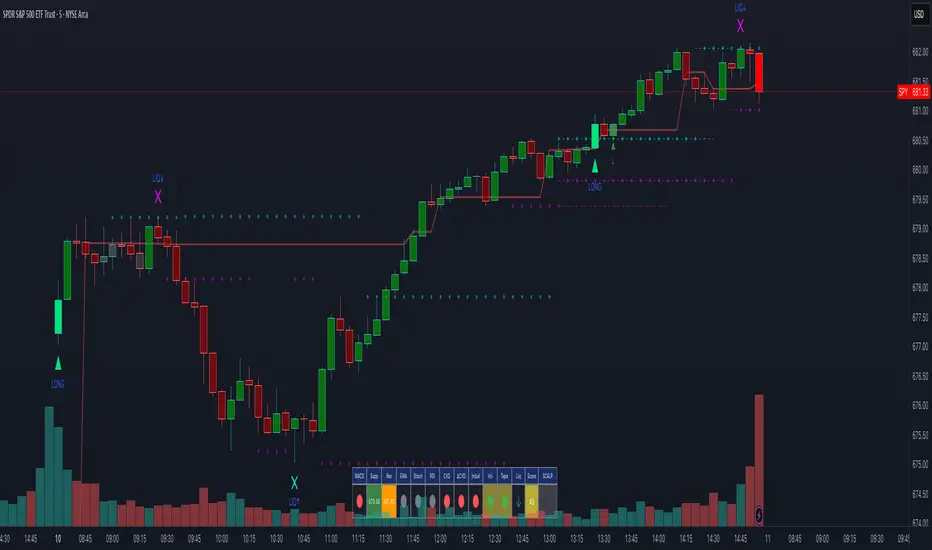
VWAP Wave System ToolkitGENERAL OVERVIEW:
The VWAP Wave System Toolkit is an all-in-one trading indicator based on rules from Auction Market Theory. The indicator is built around Volume-Weighted Average Prices (VWAP), Initial Balance (IB) levels, session/composite volume profiles, low-volume zones, optional candle coloring, trade checklists, dashboard readings, and a watermark.
This indicator was developed by Flux Charts in collaboration with Chris Drysdale (Trader Drysdale), author of the best-selling book VWAP Wave System.
What’s the purpose of this indicator?
The VWAP Wave System Toolkit helps traders see where market value is forming, shifting, or being rejected across different timeframes. It’s built on the ideas of Auction Market Theory, which views the market as a continuous auction between buyers and sellers searching for fair value. The indicator combines VWAPs, Initial Balance levels, and volume profiles into one system that shows how price interacts with value throughout the day, week, and month. By combining short-term and higher-timeframe data, it helps traders understand when the market is balanced and when it’s starting to discover new price areas.
What’s the theory behind this indicator?
This indicator is built on Auction Market Theory, introduced by J. Peter Steidlmayer. The theory says that markets operate as continuous auctions, constantly seeking a fair price where buyers and sellers agree on value. When price stays within a narrow range and volume builds up, the market is balanced around a value area. When price moves away from that area, the market enters price discovery, searching for a new zone of balance. VWAPs represent an evolving measure of value, while Volume Profiles and Initial Balance visualize how the auction developed during each session. Low Volume Zones often show where the market moved too quickly to trade efficiently, making them potential areas of interest for future reactions. By combining these elements, the indicator provides a picture of how the market is auctioning and where value may shift next.
VWAP WAVE SYSTEM TOOLKIT FEATURES:
The VWAP Wave System Toolkit indicator includes 7 main features:
Initial Balance Levels
Multi-Timeframe VWAPs
Session Volume Profile
Composite Volume Profile
Low Volume Zones
Checklist
Watermark
Initial Balance Levels:
🔹What is the Initial Balance?
The Initial Balance (IB) is defined by the high and low prices that form within a specific time window. Typically, this time window is the first hour after the regular day trading session starts (09:30 - 10:30 AM EST).
The high and low formed during this window create the foundation for the day’s price structure. From these two points, the indicator automatically calculates several key reference levels that show how far price has extended beyond the initial range or where it may still be balanced. Understanding how these levels are derived and how to interpret them is essential to using the Initial Balance effectively.
🔹How Initial Balance Levels are calculated:
Once the IB window closes, the indicator plots a full set of reference levels derived from the IB range. These levels are:
IB High
IB Low
IB Midpoint
x2 High / x2 Low
x2 Midpoints (x1.5 High/Low)
x3 High / x3 Low
x3 Midpoints (x2.5 High/Low)
🔹IB High & IB Low
The IB High is the highest price reached during the IB session window, and the IB Low is the lowest price reached.
🔹IB Midpoint
The IB Midpoint is the average of the IB High and IB Low.
🔹x2 High & x2 Low
The x2 levels are calculated by projecting one full IB Range above and below the Initial Balance. The IB Range is the distance between the IB High and IB Low.
🔹x2 High Midpoint & x2 Low Midpoint
The x2 High Midpoint (x1.5 High) is the average of the IB High and x2 High. The x2 Low Midpoint (x1.5 Low) is the average of the IB Low and x2 Low.
🔹x3 High & x3 Low
The x3 High/Low levels are calculated by projecting two full IB Range above and below the Initial Balance.
🔹x3 High Midpoint & x3 Low Midpoint
The x3 High Midpoint (x2.5 High) is the average of the x2 High and x3 High. The x3 Low Midpoint (x2.5 Low) is the average of the x2 Low and x3 Low.
🔹Breaks & Retests:
For every Initial Balance level, the indicator automatically tracks when price retests or breaks through them.
A Break occurs when a candle closes above or below an IB level. When this happens, the indicator plots a small blue triangle.
A Retest occurs when price approaches and touches an IB Level, and then reverses in the opposite direction. When this happens, the indicator plots a small green or red triangle.
Green Triangle: Bullish Retest - Price comes down to a level, touches it, and continues up.
Red Triangle: Bearish Retest - Price comes up to a level, touches it, and continues down.
Both breaks and retests are plotted directly on the chart for every toggled IB level. Once detected, they remain fixed and are not repainted.
Other Settings:
🔹Shade IB Range
When enabled, this setting fills the area between the IB High and IB Low (IB Range). The fill helps visually separate the Initial Balance range from the rest of the session, making it easier to identify when price is trading inside or outside of the IB. The color and opacity can also be adjusted through the settings.
🔹Apply One Color
When this setting is enabled, all toggled IB levels use the same color instead of the user’s inputted colors.
🔹Levels Labels
When enabled, text labels that identify each IB level (for example, “IB High,” “x2 High,” or “x2.5 Low”) appear next to each level.
🔹Price Labels
When enabled, the indicator displays the real-time price value of each IB level directly on the chart. These labels update automatically as price changes or when the levels shift due to recalculation from a new session.
🔹Extend Levels Right
When enabled, all toggled IB Levels will be extended infinitely to the right of the chart.
🔹Align Text Right
This setting aligns all level and price labels to the right edge of the plotted line. When disabled, text labels will be aligned to the left edge of each level.
Multi-Timeframe VWAPs:
🔹Why does this indicator include VWAPs?
This indicator includes VWAPs because they show where the most trading activity has occurred within each timeframe, helping identify the market’s fair value area. According to Auction Market Theory, price moves between periods of balance and imbalance as buyers and sellers seek fair value. VWAPs represent those balance points where the majority of trading has taken place. By plotting the Intraday, Weekly, and Monthly VWAPs, the indicator shows how value shifts across different timeframes and whether the market is balanced or moving toward a new area of value.
🔹Intraday VWAP
The Intraday VWAP measures the average traded price for the current trading session and resets each day at market open. It shows where most of the session’s trading has taken place, acting as a real-time fair value line. When price trades near the Intraday VWAP, the market is considered balanced. When price moves far above or below it, the market is exploring new value areas.
🔹Candle Coloring:
The Intraday VWAP candle coloring highlights how far price is trading from the session’s average value using the first and second standard deviation bands as visual reference zones. This feature helps users see whether price is balanced around fair value or expanding into an overextended area.
When candle coloring is enabled, each candle’s color changes based on where it closes relative to the two standard deviation bands surrounding the Intraday VWAP. The first band represents one standard deviation (1.0 STD) and the second represents one and a half standard deviations (1.5 STD).
If a candle closes above the upper 1.5 standard deviation band, it is colored a brighter green, showing strong movement above fair value. Candles closing between the upper 1.0 and 1.5 standard deviation bands are a lighter green, showing moderate strength. If a candle closes below the lower 1.5 standard deviation band, it is colored a brighter red, showing strong movement below fair value. Candles closing between the lower 1.0 and 1.5 standard deviation bands are a lighter red, showing moderate weakness. Candles that close within the ±1.0 standard deviation range remain their normal color, showing that price is balanced near the session’s average.
Both the VWAP line and its bands can be customized in the Intraday VWAP settings. Users can adjust the VWAP line color, band colors, and fill transparency. The candle colors can also be modified. The band sizes (1.0 STD and 1.5 STD by default) can be changed through their input multipliers, allowing users to control the sensitivity of the zones.
Please Note: This candle coloring applies only to the Intraday VWAP
🔹Weekly VWAP
The Weekly VWAP measures the average traded price across the current trading week and resets at the start of each new week. It reflects the fair value area that has developed over multiple trading days, providing a broader view of market balance compared to the Intraday VWAP. When price stays close to the Weekly VWAP, it indicates that the week’s trading activity is balanced. When price consistently trades above or below it, the market is moving away from that balance and forming value in a new area.
Standard Deviation Bands:
The Weekly VWAP includes optional standard deviation bands. Users can toggle 1x and 1.5x STD bands. Users can also adjust the multipliers.
Customization:
All colors for the Weekly VWAP and its standard deviation bands can be changed in the indicator’s settings. Users can adjust the VWAP line color, band colors, and fill transparency.
🔹Monthly VWAP
The Monthly VWAP measures the average traded price for the current month and resets on the first trading day of each new month. It provides the broadest view of value within this indicator, showing where the majority of trading has occurred during the current month. When price remains near the Monthly VWAP, it reflects long-term balance.
Standard Deviation Bands:
The Monthly VWAP includes optional 1x and 1.5x standard deviation bands that can be enabled or disabled. In the settings, users can adjust the standard deviation multipliers.
Customization:
The Monthly VWAP line, band colors, and fill transparency can all be modified in the indicator’s settings.
🔹VWAP Dashboard
The VWAP Dashboard provides a quick real-time overview of how price is positioned relative to the Intraday, Weekly, and Monthly VWAPs. It is displayed directly on the chart and updates automatically with each new candle.
The dashboard is divided into five labeled sections:
Intraday
Weekly
Monthly
Weekly STD
Monthly STD
Intraday, Weekly, and Monthly Sections:
These three sections show whether price is currently trading Above or Below each VWAP.
If price is above a VWAP, that section displays “Bullish”
If price is below a VWAP, that section displays “Bearish”
Weekly STD and Monthly STD:
These sections display whether price is currently inside or outside the standard deviation bands of the Weekly and Monthly VWAPs.
When price is trading within the ±1.0 standard deviation zone, the dashboard output is “Balanced Market”
When price is above the upper standard deviation, price is extending up beyond the week’s or month’s fair value, and the dashboard output is “Bullish Price Discovery”
When price is below the lower standard deviation, price is extending down beyond the week’s or month’s fair value, and the dashboard output is “Bearish Price Discovery”
🔹What is a Balanced Market
A balanced market occurs when price is trading within the ±1.0 standard deviation range of a VWAP. This shows that buyers and sellers are in general agreement on value, and trading activity is taking place around the fair value area. In this state, price tends to rotate around the VWAP rather than trend strongly away from it. Balance reflects stability in the auction process, where neither side is dominant and value is being built at current prices.
🔹What is Bullish Price Discovery
Bullish Price Discovery occurs when price trades above the upper standard deviation of a VWAP. This indicates that buyers are accepting higher prices and that value may be shifting upward. In terms of Auction Market Theory, the market is moving away from balance as it searches for a new fair value area above the prior range.
🔹What is Bearish Price Discovery
Bearish Price Discovery occurs when price trades below the lower standard deviation of a VWAP. This shows that sellers are accepting lower prices and that value may be developing beneath the prior area of balance. The market is moving out of equilibrium as participants test lower prices to find new fair value.
Session Volume Profile:
🔹Why this feature is included:
The Session Volume Profile is included to show where trading activity occurred within each session. It visually represents the volume traded at each price, helping to identify where market participants considered value to be. This ties directly to Auction Market Theory, which views markets as auctions seeking balance between buyers and sellers. The profile highlights those balance areas and shows where volume thins out, helping distinguish between value areas and areas of rejection.
🔹How is the Session Volume Profile calculated and displayed:
At the start of each selected session window, the indicator creates a new volume profile and tracks every bar in that session. For each candle, it saves the high, low, open, close, volume, and time. When the HD (High Definition) setting is enabled, and your chart is between the 1-minute and 30-minute timeframes (recommended), the indicator requests lower-timeframe data and feeds the profile with 1-minute candlesticks for more detail. The running session high and low define the vertical bounds of the volume profile. That span is split into a fixed number of rows. Each row represents a price slice. For every bar and every price row, the indicator checks whether the bar’s high-low range touches that row. If it does, it adds part of the bar’s volume to that row. The allocation uses a step-to-bar-size ratio, so that narrow bars do not overload a tall row and tall bars contribute proportionally across all rows they cross. If the bar closes above its open, that row’s “up” volume bucket is incremented. If it closes below its open, the “down” bucket is incremented. After all bars are processed, the row with the highest total becomes the Point of Control (POC). Starting from that row, the indicator expands upward and downward, adding adjacent rows until the cumulative total reaches your Value Area percentage. The upper boundary is Value Area High (VAH), and the lower boundary is Value Area Low (VAL).
For rendering, each price row becomes a horizontal box drawn from the session start time to a length proportional to that row’s volume versus the session’s maximum row volume. If you choose “Up / Down” volume, the row is split into two adjoining boxes that show the up and down portions. If you choose “Total,” a single box is drawn to the total length. If you choose “Delta,” the length reflects the absolute difference between up and down. The POC is drawn as a line across the row midpoint. VAH and VAL are drawn at the exact prices of the top and bottom value rows. While a session is open the profile keeps updating as new bars form. When the session ends, the script fixes its start and end and stops changing that profile. To avoid any issues with drawing limits, the indicator only renders the two most recent session volume profiles.
Settings:
🔹Enabled
Turns the Session Volume Profile on or off. When disabled, no session profiles, lines, or volume boxes are displayed.
🔹HD
Stands for High Definition. When enabled, the indicator requests data from the 1-minute timeframe to build a smoother, more detailed volume profile. This produces finer row distribution and more accurate POC, VAH, and VAL positioning, especially on higher chart timeframes.
🔹POC Line
Toggles the visibility of the Point of Control line. The POC represents the price level with the highest traded volume in the session. It’s drawn horizontally across the chart at that price, and its color can be customized in settings.
🔹VAH
Controls the display of the Value Area High line. The VAH is the top boundary of the range that contains the specified percentage of total traded volume (default 70%). It marks where volume starts to thin out above fair value. Users can turn it on or off and customize its color.
🔹VAL
Controls the display of the Value Area Low line. The VAL is the lower boundary of the value area and marks where volume thins out below fair value. Its visibility and color can also be customized.
🔹Session
This setting allows users to define the start and end time of the trading session used to calculate the session volume profile. Only bars within this time window are included in the volume profile. When a session ends, the volume profile locks, and a new one begins automatically when the next session begins based on the user’s input.
🔹Volume
Controls how the histogram rows are displayed:
Up/Down: Splits each price row into two parts: one for bullish candles (Up volume) and one for bearish candles (Down volume). This helps visualize buying versus selling pressure at each price.
Total: Combines both Up and Down volume into a single-colored bar for each price level. Since direction isn’t separated, this view focuses purely on where trading activity was concentrated, regardless of which side was in control. A tall bar means strong participation and interest at that price.
Delta: Displays the difference between up and down volume (Up/Down) for each row, highlighting which side controlled that price area.
🔹Value Area Volume
The Value Area Volume setting defines how much of the total session volume is considered the “value area.” By default, it’s 70%, meaning the indicator finds the price range where 70% of all trading took place during that session. This area is where buyers and sellers agreed the most on price, also known as the fair value zone.
If you increase the percentage (for example, to 80%), the value area becomes wider and includes more of the session’s trading range. Lowering it (for example, to 60%) makes it narrower, focusing only on the prices with the heaviest activity.
🔹Row Size
The Row Size controls how detailed the volume profile looks. It decides how many price levels (rows) the profile is divided into. Smaller values make the profile smoother and easier to read but less precise. Larger values add more detail and show exactly where volume clustered, but they can make the profile look denser.
The maximum value is 450 rows, and the minimum value is 5 rows. Higher values (especially above 200) can make the volume profile appear more detailed but may also cause performance issues or partial rendering on TradingView charts due to the platform’s drawing object limits. For most users, values between 50–150 give a good balance between clarity and performance.
25 Rows vs. 200 Rows:
Composite Volume Profile:
The Composite Volume Profile shows how volume is distributed across a larger selected range instead of just one session. It helps traders see where the most trading activity has taken place over multiple days. This gives a picture of long-term balance areas and important price zones that have repeatedly attracted buyers and sellers.
The Composite Profile uses the same base logic and visual settings as the Session Volume Profile, including POC Line, VAH, VAL, Volume Type, Value Area Volume, Row Size, and Colors. Any customization applied to those settings also affects the Composite Profile, ensuring a consistent appearance across both features.
🔹Session Count Setting:
This setting controls how many past sessions are merged into one composite volume profile. For example, if the Session Count is set to 5, and each session represents one trading day, the profile combines data from the last 5 trading days. A “session” refers to the time window defined in the Session Volume Profile settings.
🔹How is the Composite Volume Profile used?
In Auction Market Theory, markets move through phases of balance and imbalance as traders agree on value before moving to explore new ones. The Composite Volume Profile shows where that long-term balance has formed. Large, wide areas on the profile indicate zones where multiple sessions agreed on value. Thin areas show prices that were quickly rejected, where less time and volume were traded. Combining short-term session profiles into a composite helps identify when the market is holding near established value or entering new price discovery, confirming transitions between balance and price discovery.
Low Volume Zones:
🔹What are Low Volume Zones?
Low Volume Zones (LVZs) are price areas where trading activity was minimal compared to surrounding levels. On a volume profile, they appear as thin “valleys” between two high-volume “peaks.” These valleys show where the market moved too quickly for significant two-way trade to occur. In Auction Market Theory, they represent inefficient areas, meaning the market didn’t find fair value, so price either skipped through or rejected those levels.
🔹How are Low Volume Zones found?
The indicator identifies Low Volume Zones (LVZs) directly from Session Volume Profiles (SVPs) by analyzing the shape of its volume distribution. Each SVP is built from a series of horizontal rows, where each row represents the total traded volume within a narrow price range. The longer the row, the higher the trading activity at that price.
The indicator first locates the two largest high-volume peaks on the profile. These peaks represent the strongest areas of market activity. Once these two main peaks are found, the indicator looks on both sides of each peak for the lowest-volume row in the surrounding area. Those small-volume dips define the boundaries of the Low Volume Zones.
Each high-volume peak can therefore generate two LVZs (one above and one below it), resulting in a maximum of four Low Volume Zones per volume profile. If two LVZs overlap or share the same price range, they are automatically merged into a single larger zone, which may reduce the total count to three or fewer.
🔹How are Low Volume Zones used?
Low Volume Zones (LVZs) mark areas where the market previously traded with little participation. In Auction Market Theory, these zones represent inefficient price areas where buyers and sellers failed to agree on value. When price returns to an LVZ, it may act as an area where price tends to react differently due to lower previous trading activity. If the market still sees that area as unfair, price will reject it and reverse quickly. If the market now accepts that price level, volume builds and price moves through it smoothly as the auction seeks new balance. Traders use LVZs to identify where price may react sharply or move quickly through thin areas. When price approaches a zone from above or below, it signals potential rejection or continuation.
🔹LVZ Breaks and Retests
The indicator automatically tracks how price interacts with every detected LVZ.
A Break occurs when price fully moves through the entire LVZ and closes past it. When this happens, the indicator plots a small blue triangle.
A Retest occurs when price touches an LVZ and reverses away, showing rejection. When price comes down to a level, taps it, and continues up, it’s considered a bullish retest, and a small green triangle is plotted. When price comes up to a level, taps it, and continues down, it’s considered a bearish retest, and a small red triangle is plotted.
🔹LVZ Settings
Enabled:
Toggles LVZ detection and visualization on or off.
Realtime:
Allows LVZs to form dynamically as the current session develops, updating live as volume builds or thins out. When disabled, zones only appear once the session closes.
Please note: When this setting is enabled, zones may update or shift while the current session is still forming. Because the Session Volume Profile is continuously recalculating with new data, both the volume distribution and detected zones can change until the session closes.
Row Pivot Length:
Controls how far above and below each price row the indicator looks when identifying the highest and lowest volume points that define each Low Volume Zone. Larger values make the indicator compare a wider range of rows, while smaller values keep the analysis closer to each row’s immediate area.
Last SVPs:
Defines how many recent Session Volume Profiles are used for LVZs. For example, setting it to 3 limits LVZ detection to the last three sessions only.
Retests and Breaks:
Enables or disables the display of the retest and break markers described above.
Checklist:
The Checklist is a manual on-chart dashboard that allows traders to keep track of specific market conditions before entering a trade. Each checklist item can be toggled on or off in the indicator’s settings. When enabled, a checkmark emoji appears next to that item on the dashboard. When disabled, an X emoji appears next to that item.
This feature is designed to help traders visually confirm important steps in their process, such as reviewing trend direction, VWAP alignment, or session context. The checklist can also be repositioned anywhere on the chart using the “Location” setting for better visibility and layout preference.
Watermark:
The Watermark feature displays key chart information directly in the background, including the current ticker symbol, selected timeframe, and date. The watermark’s size, color, and transparency can be adjusted in the settings.
UNIQUENESS:
The VWAP Wave System Toolkit is unique because it brings every part of Auction Market Theory to the chart. It shows how value builds and shifts by combining Initial Balance levels, multi-timeframe VWAPs, and volume profiles. The indicator automatically marks low-volume zones where the market moved too quickly, highlights breaks and retests, and tracks how price interacts with fair value across sessions, weeks, and months. Every feature works together to give a simple view of balance, imbalance, and value development as the auction unfolds.

Fair Value Gap Pro by Bifrost InstituteFair Value Gap Pro brings institutional-style FVGs to TradingView with the precision and controls traders actually need. It detects clean 3-candle gaps on any higher timeframe, projects them onto your active chart, and overlays precise buy/sell volume ratios so you can judge the quality of a gap at a glance. Everything is customizable—from colors and line styles to tag markers, and volume display—so the tool adapts to your workflow instead of the other way around.
🔭 Multi-Timeframe Engine
Higher Timeframe Detection: Choose any HTF (M5, H1, H4, D1, etc.) and view those gaps on any lower-TF chart
Smart Gap Detection: Strict 3-candle mode ensures only successive bars form gaps—automatically rejects weekend gaps and market closures
Configurable History: Scan back 1-500+ bars with intelligent processing
Extend Until Filled: Gaps dynamically extend forward until price fills them, or use fixed-width mode
Advanced Fill Logic: Fill Rules - Close only, wick only, or close/wick; Fill Depth: TouchAny (immediate edge touch) or TouchMid (requires 50% penetration)
TouchMid Margin: Fine-tune difficulty with -50% to +50% adjustment (e.g., -10% = easier fill at 40% depth)
Weekend Gap Protection: Prevents false fills from market gaps—only real price action counts
📊 HTF-Accurate Volumetrics
True HTF Volume: Uses higher timeframe bar data for accurate volume matching across all chart timeframes
Buy vs Sell Delta: Integrated volume analysis for every FVG shows institutional pressure
Display Formats: Decimal ratios, percentages, or raw values (with K/M/B suffixes)
Volume Modes: Bar Delta (fast & reliable, recommended), Tick Delta (optional, feed-dependent)
Clear "+" (buy) and "–" (sell) prefixes for instant reading
🎨 Fully Customizable Appearance
Color Control: Color pickers for Bullish/Bearish FVG fills & Filled state colors (different from active), Band lines, midlines, and text labels.
Formation and fill tag markers
Line Styling: Color & Width
🔔 Alerts
Toggle formation/fill alerts independently
🏷 Tags
Visual Tags: Show markers - Text / Icon per event type
Icon choices: Circle, Square, Diamond, Star, Up/Down Arrow
Independent colors for formation vs fill tags
Auto-remove "formed" tag when "filled" tag appears
Configurable size and positioning
🧩 Rendering & Fill Display
Triple-Band Display: Upper, mid, and lower boundary lines with configurable styles
Filled Rectangle: Semi-transparent fill between boundaries for clear visualization
Fill State Management: Hide filled gaps completely, or keep them visible with distinct "filled" colors.
"Use Filled Colours" option for easy state identification
Quality Filters: Minimum body size filter (in chart points) to exclude noise from low-volatility periods
⚙️ Quality-of-Life Features
Performance Optimized: Efficient HTF/LTF time mapping with binary search algorithms
Cross-Symbol Compatible: Robust handling across all symbols and data feeds
Sensible Defaults: Works beautifully out of the box—tweak only what you need
Minimal Chart Clutter: Designed to keep critical information visible without overwhelming your workspace
💡 Perfect For
Institutional gap traders who need precision and control
Multi-timeframe analysts requiring HTF context on LTF charts
Volume profile traders seeking buy/sell pressure confirmation
Traders who value clean, professional chart aesthetics
Anyone tired of indicators that force rigid workflows
Fair Value Gap Pro doesn't just show you gaps—it gives you the complete institutional picture with the flexibility to trade your way.
