Institutional 50: The Truth TellerOverview This is a comprehensive "Fusion Strategy" overlay designed to filter out false breakouts and catch high-probability trends. It upgrades the classic EMA 50 Cross Strategy by "locking" the signal with Institutional Volume Flow (VFI) and adding an automated Fibonacci safety guard.
The Problem Standard moving average strategies often fail in two scenarios:
Fakeouts: Price crosses the line, but there is no real volume backing the move.
Choppy Markets: The price dances around the line, generating multiple false signals.
The Solution: Triple-Layer Filtering This indicator solves these issues using a strict logic:
The Trigger (EMA 50): The primary signal is generated when price crosses the EMA 50.
The Lock (VFI Filter): A signal is ONLY valid if the Volume Flow Indicator (VFI) confirms the direction (Positive for Buy, Negative for Sell). If price crosses but VFI disagrees, the line turns GRAY, warning of a "Empty Rally" or "Bear Trap."
The Safety (Fib Guard): The system automatically draws invisible Fibonacci retracement levels based on recent price action. If a trend reverses and breaks the Golden Ratio (0.618), a Yellow Warning Arrow appears, signaling a potential trend failure.
Anti-Chop Filter: It calculates the slope of the EMA. If the market is flat/ranging, the line turns WHITE and signals are suppressed.
Visual Guide & Legend
🟢 Green Line + BUY Label: Confirmed Uptrend (Price > EMA 50 + Positive Institutional Volume).
🔴 Red Line + SELL Label: Confirmed Downtrend (Price < EMA 50 + Negative Institutional Volume).
⚪ Gray Line: CAUTION. Price has crossed the EMA, but Volume does NOT confirm. Do not enter.
⬜ White Line / Background: CHOP ZONE. The market is ranging/flat. No trades.
⚠️ Yellow Arrows (EXIT?): The price has moved against the trend and broken key Fibonacci Support/Resistance. Consider tightening stops or exiting.
Best For:
Trend Following on 1H, 4H, and Daily timeframes.
Traders looking to filter out "Noise" and focus only on Volume-Backed moves.
Volume
Sniper 50: VFI Lockedבבקשה. הנה תיאור מקצועי, חד וברור באנגלית עבור האינדיקטור הסופי שבנינו (Sniper 50: VFI Locked). זה כתוב בצורה שמתאימה לפרסום ב-TradingView או לשיתוף עם סוחרים אחרים, ומסביר בדיוק את ה"מוח" מאחורי המערכת.
תעתיק את זה:
Name:
Sniper 50: VFI Locked & Fib Guard
Description:
Overview This is a comprehensive "Fusion Strategy" overlay designed to filter out false breakouts and catch high-probability trends. It upgrades the classic EMA 50 Cross Strategy by "locking" the signal with Institutional Volume Flow (VFI) and adding an automated Fibonacci safety guard.
The Problem Standard moving average strategies often fail in two scenarios:
Fakeouts: Price crosses the line, but there is no real volume backing the move.
Choppy Markets: The price dances around the line, generating multiple false signals.
The Solution: Triple-Layer Filtering This indicator solves these issues using a strict logic:
The Trigger (EMA 50): The primary signal is generated when price crosses the EMA 50.
The Lock (VFI Filter): A signal is ONLY valid if the Volume Flow Indicator (VFI) confirms the direction (Positive for Buy, Negative for Sell). If price crosses but VFI disagrees, the line turns GRAY, warning of a "Empty Rally" or "Bear Trap."
The Safety (Fib Guard): The system automatically draws invisible Fibonacci retracement levels based on recent price action. If a trend reverses and breaks the Golden Ratio (0.618), a Yellow Warning Arrow appears, signaling a potential trend failure.
Anti-Chop Filter: It calculates the slope of the EMA. If the market is flat/ranging, the line turns WHITE and signals are suppressed.
Visual Guide & Legend
🟢 Green Line + BUY Label: Confirmed Uptrend (Price > EMA 50 + Positive Institutional Volume).
🔴 Red Line + SELL Label: Confirmed Downtrend (Price < EMA 50 + Negative Institutional Volume).
⚪ Gray Line: CAUTION. Price has crossed the EMA, but Volume does NOT confirm. Do not enter.
⬜ White Line / Background: CHOP ZONE. The market is ranging/flat. No trades.
⚠️ Yellow Arrows (EXIT?): The price has moved against the trend and broken key Fibonacci Support/Resistance. Consider tightening stops or exiting.
Best For:
Trend Following on 1H, 4H, and Daily timeframes.
Traders looking to filter out "Noise" and focus only on Volume-Backed moves.

Advanced Delta Trading System ProAdvanced Delta Trading System Pro
Overview
This indicator is an advanced order flow analysis tool that combines Delta Volume Analysis, Cumulative Volume Delta (CVD), Multi-Timeframe Trend Confirmation, and Volume Profile Zones to identify high-probability trading opportunities based on institutional buying and selling pressure.
🔍 Core Concepts & Methodology
1. Range-Weighted Delta Calculation (Original Implementation)
Unlike basic delta indicators that simply subtract selling volume from buying volume, this script uses a range-weighted approach:
Range Weight = |Price Movement| / Candle Range
Bar Delta = Volume × Direction × Range Weight
Why this matters:
Accounts for intra-bar price action strength
Provides more accurate representation of directional conviction
Filters out low-conviction volume during ranging periods
2. Cumulative Volume Delta (CVD) with Momentum
The script calculates CVD by accumulating bar deltas and applies:
EMA smoothing to reduce noise (adjustable period)
Delta Momentum indicator: Measures the rate of change of delta relative to its average
CVD Slope detection: Identifies accumulation/distribution phases
Formula:
Delta Momentum = Current Absolute Delta / Average Absolute Delta
This normalized momentum metric helps filter low-conviction signals.
3. Multi-Timeframe CVD Confluence (Unique Feature)
The indicator pulls CVD trend data from a higher timeframe (default: 15min) to:
Confirm signals only when aligned with HTF institutional flow
Display HTF bias in the dashboard (Bull ▲ / Bear ▼ / Neutral)
Prevent counter-trend trades against larger timeframe momentum
Edge: Many delta indicators operate on single timeframes; this multi-timeframe approach significantly reduces false signals.
4. Volume Profile Zone Detection
Instead of static support/resistance, the script dynamically identifies:
High Volume Nodes (HVN): Areas with 1.5x above-average volume - potential magnets/reversal zones
Low Volume Nodes (LVN): Areas with <0.5x average volume - breakout zones with minimal resistance
These zones are visualized as semi-transparent boxes on the chart, updated in real-time.
5. Delta-CVD Divergence Detection
The script identifies:
Bullish Divergence: Price makes lower low while CVD makes higher low (accumulation)
Bearish Divergence: Price makes higher high while CVD makes lower high (distribution)
Uses pivot detection with adjustable lookback periods and draws divergence lines automatically.
🎯 Signal Generation Logic
Buy Signal Requirements:
Bar delta exceeds threshold (Average Delta × Imbalance Multiplier)
Delta momentum ≥ minimum threshold (default: 1.2)
CVD slope is positive (accumulation phase)
Higher timeframe CVD is bullish (if MTF enabled)
Candle closes green (price confirmation)
Sell Signal Requirements:
Same criteria but inverted for selling pressure.
Enhanced Signals:
Signals are strengthened when accompanied by divergences, combining immediate imbalance with underlying accumulation/distribution patterns.
📊 Visual Features
1. Intelligent Candle Coloring
Color intensity based on delta momentum (0-3 scale)
Lime: Strong buying | Red: Strong selling | Gray: Neutral
Helps quickly identify conviction behind price moves
2. Delta Labels
Optional labels showing exact delta values (in thousands for readability)
Adjustable frequency (every Nth bar)
Color-coded by strength
3. Real-Time Dashboard
Displays:
Current bar delta
Cumulative Volume Delta (CVD)
Delta momentum reading
Higher timeframe bias
Active signals and divergences
⚙️ Customization Options
Delta Settings:
CVD Smoothing: Controls EMA period for CVD line
Avg Delta Length: Lookback for delta average calculation
Delta Momentum Period: Smoothing for momentum indicator
Signal Filters:
Imbalance Multiplier: Threshold for signal generation (higher = fewer, stronger signals)
CVD Confluence: Require/disable CVD trend alignment
Min Momentum: Filter weak signals below threshold
Volume Zones:
Lookback Period: Bars analyzed for HVN/LVN detection
Max Zone Boxes: Limit visual clutter
Toggle HVN/LVN independently
Multi-Timeframe:
Select any higher timeframe for CVD analysis
HTF Bias Panel: Show/hide dashboard element
🔔 Alert Conditions
Long/Short Signals: Fires when all confluence conditions met
Divergence Alerts: Bullish/Bearish divergence detected
Extreme Momentum: Delta momentum exceeds 2.5× average
HTF Trend Change: Higher timeframe CVD reverses
💡 How to Use
For Scalping:
Use 1-5min charts with 15min HTF confirmation
Focus on extreme momentum alerts (>2.5×)
Enter on signals near HVN zones for better R:R
For Swing Trading:
Use 15min-1H charts with 4H HTF confirmation
Wait for divergences + signal confluence
Avoid LVN zones (price likely to slice through)
Volume Profile Strategy:
Buy at HVN support with bullish delta
Sell at HVN resistance with bearish delta
Target LVN zones for breakout trades
🆚 What Makes This Script Unique
Unlike standard delta indicators, this combines:
Range-weighted delta (more accurate than simple volume delta)
Multi-timeframe confirmation (institutional flow alignment)
Dynamic volume profile zones (not static S/R)
Momentum-filtered signals (reduces noise significantly)
Divergence integration (catches reversals early)
Compared to free alternatives: Most delta scripts show raw cumulative delta without momentum filtering, MTF analysis, or volume profile integration. This script provides a complete order flow analysis system in one indicator.
⚠️ Important Notes
Not a standalone system: Use with price action and market structure
Optimize settings per asset: Crypto needs different settings than forex/stocks
Higher timeframes = more reliable: Reduce noise on lower timeframes with longer smoothing
Volume quality matters: Works best on high-liquidity assets with accurate volume data
📈 Best Timeframes
Scalping: 1m-5m (with 15m HTF)
Day Trading: 5m-15m (with 1H HTF)
Swing Trading: 1H-4H (with D HTF)
This indicator is designed for traders who understand order flow concepts and want a comprehensive, multi-layered approach to delta analysis beyond basic cumulative volume delta indicators.

QuantumFlowTrader V1QuantumFlowTrader V1 — Adaptive Institutional Flow Framework
Overview
QuantumFlowTrader V1 is a precision-built visual tool that fuses institutional structure, dynamic volatility, and balance zones into one unified system.
It is designed to help traders align with the market’s internal flow without relying on lagging indicators or fixed settings.
Core Components
1. Adaptive EMA Clouds — Structural Flow
Layered exponential moving averages adapt to current conditions, clearly showing when market structure is aligned or in transition. Cloud color and intensity adjust automatically to reflect real-time directional bias.
2. Dynamic VWAP + Deviation Zones
Includes a self-adjusting VWAP with optional deviation bands (VWAP Deviation Zones) that reflect institutional fair-value areas — places where price often reacts, pauses, or mean-reverts.
The VWAP line shifts color based on price positioning.
3. Quantum ATR Engine — Multi-Layer Volatility Sync
A proprietary multi-ATR engine detects when volatility signals align in one direction across multiple sensitivities.
Arrows appear only on full directional agreement, signaling high-conviction flow moments.
4. Session Visualization + Arrow Filtering
Background shading highlights key trading sessions (Asia, London, USA).
You can optionally disable arrow signals during specific sessions for a cleaner view.
Features & Alerts
- Toggle EMA Clouds, VWAP, Deviation Zones, and ATR Arrows independently.
- Customize all colors, transparencies, and visual styles.
- Built-in alerts for bullish and bearish arrow signals.
Compatibility
Works on all assets: Forex, Crypto, Stocks, Indices, Futures.
Fully adaptive across all timeframes — intraday to swing.
No optimization needed — smart parameters adjust automatically.
Strategy Alignment Tip
QuantumFlowTrader V1 adapts to any trading strategy and acts as a directional compass for market flow.
It becomes especially powerful when combining multiple timeframes — for example, using the 1H and 15M charts to define trend alignment, and then executing entries on lower timeframes in the direction of that flow.
Note: Entry setups are defined by each trader’s individual system.
This indicator does not provide entry points — it highlights multi-timeframe alignment and directional bias.
To request access, contact via TradingView profile.

Sniper 50: The Trend Master [Pure Signal]Overview Sometimes, the simplest strategies are the deadliest. This indicator brings the legendary "EMA 50 Strategy" to your chart in its purest form. It is designed to capture major market trends and reversals immediately as they happen, stripping away complex filters that often cause lag.
Why the EMA 50? The 50-period Exponential Moving Average is widely regarded by institutional traders as the primary divider between bullish and bearish territory. This tool automates the monitoring of this key level.
How It Works The logic is raw and direct:
BUY Signal: Triggered immediately when the candle closes ABOVE the EMA 50.
SELL Signal: Triggered immediately when the candle closes BELOW the EMA 50.
Key Features
Zero Noise Technology: Includes a built-in state machine that prevents repetitive signals. You will receive exactly ONE signal when the trend flips, and silence until the next reversal.
Dynamic Visuals: The EMA line changes color (Green for Bullish, Red for Bearish) to give you instant context.
Lag-Free: unlike other tools that wait for multiple confirmations, this tool prioritizes speed to catch sharp moves (like sudden crashes or rallies).
Best For
Trend Following
Swing Trading (Crypto & Stocks)
Catching rapid reversals that complex indicators might miss.

TMT EMA Bundle - Hitesh NimjeTMT EMA Bundle - Multi Timeframe EMA Indicator
Created by: Hitesh Nimje | Contact: 8087192915
Overview
The TMT EMA Bundle is a comprehensive multi-EMA indicator designed for traders who rely on multiple exponential moving averages for trend analysis and trading decisions. This powerful tool displays 10 essential EMAs on your chart, providing complete visibility of short, medium, and long-term trends.
Key Features
🔹 10 Essential EMAs Included:
• EMA 9 (Blue) - Ultra Short-term trend
• EMA 11 (Red) - Short-term momentum
• EMA 15 (Yellow) - Quick trend changes
• EMA 21 (Black) - Swing trading reference
• EMA 50 (Gray) - Medium-term bias
• EMA 51 (Orange) - Alternative medium-term
• EMA 55 (Brown) - Extended medium-term
• EMA 100 (Purple) - Long-term trend
• EMA 200 (Maroon) - Major support/resistance
• EMA 400 (Green) - Primary trend direction
🔹 Customizable Settings
• Source selection for each EMA (Open, High, Low, Close, HL2, HLC3, OHLC4)
• Independent length adjustment for each moving average
• Color-coded lines for easy identification
🔹 Professional Features
• Clean, overlay display on price charts
• Optimized performance with max limits set
• Compatible with all timeframes
• Works on all instruments (Forex, Stocks, Crypto, Commodities)
How to Use
1. Trend Identification: All EMAs aligned = Strong trend
2. Support/Resistance: EMAs act as dynamic support/resistance levels
3. Entry Signals: Price reactions at key EMAs
4. Trend Confirmation: EMA crossovers indicate potential trend changes
5. Risk Management: Use EMAs for stop-loss placement
Best Practices
• Use higher timeframes (1H, 4H, Daily) for clearer signals
• Combine with price action and volume analysis
• Watch for EMA clusters and divergences
• Consider trend strength by EMA separation
Perfect For
✓ Swing Traders
✓ Day Traders
✓ Trend Followers
✓ Scalpers (shorter timeframes)
✓ Position Traders
Technical Specifications
• Version: Pine Script v6
• Overlay: Yes
• Multi-timeframe compatible
• No repainting
• Lightweight and efficient
This indicator is part of the Thought Magic Trading collection, designed to provide professional-grade technical analysis tools for serious traders.
Happy Trading! 📈
TRADING DISCLAIMER
RISK WARNING
Trading involves substantial risk of loss and is not suitable for all investors. Past performance is not indicative of future results. You should carefully consider whether trading is suitable for you in light of your circumstances, knowledge, and financial resources.
NO FINANCIAL ADVICE
This indicator is provided for educational and informational purposes only. It does not constitute:
* Financial advice or investment recommendations
* Buy/sell signals or trading signals
* Professional investment advice
* Legal, tax, or accounting guidance
LIMITATIONS AND DISCLAIMERS
Technical Analysis Limitations
* Pivot points are mathematical calculations based on historical price data
* No guarantee of accuracy of price levels or calculations
* Markets can and do behave irrationally for extended periods
* Past performance does not guarantee future results
* Technical analysis should be used in conjunction with fundamental analysis
Data and Calculation Disclaimers
* Calculations are based on available price data at the time of calculation
* Data quality and availability may affect accuracy
* Pivot levels may differ when calculated on different timeframes
* Gaps and irregular market conditions may cause level failures
* Extended hours trading may affect intraday pivot calculations
Market Risks
* Extreme market volatility can invalidate all technical levels
* News events, economic announcements, and market manipulation can cause gaps
* Liquidity issues may prevent execution at calculated levels
* Currency fluctuations, inflation, and interest rate changes affect all levels
* Black swan events and market crashes cannot be predicted by technical analysis
USER RESPONSIBILITIES
Due Diligence
* You are solely responsible for your trading decisions
* Conduct your own research before using this indicator
* Verify calculations with multiple sources before trading
* Consider multiple timeframes and confirm levels with other technical tools
* Never rely solely on one indicator for trading decisions
Risk Management
* Always use proper risk management and position sizing
* Set appropriate stop-losses for all positions
* Never risk more than you can afford to lose
* Consider the inherent risks of leverage and margin trading
* Diversify your portfolio and trading strategies
Professional Consultation
* Consult with qualified financial advisors before trading
* Consider your tax obligations and legal requirements
* Understand the regulations in your jurisdiction
* Seek professional advice for complex trading strategies
LIMITATION OF LIABILITY
Indemnification
The creator and distributor of this indicator shall not be liable for:
* Any trading losses, whether direct or indirect
* Inaccurate or delayed price data
* System failures or technical malfunctions
* Loss of data or profits
* Interruption of service or connectivity issues
No Warranty
This indicator is provided "as is" without warranties of any kind:
* No guarantee of accuracy or completeness
* No warranty of uninterrupted or error-free operation
* No warranty of merchantability or fitness for a particular purpose
* The software may contain bugs or errors
Maximum Liability
In no event shall the liability exceed the purchase price (if any) paid for this indicator. This limitation applies regardless of the theory of liability, whether contract, tort, negligence, or otherwise.
REGULATORY COMPLIANCE
Jurisdiction-Specific Risks
* Regulations vary by country and region
* Some jurisdictions prohibit or restrict certain trading strategies
* Tax implications differ based on your location and trading frequency
* Commodity futures and options trading may have additional requirements
* Currency trading may be regulated differently than stock trading
Professional Trading
* If you are a professional trader, ensure compliance with all applicable regulations
* Adhere to fiduciary duties and best execution requirements
* Maintain required records and reporting
* Follow market abuse regulations and insider trading laws
TECHNICAL SPECIFICATIONS
Data Sources
* Calculations based on TradingView data feeds
* Data accuracy depends on broker and exchange reporting
* Historical data may be subject to adjustments and corrections
* Real-time data may have delays depending on data providers
Software Limitations
* Internet connectivity required for proper operation
* Software updates may change calculations or functionality
* TradingView platform dependencies may affect performance
* Third-party integrations may introduce additional risks
MONEY MANAGEMENT RECOMMENDATIONS
Conservative Approach
* Risk only 1-2% of capital per trade
* Use position sizing based on volatility
* Maintain adequate cash reserves
* Avoid over-leveraging accounts
Portfolio Management
* Diversify across multiple strategies
* Don't put all capital into one approach
* Regularly review and adjust trading strategies
* Maintain detailed trading records
FINAL LEGAL NOTICES
Acceptance of Terms
* By using this indicator, you acknowledge that you have read and understood this disclaimer
* You agree to assume all risks associated with trading
* You confirm that you are legally permitted to trade in your jurisdiction
Updates and Changes
* This disclaimer may be updated without notice
* Continued use constitutes acceptance of any changes
* It is your responsibility to stay informed of updates
Governing Law
* This disclaimer shall be governed by the laws of the jurisdiction where the indicator was created
* Any disputes shall be resolved in the appropriate courts
* Severability clause: If any part of this disclaimer is invalid, the remainder remains enforceable
REMEMBER: THERE ARE NO GUARANTEES IN TRADING. THE MAJORITY OF RETAIL TRADERS LOSE MONEY. TRADE AT YOUR OWN RISK.
Contact Information:
* Creator: Hitesh_Nimje
* Phone: Contact@8087192915
* Source: Thought Magic Trading
© HiteshNimje - All Rights Reserved
This disclaimer should be prominently displayed whenever the indicator is shared, sold, or distributed to ensure users are fully aware of the risks and limitations involved in trading.

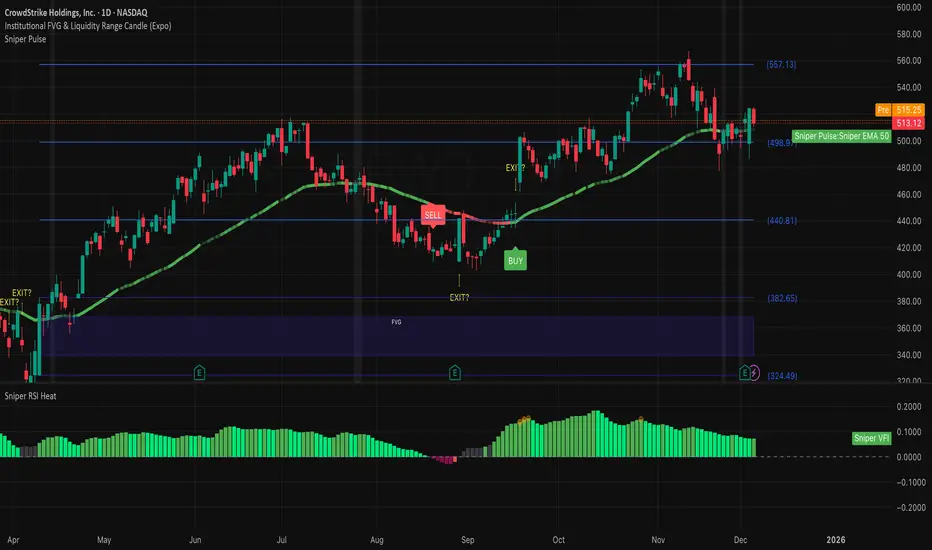
Sniper VFI: Institutional Breakout & HeatmapDescription:
Overview This is a professional-grade momentum indicator designed to track Institutional Smart Money flow while filtering for high-probability breakout setups. It combines volume analysis, trend filtration, and price action triggers into a single dashboard.
How It Works The indicator operates on a three-step validation process:
Trend Filter: Uses a 150 EMA to define the major trend. Long positions are only permitted above the 150 EMA, and Short positions only below it.
Institutional Volume (VFI): Analyzes the Volume Flow Indicator to ensure Smart Money is participating in the move.
Micro-Breakout Trigger: Signals are only generated if the price breaks the High (for Longs) or Low (for Shorts) of the last 3 candles, ensuring immediate momentum.
Visual Guide & Legend
The Histogram (Volume & Momentum):
Bright Lime: Strong Bullish Impulse. Institutional money is flowing in, and momentum is accelerating.
Dark Green: Stable Uptrend. The trend is healthy.
Bright Red: Strong Bearish Impulse. Institutional money is flowing out, and downside momentum is accelerating.
Maroon: Stable Downtrend.
The Heatmap Tips (RSI Temperature):
Orange Tips: Overbought Warning (RSI > 70). The asset is heating up; caution is advised for new long entries. The opacity increases as RSI approaches 100.
White Tips: Oversold Warning (RSI < 30). The asset is extended to the downside.
The Signals (L/S):
L (Long): Confirmed entry. Trend is Up + VFI Positive + Price broke the recent 3-candle High.
S (Short): Confirmed entry. Trend is Down + VFI Negative + Price broke the recent 3-candle Low.
Note: This tool includes an alternating signal filter to prevent repetitive signals during trends. A Long signal will not repeat until a Short signal or a trend reset occurs.

Alinin Sihirli Lambası v4.0 [AliBaba]This is not investment advice.
It works with 80% success in a 15-minute period and provides buy and sell signals.
It has been tested on SKL OP XTZ ALT VTHQ 100 CHEMS ZEC LUNC.
When the green vertical bar appears, if it is at least 2% below the upper pink line and institutional buying exceeds institutional selling (upper right window).
If you are a TradingView premium member, and the upper target is closer than the lower target, the best buy point is indicated.
The default profit and risk ratio is 2 to 1.5. You can try changing it.
A signal is generated by reprocessing the best indicators and considering general institutional buying and selling pressures.

VSA MTF Dashboard OXEVSA Multi-Timeframe Dashboard
The VSA Multi-Timeframe Dashboard is a professional Volume Spread Analysis (VSA) scanner that detects institutional trading patterns across Daily, H4, and H1 timeframes simultaneously. It identifies when "smart money" (banks, hedge funds, institutions) is accumulating, distributing, or manipulating price, giving you an edge to trade with—not against—the professionals.
Price spread (high to low range)
Volume (trading activity)
Closing price (where the battle ended)
Core Principle: By reading volume and price action together, you can see what smart money is doing before retail traders catch on.The 7 VSA Patterns Detected
🟢 BULLISH PATTERNS (Buy Signals)PatternWhat It Looks LikeWhat It MeansWeightStopping VolumeDown bar + Ultra high volume + Close near highSmart money absorbing panic selling at lows. Strong reversal signal.+10SpringPrice makes new low, then closes back inside rangeLiquidity sweep below support. Bear trap - institutions buying cheap.+9No SupplyDown bar + Low volume + Narrow spreadNo selling pressure from professionals. Supply dried up.+8
🔴 BEARISH PATTERNS (Sell Signals)PatternWhat It Looks LikeWhat It MeansWeightUpthrustPrice makes new high, then closes back inside rangeLiquidity sweep above resistance. Bull trap - institutions selling high.-9No DemandUp bar + Low volume + Narrow spreadNo buying interest from professionals. Weakness at tops.-6
🟡 CONTEXT-DEPENDENT PATTERNSPatternWhat It Looks LikeWhat It MeansWeightClimactic ActionExtreme volume + Wide spreadExhaustion move. Buying climax = bearish. Selling climax = bullish.±7-8Effort vs ResultHigh volume + Narrow spreadSmart money absorption. High effort, little result = hidden weakness/strength.±7How to Read the DashboardTop Section: Current Market State┌──────────────────────────────┐
│ VSA Scanner │
├────┬──────────┬─────┬────────┤
│ TF │ Pattern │ Dir │ Pts │
├────┼──────────┼─────┼────────┤
│ D │ Upthrust │ ↓ │ -27 │ ← Daily trend
│ H4 │ No Supply│ ↑ │ +16 │ ← 4-hour trend
│ H1 │ Spring │ ↑ │ +9 │ ← 1-hour trend
├────┴──────────┴─────┴────────┤
│ ↑ 52% MODERATE BULLISH │ ← OVERALL BIAS
└──────────────────────────────┘Reading the signals:
TF (Timeframe): D = Daily, H4 = 4-hour, H1 = 1-hour
Pattern: Which VSA pattern is detected
Dir (Direction): ↑ = Bullish, ↓ = Bearish
Pts (Points): Weighted score (Daily = 3x, H4 = 2x, H1 = 1x)
Bottom Row = Aggregate Score:
0-50%: WEAK bias
50-75%: MODERATE bias
75-100%: STRONG bias
Bottom Section: Pattern ReferenceQuick reference guide showing all 7 patterns, their detection criteria, bias, and meaning. Always visible for learning.Trading Guidelines✅ HIGH PROBABILITY SETUPS1. Strong Confluence (75%+ Score)
All 3 timeframes aligned in same direction
Action: Aggressive entry in signal direction
Example: Daily Spring + H4 No Supply + H1 Spring = 85% BULLISH → BUY
2. HTF Dominance
Daily and H4 agree, H1 disagrees
Action: Trade with Daily/H4 bias (higher timeframes win)
Example: Daily/H4 bearish, H1 bullish → Wait for H1 to flip bearish, then SELL
3. Spring/Upthrust on Daily
Strongest reversal signals (liquidity sweeps)
Action: Major reversal trade opportunity
Example: Daily Spring after downtrend = significant bottom forming
⚠️ CAUTION ZONES1. Mixed Signals (30-50% Score)
Timeframes conflict
Action: WAIT for alignment or reduce position size
Example: Daily bullish, H4 bearish, H1 bullish = choppy, avoid
2. No Patterns Detected
All timeframes show "-"
Action: Market consolidating, wait for setup
3. Weak Bias (Below 50%)
Low conviction signals
Action: Scalp only or sit out
❌ AVOID
Trading against Daily timeframe (Daily always wins long-term)
Entering during mixed signals
Ignoring No Demand/No Supply (early distribution/accumulation warnings)
Indicator SettingsEssential Settings:SettingDefaultRecommendationDashboard PositionTop RightAdjust to avoid blocking chartLight ModeONTurn OFF if using dark chartsColor CandlesONKeep ON for visual pattern recognitionShow Candle LabelsOFFTurn ON if learning (shows UT, SPR, etc.)Volume Average Length20Don't change unless very experiencedATR Length14Standard setting, leave as isBest PracticesFor Swing Trading (Daily/H4):
Focus on Daily and H4 patterns (ignore H1)
Enter when both align
Use H4 Spring/Upthrust for precise entries
Target: Major support/resistance zones
For Day Trading (H4/H1):
Check Daily bias first (trade WITH it)
Use H4 for trend, H1 for entries
Enter on H1 Spring/Upthrust in direction of H4
Target: Intraday highs/lows
For Scalping (H1 only):
Only trade when H1 shows 70%+ score
Quick entries on Spring/Upthrust
Tight stops (10-15 pips on XAUUSD)
Target: 2:1 risk/reward minimum
Common QuestionsQ: Why does the score change when I switch timeframes?
A: The "bars ago" metric counts in your current chart timeframe. The pattern and bias remain the same, just the time reference changes. Focus on the pattern name and direction, not bars ago.Q: Can patterns repaint?
A: NO. Patterns only confirm after bar close. The dashboard shows live but patterns are stable.Q: What if Daily is bearish but H1 is bullish?
A: Daily ALWAYS wins. The H1 bullish move is likely a pullback in a bearish trend. Wait for H1 to flip bearish for best entries.Q: Should I trade every signal?
A: NO. Only trade when:
Score is 70%+ (strong conviction)
Multiple timeframes align
Pattern makes sense with overall trend
Q: How often do patterns appear?
A: Variable. You might see 2-5 signals per week on Daily, more frequently on H1. Quality over quantity.Quick Reference CardBULLISH SIGNALS TO BUY:
✅ Stopping Volume (strongest)
✅ Spring (liquidity grab)
✅ No Supply (weakness gone)
✅ Score: 70%+ BULLISH
BEARISH SIGNALS TO SELL:
✅ Upthrust (liquidity grab)
✅ No Demand (strength gone)
✅ Climactic Buying (exhaustion)
✅ Score: 70%+ BEARISH
STAY OUT:
❌ Mixed signals (30-50%)
❌ No patterns detected
❌ Timeframes conflicting
Example Trade SetupsPerfect Long Setup:
Daily: Spring ↑ +27 (Liquidity sweep)
H4: No Supply ↑ +16 (No sellers)
H1: Stopping Vol ↑ +10 (Absorption)
Score: 88% STRONG BULLISH
Action: BUY aggressively, target major resistancePerfect Short Setup:
Daily: Upthrust ↓ -27 (Liquidity trap)
H4: No Demand ↓ -12 (No buyers)
H1: Upthrust ↓ -9 (Fake breakout)
Score: 80% STRONG BEARISH
Action: SELL aggressively, target major supportAvoid This Setup:
Daily: No Supply ↑ +24 (Bullish)
H4: Upthrust ↓ -16 (Bearish)
H1: No Demand ↓ -6 (Bearish)
Score: 3% WEAK BULLISH (Mixed!)
Action: WAIT - Conflicting signals

Buy and Sell With AI - 3.0
Buy and Sell AI – 3.0
**Overview**
**Buy and Sell AI – 3.0** is an educational technical indicator designed to help traders structure entries, stop-loss and target planning, risk management, and multi-timeframe trend reading in one place. It does **not** place trades or guarantee profit; it simply visualizes rules you configure yourself.
The script supports different trading styles (Scalping/Intraday, Swing, Positional) and adapts its internal filters accordingly. Signals are shown as shapes on the chart (B/S for main signals, B1/S1 for standalone), with optional retest and reversal markers for conservative or loss-recovery–style approaches.
**Key Features**
* **Signal Generation**: Filtered buy/sell signals using a combination of trend, momentum and volume conditions (including moving averages, RSI-style noise reduction, ADX trend strength and volume surge/breakout checks).
* **Risk & Execution Tools**: Automatically draws entry, SL and up to three RR-based TP levels (1:1, 1:2, 1:3 style), with optional position-size guidance based on account size and risk % per trade. Supports stocks, forex, crypto, indices and commodities through an asset-type and point-value framework, plus an optional ITM strike helper for options.
* **Enhancements**: Gap-avoidance filter, optional retest-based conservative entries, and optional reversal signals on failed trades with a daily cap.
* **Visuals & Trend Meter**: Customizable lines and labels (colors, widths, positions, font sizes), plus a simple higher-timeframe trend meter (e.g., Daily/Weekly/Monthly) and a “smart rebalancer” reference line for positional or investment-style monitoring.
* **Alerts**: Flexible alert system for all major signal types (B, S, B1, S1 and reversal events), with a master on/off switch and per-type toggles.
**Input Settings (Summary)**
* **Disclaimer**: Mandatory checkbox to enable (educational use only; no liability).
* **Trading Style & Filters**: Choose Scalping/Intraday, Swing or Positional; toggle AI trend filter, RSI-based noise filter, volume/momentum filter and ADX trend filter.
* **Volume & Advanced Controls**: Configure volume breakout/surge periods and multipliers, reversal signals (1:1 / 1:2, max reversals per day), retest labels and gap threshold %.
* **Asset & Risk Management**: Auto or manual asset type (Stock/Forex/Crypto/Index/Commodity), account size, risk % per trade, SL mode (entry or previous candle), optional manual point values for indices and strike interval for options.
* **Display & Trend Meter**: Settings for entry/SL/TP lines and labels, position size/points/% display, trend meter table position and selected higher timeframes.
**Usage & Legal Note**
Apply it to any symbol and timeframe, then customize the inputs to fit your own trading or study style. This indicator is strictly for **educational and informational purposes only**. It is **not** financial advice, a signal service, or a portfolio management tool. Trading and investing involve substantial risk, and you may lose part or all of your capital. Past performance is not a guarantee of future results. The creator is **not** a SEBI-registered investment advisor. By using this script, you confirm that you understand these risks and accept full responsibility for your own decisions and outcomes.

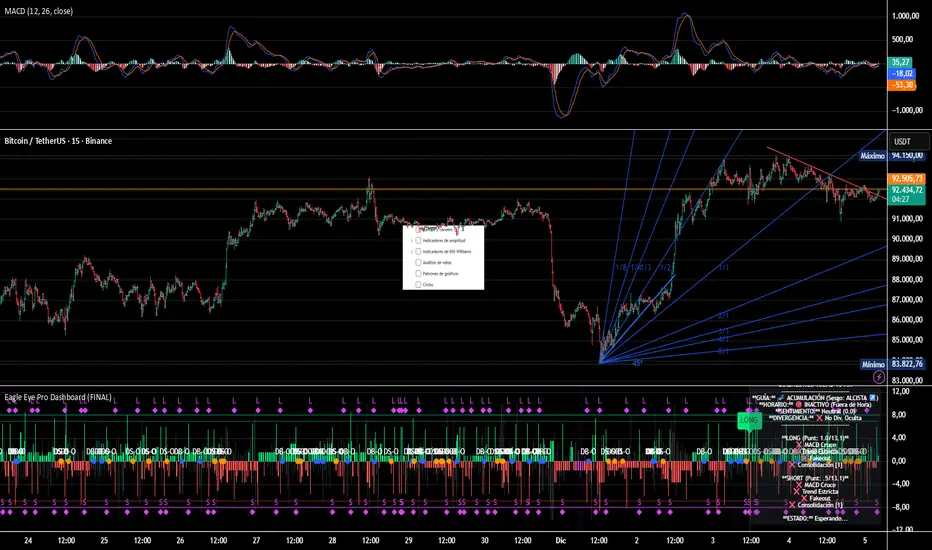
Eagle Eye Pro Dashboard 🔴 IMPORTANT NOTICE
This indicator is an advanced trading support tool. It helps you spot opportunities and improve your analysis, but it DOES NOT guarantee results nor replace your personal judgment.
• 🔴 Every trade remains your sole responsibility.
• 🔴 Risk is always present: the indicator does not eliminate it, only helps manage it.
• 🔴 The indicator is restricted: it ONLY generates signals during the London and New York sessions.
• 🔴 It does not generate signals outside those sessions or during weekends, to ensure better accuracy and performance.
• 🔴 It is not recommended to trade other assets or use timeframes different from those specified.
EAGLE EYE PRO V71.2 RENTAL
This indicator is built to deliver clear signals and a professional dashboard, specially optimized for BTC.
🔑 Key highlights:
• 🔴 Exclusively optimized for BTC.
• 🔴 Recommended timeframe: 15 minutes, providing cleaner and more reliable signals.
• 🔴 Adventurous mode: 1 minute, but with higher risk due to extreme volatility.
• 🔴 Restricted hours: the indicator works only during the London and New York sessions.
• 🔴 It does not operate during weekends
Multi-TF Candle Gap DetectorHigh timeframe gap detector, these work well to identify key levels to trade from

Prev Day VAH / VAL / POC“Prev Day VAH / VAL / POC” gives you previous-session value levels (POC, VAH, VAL) as clean horizontal lines + labels — no bulky histograms, no unnecessary clutter.
Works on any timeframe, with options to customize line color, width, style and label appearance.
Ideal for traders who value simplicity, clarity, and quick reference.
What it does:
• Calculates prior-session POC, VAH and VAL from chart volume data
• Projects these levels forward into the current session for easy reference
• Labels include price value for instant clarity
Why it’s useful:
• Great for setup-based traders who monitor how price reacts to prior-session structure
• Lightweight and fast — minimal CPU/visual overhead
• Fully customizable to fit your personal chart style; works on intraday and higher-timeframe charts
Note: This is a reference tool, not a signal indicator. Use it as a structural guide — incorporate with your own analysis.

20-Day VW Initial Balance (Simple) – Fixed & ProThis Pine Script calculates and displays a Volume-Weighted Initial Balance (VW-IB) for the New York trading session, and also computes a 20-day average Initial Balance range. It then plots both the current IB and the historical average IB band on the chart.
The script adapts the Initial Balance window using volume, rather than a fixed time, to better reflect true market participation.

Enhanced VolumeEnhanced Volume allows you to show multiple highlights on your volume:
HVE - Highest Volume Ever
HV1 - Highest Volume in 1 Year
Volume Average Moving Average
Projected Volume - Shows the projected volume based on the time of the bar left
2x and 3x volume bars. Shows to bars of where the volume needs to hit to be 2 or 3x above average
Color coding of low volume bars and high volume bars
Up/Down Volume
% Change

Pivot automatic by GaryIn recent years, I have been exposed to concepts such as order block and fair value gap, which have gained significant popularity. However, I believe that traditional support and resistance levels based on swing highs and lows still hold certain practical value. In particular, support and resistance on higher timeframes play a crucial role in our technical analysis. The traditional principle of support-resistance flip remains valid, and higher timeframe support/resistance levels provide a more systematic framework for analysis. In contrast, the definitions of order block and fair value gap are overly vague; they are often decoupled from market trends, generate numerous false signals, and are thus difficult to apply effectively in practice.
## Pivot Automatic V4 Indicator
An intelligent support and resistance zone identification tool with the following core features:
**🎯 Auto Timeframe Detection**
- Automatically selects appropriate higher timeframes based on current chart period
- No manual adjustment needed, adapts to different trading styles
**📊 Key Features**
- **Support/Resistance Zones**: Auto-identifies and draws HTF pivot high/low zones
- **Touch Alerts**: Real-time alerts for first touch, re-touch, and breakout of zones
- **High Volume Detection**: Marks price areas with exceptional volume
- **Session Filtering**: Configurable trading session analysis
**💡 Practical Features**
- Customizable zone colors and transparency
- Multiple alert types (touch/breakout/retest)
- Detailed price information tooltips
- Auto-extends active zones, cleans broken zones
Perfect for traders to identify key price levels and improve entry/exit timing accuracy across all timeframes.

Volume SMA (StevenCharts)The Volume SMA (StevenCharts) is a streamlined volume analysis tool designed to help traders instantly identify significant market activity.
Standard volume bars can be noisy and difficult to interpret in isolation. This indicator normalizes volume relative to its recent average, highlighting only the bars that carry statistical significance. It separates "smart money" activity from retail noise by color-coding volume based on a user-defined threshold relative to the Moving Average.
How It Works
The indicator calculates a Simple Moving Average (SMA) of the volume (default 20 periods) and compares the current real-time volume against this baseline.
High Relative Volume: If the current volume exceeds the SMA by your set multiplier (e.g., 1.5x or 2.0x), the bar lights up in Green (for bullish closes) or Red (for bearish closes).
Low/Average Volume: If the volume is below the threshold, the bar remains Gray. This helps you ignore low-conviction price action.
Key Features
Threshold Filtering: Easily adjust the "Volume Multiplier" to define what you consider "high volume." Set it to 1.5 to spot bars with 150% of the average volume, or 2.0 for extreme outliers.
Visual Clarity: Automatically greys out insignificant volume, drawing your eye immediately to institutional activity.
Dual-Plot System: Displays standard volume bars alongside the SMA line for context.
Settings
Show Volume SMA: Toggles the blue SMA line on/off.
Volume SMA Length: The lookback period for the average (Default: 20).
Volume Multiplier Threshold: The factor required to trigger the colored highlight.
Example: Setting this to 1.0 means any volume above the average is colored. Setting it to 2.0 means only double-the-average volume is colored.

A.I. 👑 Optimus Prime [RubiXalgo]**A.I. Optimus Prime – The Ultimate Color-Coded AI Trading Indicator**
No equations. No guesswork. Just traffic lights for trading.
🔥 Green = BUY / Long
🔥 Red = SELL / Short
🔥 Yellow = Wait & Watch
Powered by real AI & Machine Learning (Kalman Filters + LOWESS + k-NN + adaptive coloring), this indicator turns complex price & volume data into an instantly readable visual system that works on any market and any timeframe.
### What You Get on Your Chart
- Fast & Slow AI Trend Lines (green = uptrend, red = downtrend)
- Liquidation Window™ – exact stop-loss (red), entry, and 3 take-profit levels (circle → diamond → star)
- Volume Profit-Trend Line – curved AI prediction of next price move
- Dynamic Volume Profile Channel – shows real high-volume support/resistance zones
- Multi-Timeframe Average Lines + Trend Direction Table
- Gradient Candle Coloring + Big Target Dot on last bar
- Speed-Lane fill between fast/slow lines
- Everything fully customizable & toggleable
### Top High-Probability Setups Built In (3:1+ RR)
Longs:
1. Bullish Liquidation Bounce
2. Green Trend Breakout
3. Volume Support Surge
Shorts:
1. Bearish Liquidation Drop
2. Red Trend Breakdown
3. Volume Resistance Fade
Just wait for the colors to align and execute – the indicator does the thinking for you.
### Why Traders Are Switching to A.I. Optimus Prime
✅ 100% visual – perfect for beginners (“green = buy”)
✅ Deadly accurate in expert hands (confluence of trend + volume + liquidation zones)
✅ Adapts automatically to current market volatility
✅ Saves accounts with precise stop-loss & target zones
✅ One indicator replaces 10+ traditional tools
Green window + green volume trend + green fast line = LONG
Red window + red volume trend + red fast line = SHORT

Range Lattice## RangeLattice
RangeLattice constructs a higher-timeframe scaffolding on any intraday chart, locking in structural highs/lows, mid/quarter grids, VWAP confluence, and live acceptance/break analytics. It provides a non-repainting overlay that turns range management into a disciplined process.
HOW IT WORKS
Structure Harvesting – Using request.security() , the script samples highs/lows from a user-selected timeframe (default 240 minutes) over a configurable lookback to establish the dominant range.
Grid Construction – Midpoint and quarter levels are derived mathematically, mirroring how institutional traders map distribution/accumulation zones.
Acceptance Detection – Consecutive closes inside the range flip an acceptance flag and darken the cloud, signaling balanced auction conditions.
Break Confirmation – Multi-bar closes outside the structure raise break labels and alerts, filtering the countless fake-outs that plague breakout traders.
VWAP Fan Overlay – Session VWAP plus ATR-based bands provide a live measure of flow centering relative to the lattice.
HOW TO USE IT
Range Plays : Fade taps of the outer rails only when acceptance is active and VWAP sits inside the grid—this is where mean-reversion works best.
Breakout Plays : Wait for confirmed break labels before entering expansion trades; the dashboard's Width/ATR metric tells you if the expansion has enough fuel.
Market Prep : Carry the same lattice from pre-market into regular trading hours by keeping the structure timeframe fixed; alerts keep you notified even when managing multiple tickers.
VISUAL FEATURES
Range Tap and Mid Pivot markers provide a tape-reading breadcrumb trail for journaling.
Cloud fill opacity tightens when acceptance persists, visually signaling balance compressions ready to break.
Dashboard displays absolute width, ATR-normalized width, and current state (Balanced vs Transitional) so you can glance across charts quickly.
Acceptance Flag toggle: Keep the repeated acceptance squares hidden until you need to audit balance.
PARAMETERS
Structure Timeframe (default: 240): Choose the timeframe whose ranges matter most (4H for indices, Daily for stocks).
Structure Lookback (default: 60): Bars sampled on the structure timeframe.
Acceptance Bars (default: 8): How many consecutive bars inside the range confirm balance.
Break Confirmation Bars (default: 3): Bars required outside the range to validate a breakout.
ATR Reference (default: 14): ATR period for width normalization.
Show Midpoint Grid (default: enabled): Display the midpoint and quarter levels.
Show Adaptive VWAP Fan (default: enabled): Toggle the VWAP channel for assets where volume distribution matters most.
Show Acceptance Flags (default: disabled): Turn the acceptance markers on/off for maximum visual control.
Show Range Dashboard (default: enabled): Disable if screen space is limited, re-enable during prep sessions.
ALERTS
The indicator includes five alert conditions:
Range High Tap: Price interacted with the RangeLattice high
Range Low Tap: Price interacted with the RangeLattice low
Range Mid Tap: Price interacted with the RangeLattice mid
Range Break Up: Confirmed upside breakout
Range Break Down: Confirmed downside breakout
Where it works best
This indicator works best on liquid instruments with clear structural levels. On very low timeframes (1-minute and below), the structure may update too frequently to be useful. The acceptance/break confirmation system requires patience—faster traders may find the multi-bar confirmation too slow for scalping. The VWAP fan is session-based and resets daily, which may not suit all trading styles.

SDFADE nuvolébasic script to signal mean reversions and alert fades when stretched to +/-2.5VWAP Standard Deviation

VWAP 1SD 2SD yasurferThis custom intraday indicator is designed to provide a detailed understanding of market equilibrium, volatility expansion, and trend structure by combining Session VWAP, Standard Deviation bands, and multi-timeframe EMAs. The script calculates cumulative volume-weighted price data throughout the trading day and automatically resets at the start of each new session. This ensures that the Session VWAP reflects only current-day trading activity, making it highly relevant for scalpers, day traders, and intraday swing setups.
The ±2 Standard Deviation bands illustrate where price is statistically stretched. These zones often act as areas of exhaustion, liquidity grabs, or potential momentum continuation points. By tracking variance around VWAP, the indicator helps traders quickly identify whether price is trading within a normal distribution or pushing into extreme territory.
A dynamic label displays the real-time percentage distance from VWAP, allowing traders to assess how far price has deviated from fair value. This is particularly useful for identifying overextended moves, mean-reversion opportunities, or breakout conditions.
The addition of EMA 50, EMA 200, and EMA 325 provides structural trend context—helping traders evaluate higher-timeframe alignment and potential confluence with VWAP levels. Overall, this indicator enhances clarity, timing, and decision-making by blending statistical tools with traditional trend analysis.

VWAP + EMA9 + RSI Scalping (Edu)VWAP + EMA9 + RSI Scalping (Edu) is an intraday scalping indicator combining VWAP, EMA9 and RSI to identify high-probability long and short entries. Designed for low timeframes (1m–5m), it aligns micro-trend and momentum to generate clean and fast setups. Works on stocks, indices, forex and crypto.

Institutional VWAP Suite (Lite Compatible)The **Institutional VWAP Suite (Lite Compatible)** brings true institutional volume-weighted price analysis to every trader — even on TradingView Lite/Free accounts where standard VWAP tools are restricted.
This script recreates the most important VWAP models used by banks, funds, and high-frequency desks, including:
• **Daily VWAP** (exchange-accurate)
• **Weekly VWAP** (manually accumulated)
• **Monthly VWAP** (manually accumulated)
• **Rolling Window VWAP** (array-based, fully Lite-compatible)
All calculations avoid blocked functions like `ta.sum` or session-restricted VWAP calls. Everything is built manually from volume and price to ensure accuracy across all accounts and all markets.
### Features
• Multi-timeframe VWAPs (Daily/Weekly/Monthly)
• Manual Rolling VWAP with adjustable length
• Optional VWAP bands (Lite-safe)
• Clean visuals with color-coded levels
• Optimized arrays for fast, stable performance
• Free-tier compatible — no premium functions required
This tool is designed for traders who want institutional structure, premium-level VWAP calculations, and consistent execution regardless of plan level. Perfect for scalpers, day traders, futures traders, and anyone who uses intraday volume profiles.
### Recommended Use
• Map directional bias using Daily vs Weekly VWAP
• Use Monthly VWAP for macro trend context
• Track intraday mean reversion with Rolling VWAP
• Use VWAP bands as dynamic support/resistance zones
A simple, powerful, no-restrictions VWAP engine — built for everyone.
