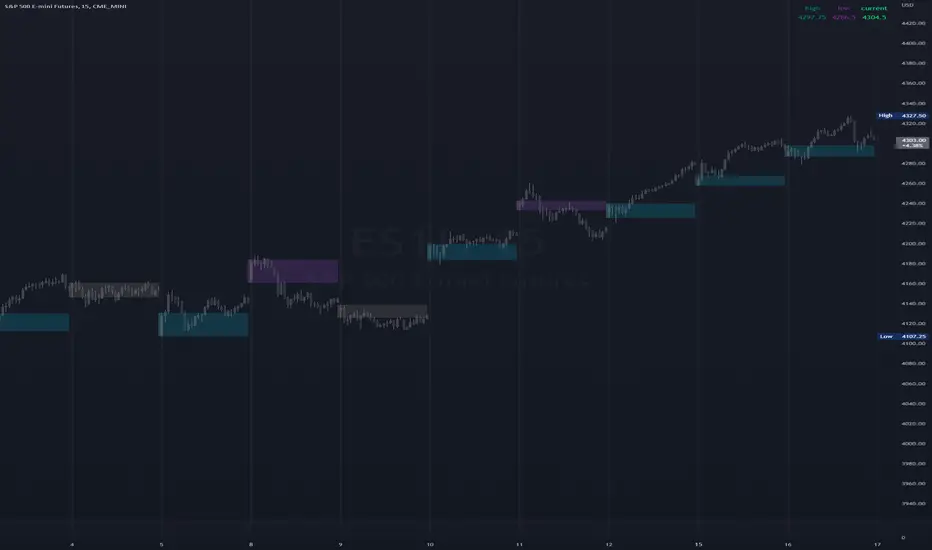
High & Low Of Custom SessionThis script boxes a custom session and sets the box at the high and low of the session and draws that box to the next session.
Box color is determined by price in relation to the box position. Box color is set at the start of the next session. This allows
user to lookback at multiple box sets to see how each day closed in relation to the session highlighted.
I have written this for backtesting purposes and intend to expand it to use with volume analysis and gradient color to change the box color based on how many times price tests
the box.
Volumepriceanalysis
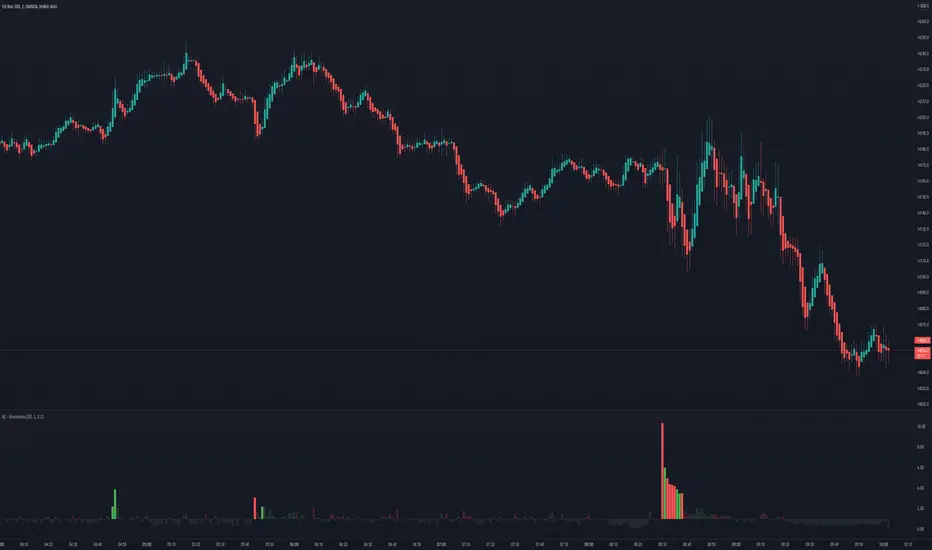
Volume Risk Avoidance IndicatorPrice Pattern Analysis is the core of trading. But price patterns often fails.
VRAI (Volume Risk Avoidance Indicator) shows Volume Pressure, so that you can avoid volume-based risks.
For example, never short when you see green (buying pressure). Never long when you see red (selling pressure).
You still need to pick good price patterns, because the crossover of volume pressure is not reliable.
Enjoy!

Money Flow LineWhat is this? The Money Flow Line (MFL) indicator is at its core a more even-tempered version of the Price-Volume-Trend (PVT). The primary difference is the usage of `hlc3` ((high + low + close) / 3) rather than `close` to use the "typical price" that it critical to the calculation of the Money Flow Index (MFI). Other similar indicators include the Accumulation Distribution Line (ADL) and the On Balance Volume (OBV) indicators. The purpose of all of these indicators is to attempt to measure the strength of the money flow by combining price and volume into a rolling measurement that can be compared over time to look for confirmations and divergences.
The indicator also includes an optional averaging (smoothing) line that can be enabled in the display settings. Enabling this smoothing line with a desired period allows for simpler trend comparisons and also allows the user to view how far the line has diverged from the mean. This creates an indicator very similar to Elder's Force Index (EFI), which is also a `close * volume` style indicator.
Why is this important? After an extreme movement or volume spike the MFI will "snap back" sharply as that bar eventually exits the set period. This produces a result that is meaningless and skews the indicator away from the market structure. Because of this behavior, range clamping, and the loss of comparative history I prefer to shy away from oscillator style indicators. The Money Flow Line instead gives you all of the history so you may compare and see the broader trend without sharp snaps in history based on an arbitrary period setting.
Why is this better? This produces a no-lag indicator that isn't subject to the harsh skewing produced by they Money Flow Index's period calculation. It doesn't lose history like MFI or EFI, is clear about the trend direction, and prefers a "typical price" (averaging the entire range of each bar) rather than whatever happens to be the closing price for a given bar.
How can I use it? The indicator is attempting to measure supply and demand in the markets. No indicator is perfect, but we can use all of the information we have available to make our best predictions. There are only 3 pieces of data the market gives us:
1. Price (action)
2. Volume
3. Time
The Money Flow Line combines all of these data points into a readable rolling data set that attempts to show subtle balance of power shifts based on changes in volume and "smart money" (or "big money") stepping in and out of the picture. Much like PVT, we look for the same things:
- Trend Identification: an up or down trend appears in the MFL
- Confirmations: the MFL agrees with price action in direction and magnitude
- Divergence: the MFL disagrees with price action, indicating a reversal may be coming soon
When applying the smoothing line we can also look for similar things we would with EFI. The primary case would be to look for the MFL to jump very far away from the mean (a high magnitude movement) which indicates that price may be reverting towards the mean soon (a "mean reversion"). On the other hand, it may indicate strength in the current price direction. All of these predictions depend heavily on price action and market structure. Good luck!

Nifty & BN 2 Candle Theory Back Testing and Alert Notification How To Initiate Long Trade-in Index Future/ Buy Call Options – 3 Min TF
▪ If The Index Futures Trades Above The VWAP, the Following Parameters are Checked For 2 Candle Theory on the long side
▪ RSI Trades Above 50 & Between 50-75/80
▪ Volume Of 2 Consecutive Bars Is Above 50 K for BN & 125 K For Nifty
▪ All the indicators (Parabolic SAR, Super Trend, VMA, VWAP) Below the Candles
▪ When the above conditions are met enter In 3rd Candle, With 1st Candle High As SL
How I Initiate Short Trade-In Index Future/ Buy Put Options – 3 Min TF
▪ If The Index Futures Trades Below The VWAP, the Following Parameters are Checked For 2 Candle Theory on the short side
▪ RSI Trades Below 40 & Between 40-25/20
▪ Volume Of 2 Consecutive Bars Is Above 50 K for BN & 125 K For Nifty
▪ All the Indicators (Parabolic SAR, Super Trend, VMA, VWAP) Above The Candles
▪ When the above conditions are met enter In 3rd Candle, With 1st Candle High As SL
The indicator checks the above and notifies to enter a long trade and short trade respectively. There is also volume cutoff and change in the volumes respectively, also non-trading times that can be set.

bullratioLibrary "bullratio"
Calculate the profit/loss ratio of a permabull for configurable time range
bullratio(len)
calculates the profit/loss ratio for a permabull of age len
Parameters:
len : the number of candles to include in the running bull ratio - 0 for all time
Returns: series float of profit/loss percentage

Bogdan Ciocoiu - MakaveliDescription
This indicator integrates the functionality of multiple volume price analysis algorithms whilst aligning their scales to fit in a single chart.
Having such indicators loaded enables traders to take advantage of potential divergences between the price action and volume related volatility.
Users will have to enable or disable alternative algorithms depending on their choice.
Uniqueness
This indicator is unique because it combines multiple algorithm-specific two-volume analyses with price volatility.
This indicator is also unique because it amends different algorithms to show output on a similar scale enabling traders to observe various volume-analysis tools simultaneously whilst allocating different colour codes.
Open source re-use
This indicator utilises the following open-source scripts:

Bogdan Ciocoiu - GreuceanuDescription
This indicator is an entry-level script that simplifies volume interpretation for beginning traders.
It is a handy tool that removes all the noise and focuses traders on identifying potential smart money injections.
Uniqueness
This indicator is unique because it introduces the principle of a moving average in the context of volume and then compares it with tick-based volume.
Its uniqueness is reflected in the ability to colour code each volume bar based on the intensity of each relevant (volume) unit whilst comparing it with the volume moving average.
Another benefit of this indicator is the colour coding scheme that removes volume below a particular threshold (default set to 1) under the volume moving average.
In addition to the above features, the indicator differentiates the colour of each bar by price direction.
Open source re-use
To achieve this functionality several open source indicators have been used an integrated within the current one.
RVOL Relative Volume - IntradayHello All,
Relative Volume is one of the most important indicators and Traders should check it while trading/analyzing. it is used to identify whether the volume flows are increasing or decreasing. Relative volume measures current volume in relation to the “usual” volume for this time of the day. What is considered “usual"? For that, we have to use a historical baseline known as the average daily volume. That means how much volume a security does on a daily basis over a defined period. (This scripts runs on the time frames greater or equal 1 minute and less than 1 day)
The common definition for real-time relative volume is: Current volume for this time of day / Average volume for this time of day. It does not mean taking the volume (for example) from 10:30 am to 10:45 am and comparing it to what it does from 10:30 am to 10:45 am every day. What it truly means is to compare cumulative volumes. Therefore, this is the precise definition of real-time relative volume:
Current cumulative volume up to this time of day / Average cumulative volume up to this time of day
What should we understand while checking RVOL;
- Relative volume tell us if volume flows are increasing or decreasing
- A high relative volume tells us that there is increased trading activity in a security today
- Increased volume flows often accompany higher volatility i.e. a significant price move
Let see an example:
P.S. if you want to get more info about RVOL/Relative Volume then you can search it on the net. While developing the script this was used as reference, you can also check it for more info.
Enjoy!

Isolated PivotsThis script identifies potential price reversals at pivot high/low points using sets of 3 candles.
Pivot High: The middle candle must have a higher high and a higher low than the two outer candles.
Pivot Low: The middle candle must have a lower low and a lower high than the two outer candles.
Potential usage: When a market is moving higher in an uptrend, if a pivot low is identified then that might be a sign of price weakness.

Volume Zones Multi-Timeframe OverlayAt its core, this indicator is a variation of my other indicator, Welkin Advanced Volume Overlay (for VSA )
This version is based on the power of multi-timeframe analysis. The basic functionality is simple: Plot lines from the high and low of candles formed during periods of high volume and fill the space between them. The volume levels for deciding what counts as "high volume" are based on standard deviations of the volume's SMA , and the higher the volume , the brighter the zone. i.e., a volume zone set by a volume level that is 4 standard deviations higher than average will be more "filled in" and less transparent than a volume zone from a 2 standard deviation candle.
These zones tend to act as areas of congestion, and the "ceilings" and "floors" of the zones as support and resistance . Overlapping zones tend to indicate strength and are likely to require more effort to get through. The more timeframes that agree with each other, the stronger the zone, ceiling, or floor.
By default, these zones are drawn based on the chart's timeframe and 1 timeframe higher, automatically set based on some "standard" values:
1m -> 5m
5m -> 15m
10m -> 30m
15m -> 60m
30m -> 60m
60m -> 1d
1d -> 1w
Finally, both the base timeframe and the higher timeframe are customizable; this is intended to make it easy to "double" up copies of the indicator to fit even more timeframes on the chart, creating a sort of heatmap for volume price analysis.
An example of three copies of the indicator, showing volume zones from 6 different timeframes.

Baekdoo baselineHi forks,
I'm trader Baekdoosan who trading Equity from South Korea. This Baekdoo baseline will give you the idea of big whale's approximate average price. The idea behind this indicator is to combine volume and price. Here's one of the equation.
...
HT4=highest(volume, 250)
NewH4=valuewhen(volume>HT4 , (open+close+low+high+close)/5, 1)
result4=ema(NewH4, 20)
...
As you can see it will update when highest volume is updated by certain period of time. At that update will be the price of the close weighted price. and I put shift value of 20 (offset of input value) due to putting time theorem of Ichimoku Balance Table. 20 days means for 1 month of market day.
Why this idea work? It is mainly for the support / resistance. Resistance is made for lots of individual's buy. When the price goes down, they are tend to hold. As time goes by price getting high to their average price, then they are selling it with small profit or the same price or with small loss. So resistance is made by lots of individuals. And supports are made by small number of big whales. If we see the volume only, then we cannot differentiate easily for lots of individuals and small number of big whales. But lower price's large volume will most probably be the whale where higher price's large volume will most probably tons of individuals.
hope this will help your trading on equity as well as crypto. I didn't try it on futures. Best of luck all of you. Gazua~!

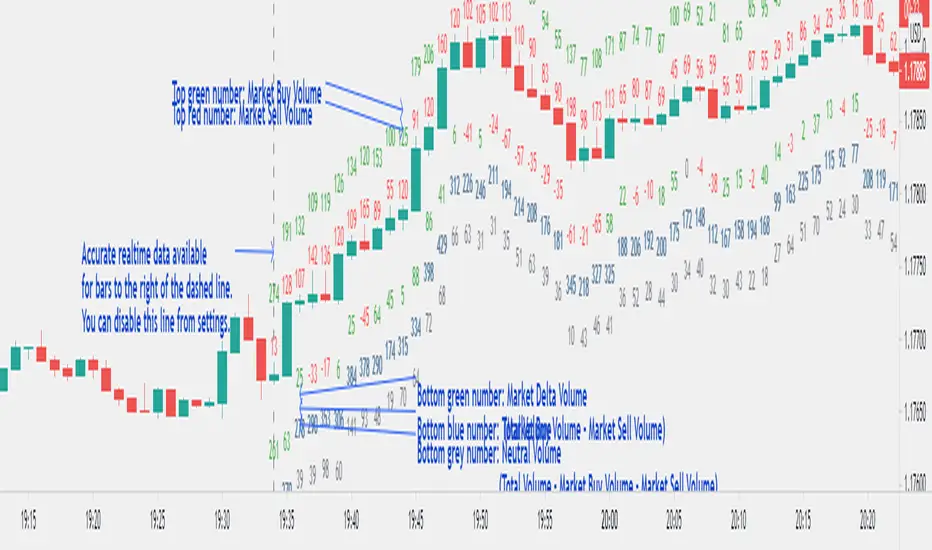
Realtime Volume Bars w Market Buy/Sell/Neutral split & Mkt Delta
What is it?
A tool that shows Real-time Volume bars split into 3 components: (1) Market Buy Volume - i.e., the volume that got transacted on upticks; (2) Market Sell Volume - i.e., the volume that got transacted on downticks;
and, (3) Neutral Volume - i.e., the volume that got transacted without a change in price. (This feature can be turned off if you want normal volume bars).
Market delta (i.e., Market Buy Volume - Market Sell Volume) is also displayed above each volume bar. (On by default; can be switched off from Settings)
The split and Market Delta data are ONLY AVAILABLE FOR REAL-TIME BARS. Historical bars are shown just like regular ones. The dotted line marks the start of real-time data (i.e., the bar from which the indicator started collecting and displaying data). You will see accurate data for bars to the right of this line. The longer you keep a chart open with the study enabled, the more data it collects and displays, and the better your analysis can potentially be.
Note that the data gets reset every time any of the options is changed, the market is switched, the browser is refreshed, or the script is reloaded
DATA ISN'T STORED. I.e., every time a new symbol is loaded, the previous symbol's data is lost. So if you intend to monitor a symbol, you would need to keep it loaded all the time.
Who is it for?
For traders who are used to analyzing buy/sell activity using market buy/sell volume and market delta information
Although you can use this independently as well, use it in conjunction with "Market Delta Volume for Realtime Bars" indicator to get a better visual representation of the numbers.

Market Delta Volume for Realtime BarsWhat is it?
Market Delta Volume Tool for real-time bars
A market delta tool that shows, (1) the volume that got transacted on upticks - or the market buy volume; (2) the volume that got transacted on downticks - or the market sell volume (3) the market delta volume (i.e., market buy volume - market sell volume); (4) the total volume (market buy volume + market sell volume + neutral volume); and (4) the volume that got transacted without a change in price - or the neutral volume (total volume = market buy volume + market sell volume + neutral volume)
NOTE: THIS WORKS ONLY ON REAL-TIME BARS, NOT ON HISTORICAL BARS! The dotted line marks the start of real-time data (i.e., the bar from which the indicator started collecting and displaying data). You will see accurate data only for bars to the right of this line.
The longer you keep a chart open with the study enabled, the more data it collects and displays and the better your analysis can potentially be.
Note that the data gets reset every time any of the options is changed, the market is switched, the browser is refreshed, or the script is reloaded.
DATA ISN'T STORED. I.e., every time a new symbol is loaded/or the same symbol is reloaded, data gets refreshed.
Who is it for?
For traders who are used to analyzing buy/sell activity using market delta information. Especially, short-term trader/scalpers who are used to keeping the same chart open through the trading session.
Also for traders to see and study how anomalies in volume can give clues to buyer/seller absorption, initiative buying/selling etc.
Can be used to better understand VSA as well, although not necessary.
Essentially, this gives real-time delta volume information; use it however you see fit.
SVA - Simple Volume Analyzer, by BlueJayBird [bjb] ENGLISH & SPANISH
------------------------------------- ENSLIGH
The idea was initially inspired in the concepts shared by @LazyBear on his indicator "Better Volume Indicator" (). But I found it somewhat complicated and dull. So I came up with this.
Concept:
It changes the color of volume bars based on surrounding volume changes.
Volume changes are plotted as volume MAs lines in the volume pane.
Whenever the volume is higher than these MAs, the bar changes color.
For this reason, the bar color change is RELATIVE TO the surroundings, because the color change depends on how far the MA has been extended due to sudden (or not) changes in the volume.
BAR COLORS:
Weak Green and Red: Low volume. The calm before or after the storm.
Normal Green and Red: Mid volume. Still low volume, you may get bored.
Yellow: High volume. Players are playing hard and harder.
White: Ultra-High Volume. The elephants stepped in.
NOTES:
SVA works better at lower timeframes. Though as far as I can tell, it works pretty well as far as 1D timeframe.
------------------------------------- SPANISH
La idea estuvo inicialmente inspirada en los conceptos expuestos por @LazyBear en su indicador "Better Volume Indicator" (). Pero lo encontré un poco complicado y falto de claridad. Así que me inventé este.
Conceptp:
Cambia el color de las barras basándose en los últimos cambios de volumen.
Los cambios de volumen son ploteados como lineas de medias móviles (MAs, es decir "Moving Averages") en la sección del volumen (chart pane).
En cualquier momento que el volumen es mayor que estos MAs, el color de las barras cambia.
Por esta razon, el cambio de color de las barras es RELATIVO a lo que está sucediendo alrededor, ya que el cambio de color depende de qué tan lejos el MA se haya extendido por causa de los últimos cambios (o no) de volumen.
BAR COLORS:
Verde y rojo apagados: Volumen bajo (Low Volume). La calma antes de la tormenta.
Verde y rojo normales: Volumen medio (Mid volume). Volumen todavía bajo. Es posible que te aburras.
Amarillo: Volumen alto (High Volume). Los jugadores están jugando duro.
Blanco: Volumen ultra-alto (Ultra-High Volume). Los elefantes entran a la cancha.
NOTAS:
SVA funciona mejor en temporalidades menores. Pero por lo que he visto, funciona bien hasta la temporalidad de 1D.

Welkin Advanced Volume Study (for VSA)This is a translation of Welkin's Advanced Volume Study Indicator originally written for ThinkOrSwim. This version is simpler than Welkin's and attempts to streamline that basic functionality for beginners to Volume Spread Analysis.
This can be used to replace the built-in volume bar with a more advanced version that is designed to facilitate Volume Spread Analysis. The basic idea is to clearly call out areas of high and low volume that help a trader determine where to "Smart Money" may be attempting to move the market. Volume is an incredible powerful tool for the retail trader; learn how to use it.
Grey bar are Below Average volume .
Blue bars are Average Volume , from a 20sma of volume .
Orange bars are 2-sigma (or 2 standard deviations) above average.
Magenta bars are 3-sigma (3 standard deviations) above average.
The plotted lines represent these levels.
Yellow bars have relatively higher volume compared to the previous bar.
The study can also apply these same colors to the price candles themselves, as well as showing buying and selling pressure of the volume bars.

Volume Play This is going to be my first published indicator on Trading View. Thanks for TradingView for providing us this great platform And thanks for all of those who helps me to built this indicator and share there ideas.I cannot mention everyone name here believe me that list going to be huge.Everyone’s idea and help is much appreciated.This is how our TradingView community is growing day by day with kindness and knowledge. Every time I take so much from community in form knowledge that every time somewhere I feel that I also need to do something for community and finally day arrived .A gift from my side to community.A gift of indicator-VOLUME PLAY
This volume based indicator has High Relative Volume bar Background, Low Relative Volume bar background ,Volume Labels of Buying volume, Selling volume and Total volume count with percentage, Highest Volume in Percentage and Highest 5x volume count and 10x volume count of bar.Plus I have did column scaling to take Down pan input so you can switch pane or add in existing pane without any major problem And all this works on any time frame. Isn’t it good idea?
This indicator displays the volume of each session in a similar manner of the default volume indicator.However it add on the last bar Green and Red bar colours. Green means buying is more than selling and Red means selling is more than buying.On top of Some bar If number appears That means that’s volume is highest multiple volume of 5 and if number appears with label means highest multiple volume of 10.So simple without label volume counts means 5x and with label means 10x.
Now some of bars has background colour of Mint green , Pastel red and White.That’s highlight high relative volume bars with a highly buying activity range in Green and high relative volume bars with a highly selling activity range in Red And white background is low relative volume for that timeframe bar.
I am kind of person who don’t keep show indicator value enable all time.So it’s come in mind why not plot this values without enabling it.So I decided to show this values of buying, selling and total volumes on top near middle pane.Interesting thing is that I made a label with the help of pine script Table feature.Thanks a lot to Pine Team to add this new great feature! It’s great alternative for labels feature.Because of this feature I am able to locate buying, selling and total volume at right place where in most of scenario it will adjust.
Please note that all values are estimate.It’s not accurate.I show volumes in K,M form.Plus with volume I also try to show Buying And Selling volume in percentage form to get rough idea about what’s going on in instrument.Idea is to get better view of volume by splitting it into Buying , Selling and Total volume.This allows you to see are the bulls or bears in-control in relation to the overall Volume.
By default this indicator overlay is false but you can move this indicator pane to existing upper or lower pane.It will help to save space as well.If combine with two indicator at same pane then it will create two value scale at right side.So you will not loose any indicators values.By default I used 50% of vertical space in indicator scale factor.
I tried to make this indicator as accurate as inbuilt volume indicator with added extra feature.The main aim of indicator to get Idea of volume role in that symbol with that specific timeframe.Result might not be accurate but I expect somewhat nearby to accurate.
Kept source code open purposely for learners of pine script. Please avoid misuse or selling of this indicator.Remember Sharing Is Caring. If someone has suggestions or any addition then please comment below.Wishing you all abundance of health, wealth, and prosperity.
After all its all about VOLUME PLAY.
Disclaimer:-This indicator is not meant for buy or sell signals.This post and the script don’t provide any financial advice. This indicator/code IS NOT intended to be a formal investment advice or recommendation by the author, nor should be construed as such. Users will be fully responsible by their use regarding their own trading vehicles/assets.

[blackcat] L1 Stock Volume AnalyzerLevel: 1
Background
The basic volume analysis is that buyers are in control when the price is increased. The purchase volume takes place at the offer price and represents the lowest advertised price at which sellers sell their shares. When someone buys shares at the current asking price, it shows that someone wants the shares and is included in the purchase volume metric.
Function
L1 Stock Volume Analyzer plot colorful volume candles with different meanings: red for red price bars, green for green price bars, yellow for active buying volume, fuchsia for active selling volume, navy for high active buying volume turn over rate, and white for high active selling volume turn over rate.
Key Signal
VOLUME SIGNAL:
activbuying ---> active buying volume
activselling ---> active selling volume
abtor ---> high active buying turn over rate
astor ---> high active selling turn over rate
PRICE SIGNAL:
cd ---> price covergence and divergence
positioning ---> price positioning
callthshots ---> call the shorts price signal
Pros and Cons
Pros:
1. extract volume detailed information to judge price trend together
2. price convergence and divergence help to identify long and short entry points
Cons:
1. price convergence and divergence visually works well only for <= 8H time frame
2. this indicator only works for stock trading pairs
Remarks
In order to put price and volume in a unified scale, this indicator is scaled. This scaling is not suitable for all markets. At present, it has only been optimized in the stock exchange market.
Readme
In real life, I am a prolific inventor. I have successfully applied for more than 60 international and regional patents in the past 12 years. But in the past two years or so, I have tried to transfer my creativity to the development of trading strategies. Tradingview is the ideal platform for me. I am selecting and contributing some of the hundreds of scripts to publish in Tradingview community. Welcome everyone to interact with me to discuss these interesting pine scripts.
The scripts posted are categorized into 5 levels according to my efforts or manhours put into these works.
Level 1 : interesting script snippets or distinctive improvement from classic indicators or strategy. Level 1 scripts can usually appear in more complex indicators as a function module or element.
Level 2 : composite indicator/strategy. By selecting or combining several independent or dependent functions or sub indicators in proper way, the composite script exhibits a resonance phenomenon which can filter out noise or fake trading signal to enhance trading confidence level.
Level 3 : comprehensive indicator/strategy. They are simple trading systems based on my strategies. They are commonly containing several or all of entry signal, close signal, stop loss, take profit, re-entry, risk management, and position sizing techniques. Even some interesting fundamental and mass psychological aspects are incorporated.
Level 4 : script snippets or functions that do not disclose source code. Interesting element that can reveal market laws and work as raw material for indicators and strategies. If you find Level 1~2 scripts are helpful, Level 4 is a private version that took me far more efforts to develop.
Level 5 : indicator/strategy that do not disclose source code. private version of Level 3 script with my accumulated script processing skills or a large number of custom functions. I had a private function library built in past two years. Level 5 scripts use many of them to achieve private trading strategy.

Freedom of MovementFreedom of Movement Indicator
---------------------------------------------------------
In “Evidence-Based Support & Resistance” article, author Melvin Dickover introduces two new indicators to help traders note support and resistance areas by identifying supply and demand pools. Here you can find the support-resistance technical indicator called "Freedom of Movement".
The indicator takes into account price-volume behavior in order to detect points where movement of price is suddenly restricted, the possible supply and demand pools. These points are also marked by Defended Price Lines (DPLs).
DPLs are horizontal lines that run across the chart at levels defined by following conditions:
* Overlapping bars: If the indicator spike (i.e., indicator is above 2.0 or a custom value) corresponds to a price bar overlapping the previous one, the previous close can be used as the DPL value.
* Very large bars: If the indicator spike corresponds to a price bar of a large size, use its close price as the DPL value.
* Gapping bars: If the indicator spike corresponds to a price bar gapping from the previous bar, the DPL value will depend on the gap size. Small gaps can be ignored: the author suggests using the previous close as the DPL value. When the gap is big, the close of the latter bar is used instead.
* Clustering spikes: If the indicator spikes come in clusters, use the extreme close or open price of the bar corresponding to the last or next to last spike in cluster.
DPLs can be used as support and resistance levels. In order confirm and refine them, FoM (Freedom of Movement) is used along with the Relative Volume Indicator (RVI), which you can find here:
Clustering spikes provide the strongest DPLs while isolated spikes can be used to confirm and refine those provided by the RVI. Coincidence of spikes of the two indicator can be considered a sign of greater strength of the DPL.
More info:
S&C magazine, April 2014.

Multiple VWAPAn intraday indicator which plots the 3 different VWAP.
1. D-VWAP shows VWAP from the first candle of the day
2. W-VWAP shows VWAP from the first candle of the week
3. M-VWAP shows VWAP from the first candle of the month
Multi-Timeframe VWAP V2 MODQuick and dirty mod of this script in order to fit my needs.
Added one custom session
More user friendly (Enable/disable through inputs menu)

Klinger Volume OscillatorThis indicator was originally developed by Stephen J. Klinger (Stocks & Commodities, V.15:12 (December, 1997): "Identifying Trends with Volume Analysis").
NOTE : this is the only correct version of Klinger Volume Oscillator in the public library.
Like and follow for more open source indicators!
Happy Trading!

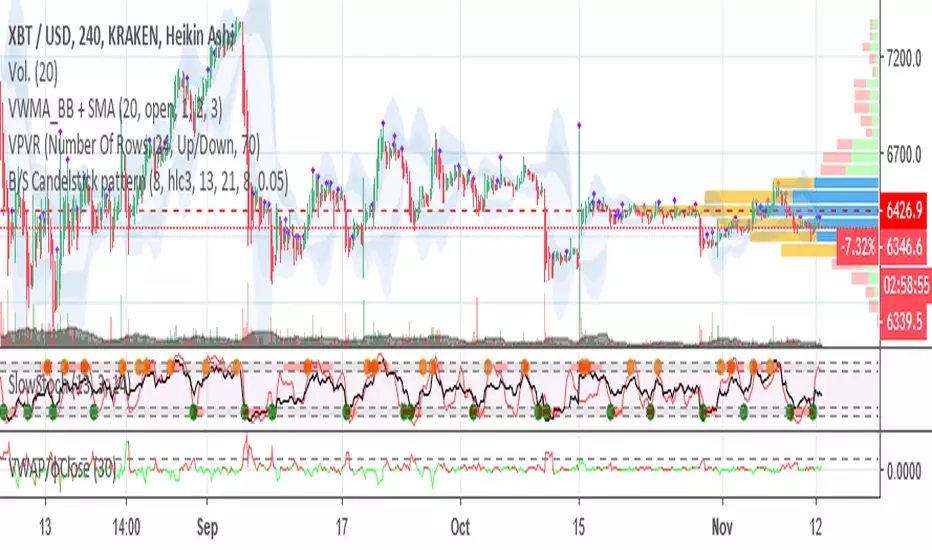
VWAP/CloseHey!
This time I'm going to introduce you to an indicator which catches volume spikes and its respect price change, to give an idea of the following price action.
The logic is pretty simple:
Value > 1 : High Volume that changed a lot the price, next price action will follow that trend.
Value < 1 : Low volume that changed a lot the price, trend is weak.
Value = 1 : Volume and price change is balanced, trend would continue based on the previous values.
If you have any doubt just comment!
φ