Volume by Time [LuxAlgo]The Volume by Time indicator collects volume data for every point in time over the day and displays the average volume of the specific dataset collected at each respective bar.
The indicator overlays the current volume and the historical average to allow for better comparisons.
🔶 USAGE
Throughout the day, the volume of every bar is stored in groups organized by the time when each bar occurred.
Over time, the datasets accumulate, and from that, we can simply determine the average value at each specific time of the day.
The display is a histogram style, which consists of hollow bars and solid filled columns.
-Hollow bars represent the average volume at that time of the day.
-Solid columns display the current volume from the current bar.
By default, the entire history of data is used, but if desired, the number of days under analysis can be specified to provide a more relevant point of view.
A readout of the number of days being analyzed can be seen in the status bar at any time.
Note: Due to partial sessions, it is typical to see this value change throughout the day; this is simply due to the fact that not every trading session has the exact same schedule 100% of the time.
The analysis type can also be specified; these can be either Average (Default) or Median.
Additionally, a Bi-directional can be toggled for a distinct difference between upwards volume and downwards volume.
🔶 SETTINGS
Analysis Type: Choose between Average or Median analysis modes.
Length (Days): Set the number of days to use for analysis. Set to 0 for full data (Default 0).
Bi-Directional Toggle: Toggle between one-sided or two-sided display.
VOLUMEBREAKOUT

Moving Average Volume (20, 50)Shows two moving averages of volume, the 20 and 50 periods.
white bars in the background show volume, look for breaks of the target lines to confirm a breakout with volume
green shaded regions show how much higher the current volume is compared to historical volume
the greener the shade, the higher the multiple is (cap is 10x higher)
indicator is to be used with other breakout identifiers, or to help confirm the strength of a move out of an SAR level.

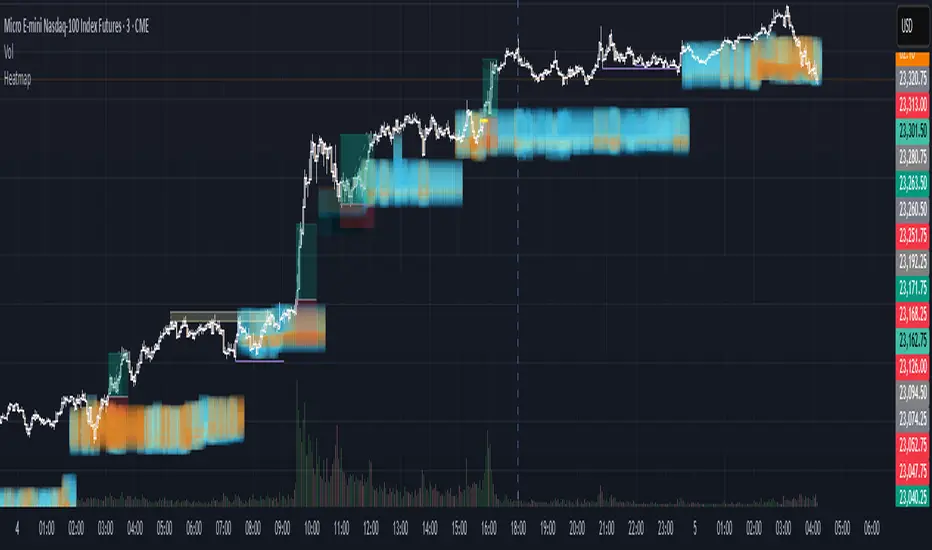
Institutional HeatmapHeatmap Range - Volume Profile Visualization Indicator
What This Indicator Does
The Heatmap Range indicator provides a sophisticated volume profile visualization that displays price levels with the highest trading activity using color-coded heatmaps directly on your chart. Unlike traditional volume indicators, this tool shows WHERE the most significant trading occurred within specific price ranges over a customizable lookback period.
Advanced Volume Analysis
Volume-Weighted Price Levels: Calculates and displays up to 20 price levels based on actual trading volume
Customizable Time Period: Analyze volume distribution over 10-500 bars (default: 180 bars)
Smart Bin Sizing: Adjustable pip range (0.1-50 pips) for precise level identification
Peak Detection: Automatically identifies and centers display around highest volume areas
Visual Customization
3 Color Patterns:
Inverted Heat (Orange to Dark Red)
Inverted Cool (Orange to Dark Blue)
Inverted Purple (Light Pink to Dark Purple)
Transparency Control: 0-95% transparency for optimal chart readability
Adaptive Display: Shows most relevant levels centered around peak volume
Multi-Asset Support
Forex Pairs (EUR/USD, GBP/USD, etc.)
Precious Metals (Gold/XAUUSD, Silver/XAGUSD)
Futures (NQ, ES, YM, etc.)
Cryptocurrencies
Stock Indices
Customizable Parameters
Histogram Period (10-500, Default: 180) Bars to analyze for volume distribution
Bin Range (0.1-50 pips, Default: 5.0) Price range for each volume level
Color Pattern (1-3, Default: 1) Visual color scheme selection
Average Volume Period (10-200, Default: 100) Period for volume normalization
Max Display Levels (5-20, Default: 20) Maximum price levels to show
Transparency (0-95%, Default: 50%) Opacity of heatmap display
How to Use
For Day Traders
Identify key support/resistance levels based on actual volume
Spot high-probability reversal zones
Plan entries/exits around significant volume levels
For Swing Traders
Analyze longer-term volume distribution patterns
Identify major accumulation/distribution zones
Confirm breakout levels with volume validation
For Scalpers
Quick identification of intraday volume hotspots
Real-time volume level updates
Precise entry/exit timing around volume clusters
Visual Interpretation
Darker Colors: Higher volume concentration (stronger levels)
Lighter Colors: Lower volume concentration
Color Intensity: Directly correlates to volume strength at that price level
Level Positioning: Automatically centers around peak volume areas
Technical Specifications
Pine Script Version: v5
Chart Overlay: Yes
Max Bars Back: 1000
Performance Optimized: Limited to 200 bins for smooth operation
Real-time Updates: Dynamic calculation on each bar close
Getting Started
Add to Chart: Apply indicator to any supported timeframe
Adjust Period: Set histogram period based on your trading style
Choose Colors: Select color pattern that suits your chart theme
Fine-tune Levels: Adjust bin range and max levels for optimal display
Set Transparency: Balance visibility with chart clarity
Important Notes
Minimum Data Requirement: Needs at least 10 bars of history to function
Performance: Higher periods and smaller bin ranges require more processing
Volume Dependency: Most effective on instruments with consistent volume data
Timeframe Agnostic: Works on all timeframes from 1-minute to monthly
Status Information
The indicator includes a real-time information table showing:
Current settings (Period, Bin Range, Color Pattern, Transparency)
Indicator status (Active/Loading)
Disclaimer: This indicator is for educational and informational purposes only. Past performance does not guarantee future results. Always conduct your own analysis and risk management before making trading decisions.
Compatible with TradingView's Pine Script v5 | Optimized for all market conditions | Professional-grade volume analysis
Volume Based Analysis V 1.00
Volume Based Analysis V1.00 – Multi-Scenario Buyer/Seller Power & Volume Pressure Indicator
Description:
1. Overview
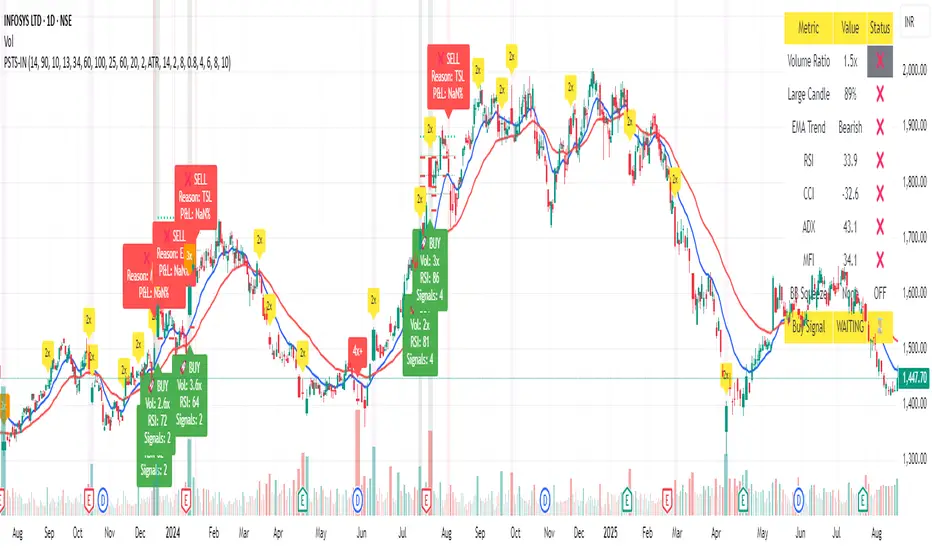
The Volume Based Analysis V1.00 indicator is a comprehensive tool for analyzing market dynamics using Buyer Power, Seller Power, and Volume Pressure scenarios. It detects 12 configurable scenarios combining volume-based calculations with price action to highlight potential bullish or bearish conditions.
When used in conjunction with other technical tools such as Ichimoku, Bollinger Bands, and trendline analysis, traders can gain a deeper and more reliable understanding of the market context surrounding each signal.
2. Key Features
12 Configurable Scenarios covering Buyer/Seller Power convergence, divergence, and dominance
Advanced Volume Pressure Analysis detecting when both buy/sell volumes exceed averages
Global Lookback System ensuring consistency across all calculations
Dominance Peak Module for identifying strongest buyer/seller dominance at structural pivots
Real-time Signal Statistics Table showing bullish/bearish counts and volume metrics
Fully customizable inputs (SMA lengths, multipliers, timeframes)
Visual chart markers (S01 to S12) for clear on-chart identification
3. Usage Guide
Enable/Disable Scenarios: Choose which signals to display based on your trading strategy
Fine-tune Parameters: Adjust SMA lengths, multipliers, and lookback periods to fit your market and timeframe
Timeframe Control: Use custom lower timeframes for refined up/down volume calculations
Combine with Other Indicators:
Ichimoku: Confirm volume-based bullish signals with cloud breakouts or trend confirmation
Bollinger Bands: Validate divergence/convergence signals with overbought/oversold zones
Trendlines: Spot high-probability signals at breakout or retest points
Signal Tables & Peaks: Read buy/sell volume dominance at a glance, and activate the Dominance Peak Module to highlight key turning points.
4. Example Scenarios & Suggested Images
Image #1 – S01 Bullish Convergence Above Zero
S01 activated, Buyer Power > 0, both buyer power slope & price slope positive, above-average buy volume. Show S01 ↑ marker below bar.
Image #2 – Combined with Ichimoku
Display a bullish scenario where price breaks above Ichimoku cloud while S01 or S09 bullish signal is active. Highlight both the volume-based marker and Ichimoku cloud breakout.
Image #3 – Combined with Bollinger Bands & Trendlines
Show a bearish S10 signal at the upper Bollinger Band near a descending trendline resistance. Highlight the confluence of the volume pressure signal with the band touch and trendline rejection.
Image #4 – Dominance Peak Module
Pivot low with green ▲ Bull Peak and pivot high with red ▼ Bear Peak, showing strong dominance counts.
Image #5 – Statistics Table in Action
Bottom-left table showing buy/sell volume, averages, and bullish/bearish counts during an active market phase.
5. Feedback & Collaboration
Your feedback and suggestions are welcome — they help improve and refine this system. If you discover interesting use cases or have ideas for new features, please share them in the script’s comments section on TradingView.
6. Disclaimer
This script is for educational purposes only. It is not financial advice. Past performance does not guarantee future results. Always do your own analysis before making trading decisions.
Tip: Use this tool alongside trend confirmation indicators for the most robust signal interpretation.

VOLUME Simple [Titans_Invest]VOLUME Simple
A streamlined volume analysis tool crafted for simplicity and smart signal detection.
Although simple in appearance, this indicator brings intelligent volume-based entries through configurable logic. Its design emphasizes clean and effective interpretation of volume signals.
⯁ WHAT IS THE VOLUME INDICATOR❓
The Volume indicator is a fundamental technical analysis tool that measures the number of shares or contracts traded in a security or market during a given period. It helps traders and investors understand the strength or weakness of a price movement, confirm trends, and predict potential reversals. Volume is typically displayed as a histogram below a price chart, with each bar representing the volume traded during a specific time interval.
⯁ HOW TO USE THE VOLUME❓
The Volume indicator can be used in several ways to enhance trading decisions:
• Trend Confirmation: High volume during a price move confirms the strength of that trend, while low volume can indicate a weak or unsustainable trend.
• Breakouts: A price breakout from a pattern or range accompanied by high volume is more likely to be valid and sustainable.
• Divergence: When the price moves in one direction and volume moves in the opposite direction, it can signal a potential reversal.
• Overbought/Oversold Conditions: Extreme volume levels can sometimes indicate that an asset is overbought or oversold, though this is less straightforward than with oscillators like the RSI.
⯁ ENTRY CONDITIONS
The conditions below are fully flexible and allow for complete customization of the signal.
______________________________________________________
🔹 CONDITIONS TO BUY 📈
______________________________________________________
▪︎ Signal Validity: The signal will remain valid for X bars .
🔹 volume > volume_MA * Trigger Signal (close > open)
🔹 volume > volume_MA * Trigger Signal (Keep State)
______________________________________________________
______________________________________________________
🔸 CONDITIONS TO SELL 📉
______________________________________________________
▪︎ Signal Validity: The signal will remain valid for X bars .
🔸 volume > volume_MA * Trigger Signal (close > open)
🔸 volume > volume_MA * Trigger Signal (Keep State)
______________________________________________________
______________________________________________________
🤖 AUTOMATION 🤖
• You can automate the BUY and SELL signals of this indicator.
______________________________________________________
______________________________________________________
⯁ UNIQUE FEATURES
______________________________________________________
Signal Validity: The signal will remain valid for X bars
Condition Table: BUY/SELL
Condition Labels: BUY/SELL
Plot Labels in the Graph Above: BUY/SELL
Automate and Monitor Signals/Alerts: BUY/SELL
Signal Validity: The signal will remain valid for X bars
Table of Conditions: BUY/SELL
Conditions Label: BUY/SELL
Plot Labels in the graph above: BUY/SELL
Automate & Monitor Signals/Alerts: BUY/SELL
______________________________________________________
📜 SCRIPT : VOLUME Simple
🎴 Art by : @Titans_Invest & @DiFlip
👨💻 Dev by : @Titans_Invest & @DiFlip
🎑 Titans Invest — The Wizards Without Gloves 🧤
✨ Enjoy!
______________________________________________________
o Mission 🗺
• Inspire Traders to manifest Magic in the Market.
o Vision 𐓏
• To elevate collective Energy 𐓷𐓏

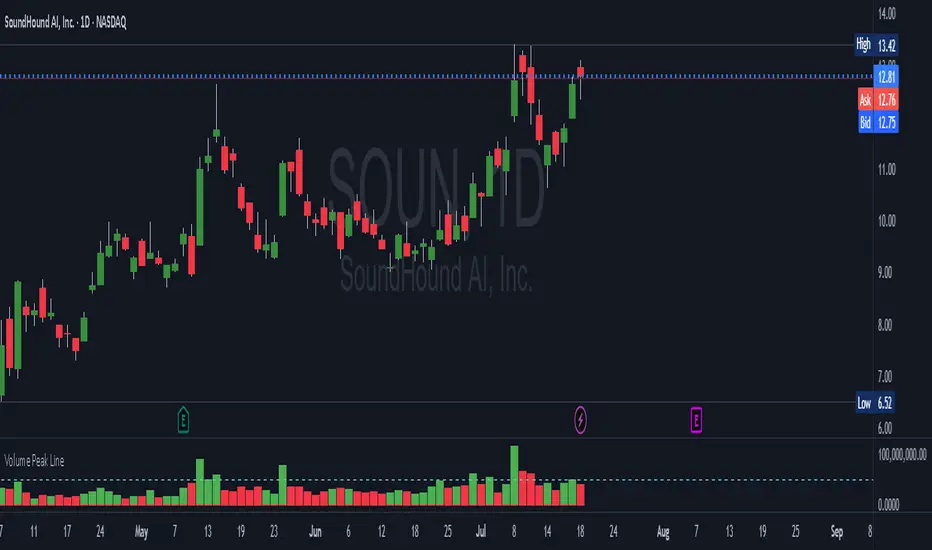
Volume Peak LineA fully configurable “Volume Peak Line” indicator that draws a horizontal threshold at the highest volume over the last X candles (default 5).
Custom lookback (X volume candles)
Optional alert when current volume exceeds that peak
Separate up/down volume bars (green/red) or hide them to use your own volume overlays
Use it to spot surges in trading activity on any timeframe—ideal for intraday or swing setups where a barn-burner volume bar can signal a reversal or the start of a new trend.
VWAP/VOL [Extension] | FractalystWhat's the indicator's purpose and functionality?
The VWAP/VOL Extension is designed specifically as a bias identification system for the Quantify Trading Model.
This extension uses volume-weighted average price analysis combined with institutional volume classification to automatically detect market bias without requiring optimization periods that lead to overfitting.
The system provides real-time bias signals (bullish/bearish/neutral) that integrate directly with Quantify's machine learning algorithms, enabling institutional-level backtesting and automated entry/exit identification based on genuine market structure rather than curve-fitted parameters.
How does this extension work with the Quantify Trading Model?
The VWAP/VOL Extension serves as the bias detection engine for Quantify's automated trading system.
Instead of manually selecting bias direction, this extension automatically identifies market bias using:
- Volume-weighted VWAP analysis with three-state detection (bullish/bearish/neutral)
- Institutional volume classification using relative volume thresholds without optimization
- Non-repainting architecture ensuring consistent bias signals for Quantify's machine learning
The extension outputs bias signals that Quantify uses as input through the `input.source()` function, allowing the Trading Model to focus on optimal entry/exit timing while the extension handles bias identification.
Why doesn't this use optimization periods like other indicators?
The VWAP/VOL Extension deliberately avoids optimization periods to prevent overfitting bias that destroys out-of-sample performance. The system uses:
- Fixed mathematical thresholds based on market structure principles rather than optimized parameters
- Relative volume analysis using standard 2.0x/0.5x ratios that work across all market conditions
- VWAP distance calculations based on percentage thresholds without curve-fitting
- Gap enforcement using fixed 5-bar minimums for disciplined bias detection
This approach ensures the bias signals remain robust across different market regimes without the performance degradation typical of over-optimized systems.
Can this extension be used independently for discretionary trading?
No, the VWAP/VOL Extension is specifically engineered to work as a component within the Quantify ecosystem. The extension is designed to:
- Provide bias input for Quantify's machine learning algorithms
- Enable automated backtesting through systematic bias identification
- Support institutional-level analysis when combined with Quantify's ML entry model
Using this extension independently would miss the primary value proposition of systematic entry/exit optimization that Quantify provides.
The extension handles bias detection so Quantify can focus on probability-based trade timing and risk management.
How does this enable institutional-level backtesting?
The extension transforms discretionary bias identification into systematic institutional analysis by:
- Eliminating subjective bias selection through automated VWAP/volume analysis
- Providing consistent historical signals with non-repainting architecture for accurate backtesting
- Integrating with Quantify's algorithms to identify optimal entry patterns based on objective bias states
- Enabling performance analysis across multiple market regimes without optimization bias
This combination allows Quantify to run institutional-grade backtests with consistent bias identification, generating reliable performance statistics and risk metrics that reflect genuine market edge rather than curve-fitted results.
How do I integrate this with the Quantify Trading Model?
Integration enables institutional-grade systematic trading through advanced machine learning and statistical validation:
- Add both VWAP/VOL Extension and Quantify Trading Model to your chart
- Select VWAP/VOL Extension as the bias source using input.source()
- Quantify automatically uses the extension's bias signals for entry/exit analysis
- The built-in machine learning algorithms score optimal entry and exit levels based on trend intensity, volume conviction, and market structure patterns identified by the extension
The extension handles all bias detection complexity while Quantify focuses on optimal trade timing, position sizing, and risk management along with PineConnector automation
What markets and assets does the VWAP/VOL Extension work best on?
The VWAP/VOL Extension performs optimally on markets with consistent, high-volume participation since the system relies on institutional volume analysis for bias detection. Futures markets provide the most reliable performance due to their centralized volume data and continuous institutional participation.
Recommended Futures Markets:
- ES (S&P 500 E-mini) - Over 2 million contracts daily volume, excellent liquidity depth
- NQ (NASDAQ-100 E-mini) - Around 600,000 contracts daily, strong tech sector representation
- YM (Dow Jones E-mini) - Consistent institutional flow and volume patterns
- RTY (Russell 2000 E-mini) - Small-cap exposure with reliable volume data
- GC (Gold Futures) - High volume commodity with institutional participation
- CL (Crude Oil Futures) - Energy sector representation with strong volume consistency
Why Futures Markets Excel:
- Futures markets provide centralized volume reporting, ensuring the extension's volume classification system receives accurate institutional participation data. The standardized contract specifications and continuous trading hours create consistent volume patterns that the extension's algorithms can analyze effectively.
Acceptable Timeframes and Portfolio Integration:
- Any timeframe that can be evaluated within Quantify Trading Model's backtesting engine is acceptable for live trading implementation.
The extension is specifically designed to integrate with Quantify's portfolio management system, allowing multiple strategies across different timeframes and assets to operate simultaneously while maintaining consistent bias identification methodology across the entire automated trading portfolio.
Legal Disclaimers and Risk Acknowledgments
Trading Risk Disclosure
The VWAP/VOL Extension is provided for informational, educational, and systematic bias detection purposes only and should not be construed as financial, investment, or trading advice. The extension provides volume-weighted institutional analysis but does not guarantee profitable outcomes, accurate bias predictions, or positive investment returns.
Trading systems utilizing bias detection algorithms carry substantial risks including but not limited to total capital loss, incorrect bias identification, market regime changes, and adverse conditions that may invalidate volume-based analysis. The extension's performance depends on accurate volume data, TradingView infrastructure stability, and proper integration with Quantify Trading Model, any of which may experience data errors, technical failures, or service interruptions that could affect bias detection accuracy.
System Dependency Acknowledgment
The extension requires continuous operation of multiple interconnected systems: TradingView charts and real-time data feeds, accurate volume reporting from exchanges, Quantify Trading Model integration, and stable platform connectivity. Any interruption or malfunction in these systems may result in incorrect bias signals, missed transitions, or unexpected analytical behavior.
Users acknowledge that neither Fractalyst nor the creator has control over third-party data providers, exchange volume reporting accuracy, or TradingView platform stability, and cannot guarantee data accuracy, service availability, or analytical performance. Market microstructure changes, volume reporting delays, exchange outages, and technical factors may significantly affect bias detection accuracy compared to theoretical or backtested performance.
Intellectual Property Protection
The VWAP/VOL Extension, including all proprietary algorithms, volume classification methodologies, three-state bias detection systems, and integration protocols, constitutes the exclusive intellectual property of Fractalyst. Unauthorized reproduction, reverse engineering, modification, or commercial exploitation of these proprietary technologies is strictly prohibited and may result in legal action.
Liability Limitation
By utilizing this extension, users acknowledge and agree that they assume full responsibility and liability for all trading decisions, financial outcomes, and potential losses resulting from reliance on the extension's bias detection signals. Fractalyst shall not be liable for any unfavorable outcomes, financial losses, missed opportunities, or damages resulting from the development, use, malfunction, or performance of this extension.
Past performance of bias detection accuracy, volume classification effectiveness, or integration with Quantify Trading Model does not guarantee future results. Trading outcomes depend on numerous factors including market regime changes, volume pattern evolution, institutional behavior shifts, and proper system configuration, all of which are beyond the control of Fractalyst.
User Responsibility Statement
Users are solely responsible for understanding the risks associated with algorithmic bias detection, properly configuring system parameters, maintaining appropriate risk management protocols, and regularly monitoring extension performance. Users should thoroughly validate the extension's bias signals through comprehensive backtesting before live implementation and should never base trading decisions solely on automated bias detection.
This extension is designed to provide systematic institutional flow analysis but does not replace the need for proper market understanding, risk management discipline, and comprehensive trading methodology. Users should maintain active oversight of bias detection accuracy and be prepared to implement manual overrides when market conditions invalidate volume-based analysis assumptions.
Terms of Service Acceptance
Continued use of the VWAP/VOL Extension constitutes acceptance of these terms, acknowledgment of associated risks, and agreement to respect all intellectual property protections. Users assume full responsibility for compliance with applicable laws and regulations governing automated trading system usage in their jurisdiction.

OBV with MA & Bollinger Bands by Marius1032OBV with MA & Bollinger Bands by Marius1032
This script adds customizable moving averages and Bollinger Bands to the classic OBV (On Balance Volume) indicator. It helps identify volume-driven momentum and trend strength.
Features:
OBV-based trend tracking
Optional smoothing: SMA, EMA, RMA, WMA, VWMA
Optional Bollinger Bands with SMA
Potential Combinations and Trading Strategies:
Breakouts: Look for price breakouts from the Bollinger Bands, and confirm with a rising OBV for an uptrend or falling OBV for a downtrend.
Trend Reversals: When the price touches a Bollinger Band, examine the OBV for divergence. A bullish divergence (price lower low, OBV higher low) near the lower band could signal a reversal.
Volume Confirmation: Use OBV to confirm the strength of the trend indicated by Bollinger Bands. For example, if the BBs indicate an uptrend and OBV is also rising, it reinforces the bullish signal.
1. On-Balance Volume (OBV):
Purpose: OBV is a momentum indicator that uses volume flow to predict price movements.
Calculation: Volume is added on up days and subtracted on down days.
Interpretation: Rising OBV suggests potential upward price movement. Falling OBV suggests potential lower prices.
Divergence: Divergence between OBV and price can signal potential trend reversals.
2. Moving Average (MA):
Purpose: Moving Averages smooth price fluctuations and help identify trends.
Combination with OBV: Pairing OBV with MAs helps confirm trends and identify potential reversals. A crossover of the OBV line and its MA can signal a trend reversal or continuation.
3. Bollinger Bands (BB):
Purpose: BBs measure market volatility and help identify potential breakouts and trend reversals.
Structure: They consist of a moving average (typically 20-period) and two standard deviation bands.
Combination with OBV: Combining BBs with OBV allows for a multifaceted approach to market analysis. For example, a stock hitting the lower BB with a rising OBV could indicate accumulation and a potential upward reversal.
Created by: Marius1032

Trendline Breakouts With Volume Strength [TradeDots]Trendline Breakouts With Volume Strength is an innovative indicator designed to identify potential market turning points using pivot-based trendline detection and volume confirmation. By merging dynamic trendline analysis with multi-tiered volume filters, this tool helps traders quickly spot breakouts or breakdowns that may signal significant shifts in price action.
📝 HOW IT WORKS
1. Pivot-Based Trendline Detection
The script automatically scans for recent pivot highs and lows over a user-defined lookback period.
When it finds higher pivot lows, it plots green uptrend lines; when it finds lower pivot highs, it plots red downtrend lines.
These dynamic lines update as new pivots form, providing continuously refreshed trend guidance.
2. Volume Ratio Analysis
A moving average of volume is compared against the current bar’s volume to calculate a ratio (e.g., 1.5×, 2×).
Higher ratios suggest above-average volume, often interpreted as stronger participation.
The script applies color-coded cues to highlight the intensity of volume surges.
3. Breakout & Breakdown Detection
Each trendline is monitored for a defined “break threshold,” which helps avoid minor penetrations that can trigger premature signals.
When price closes beyond a threshold below an uptrend line, the indicator labels it a “BREAKDOWN.” If it closes above a threshold on a downtrend line, it labels it a “BREAKOUT.”
Volume surges accompanying these breaks are highlighted with contextual emojis and distinct color gradients for quick visual reference.
4. Trend Direction Table
A small on-chart table provides a snapshot of the current market trend—Uptrend, Downtrend, or Sideways—based on a simple moving average slope and the number of active uptrend or downtrend lines.
This table also displays quick stats on how many lines are actively tracked, helping traders assess the broader market posture at a glance.
🛠️ HOW TO USE
1. Choose a Timeframe
This script works on multiple timeframes. Intraday traders can monitor minute or hourly charts for frequent pivot updates, while swing and position traders may prefer daily or weekly intervals to reduce noise.
2. Observe Trendlines & Labels
Watch for newly drawn green/red lines connecting pivots.
When you see a “BREAKOUT” or “BREAKDOWN” label, confirm whether volume was abnormally high based on the ratio or color-coded bars.
3. Consult the Trend Table
Use the table in the bottom-right corner to quickly check if the market is trending or range-bound.
Look at the count of active uptrend vs. downtrend lines to gauge broader sentiment.
4. Employ Additional Analysis
Combine these signals with other tools (e.g., candlestick patterns, oscillators, or fundamental analysis).
Validate potential breakouts using standard techniques like retests or support/resistance checks.
❗️LIMITATIONS
Delayed Pivots: Trendlines only adjust once new pivot highs or lows form, which can introduce a slight lag in highly volatile environments.
Choppy Markets: Rapid, back-and-forth price moves may produce conflicting trendline signals and frequent breakouts/breakdowns.
Volume Data Reliability: Gaps in volume data or unusual market conditions (holidays, low-liquidity sessions) can skew ratio readings.
RISK DISCLAIMER
Trading any financial instrument involves substantial risk, and this indicator does not guarantee profits or prevent losses. All signals and visual cues are for educational and informational purposes only; past performance does not assure future outcomes. You retain full responsibility for your trading decisions, including proper risk management, position sizing, and the use of additional confirmation methods. Always consider the possibility of losing some or all of your original investment.

Volume Spike Alert & Overlay"Volume Spike Alert & Overlay" highlights unusually high trading volume on a chart. It calculates whether the current volume exceeds a user-defined percentage above the historical average and triggers an alert if it does. The information is also displayed in a customizable on-screen table.
What It Does
Monitors volume for each bar and compares it to an average over a user-defined lookback period.
Supports multiple smoothing methods (SMA, EMA, WMA, RMA) for calculating the average volume.
Triggers an alert when current volume exceeds the threshold percentage above the average.
Displays a table on the chart with:
Current Volume
Average Volume
Threshold Percentage
Optional empty row for spacing/formatting
How It Works
User Inputs:
lookbackPeriods: Number of bars used to calculate the average volume.
thresholdPercent: % above the average that triggers a volume spike alert.
smoothingType: Type of moving average used for volume calculation.
textColor, bgColor: Formatting for the display table.
tablePositionInput: Where the table appears on the chart (e.g., Bottom Right).
Toggles for showing/hiding parts of the table.
Volume Calculations:
Calculates current bar's volume.
Calculates average volume using the selected smoothing method.
Computes the threshold: avgVol * (1 + thresholdPercent / 100).
Compares current volume to threshold.
Table Display:
Dynamically creates a table with volume stats.
Adds rows based on user preferences.
Alerts:
alertcondition fires when currentVol crosses above the calculated threshold.
Message: "Volume Threshold Exceeded"
Usage Examples
Example 1: Spotting High Activity
Apply the script to a stock like AAPL on a 5-minute chart.
Set lookbackPeriods to 20 and thresholdPercent to 30.
Use EMA for more reactive volume tracking.
When volume spikes more than 30% above the 20-period EMA, an alert triggers.
Example 2: Day Trading Filter
For scalpers, apply it to a 1-minute crypto chart (e.g., BTC/USDT).
Set thresholdPercent to 50 to catch only strong surges.
Position the table at the top left and reduce visible info for a clean layout.
Example 3: Long-Term Context
On a daily chart, use SMA and set lookbackPeriods to 50.
Helps identify breakout moves supported by strong volume.
How this is different from Trading View's Volume indicator:
The standard volume plot from trading view allows users to set a alert when the average line is crossed, but it does not allow you to set a custom percentage at which to trigger an alert. This indicator will allow you to set any percentage you wish to monitor and above that percentage threshold will trigger your alert.
===== ORIGINAL DESCRIPTION =====
Volume Spike Alert & Overlay
This indicator will display the following as an overlay on your chart:
Current volume
Average Volume
Threshold for Alert
Description:
This indicator will display the current bar volume based on the chart time frame,
display the average volume based on selected conditions,
allow user selectable threshold over the average volume to trigger an alert.
Options:
Average lookback period
Smoothing type
Alert Threshold %
Enable / Disable Each Value
Change Text Color
Change Background Color
Change Table location
Add/Remove extra row for placement in top corner
Usage Example:
I use this indicator to alert when the current volume exceeds the average volume by a specified percentage to alert to volume spikes.
Set the threshold to 25% in the settings
Create an alert by clicking on the 3 dots on the right of the indicator title on the chart
When the threshold is exceeded the alert will trigger

VOL & AVG OverlayCustom Session Volume Versus Average Volume
Description:
This indicator will create an overlay on your chart that will show you the following information:
Custom Session Volume
Average For Selected Session
Percentage Comparison
Options:
Set Custom Time Frame For Calculations
Set Custom Time Frame For Average Comparison
Set Custom Time Zone
Enable / Disable Each Value
Change Text Color
Change Background Color
Change Table location
Example:
Set indicator to 30 period average. Set custom time frame to 9:30am to 10:30am Eastern/New York.
When the time frame for the calculation is closed , the indicator will provide a comparison of the current days volume compared to the average of 30 previous days for that same time frame and display it as a percentage in the table.
In this example you could compare how the first hour of the trading day compares to the previous 30 day's average, aiding in evaluating the potential volume for the remainder of the day.
Notes:
Times must be entered in 24 hour format. (1pm = 13:00 etc.)
This indicator is for Intra-day time frames, not > Day.
If you prefer data in this format as opposed to a plotted line, check out my other indicator: ADR & ATR Overlay

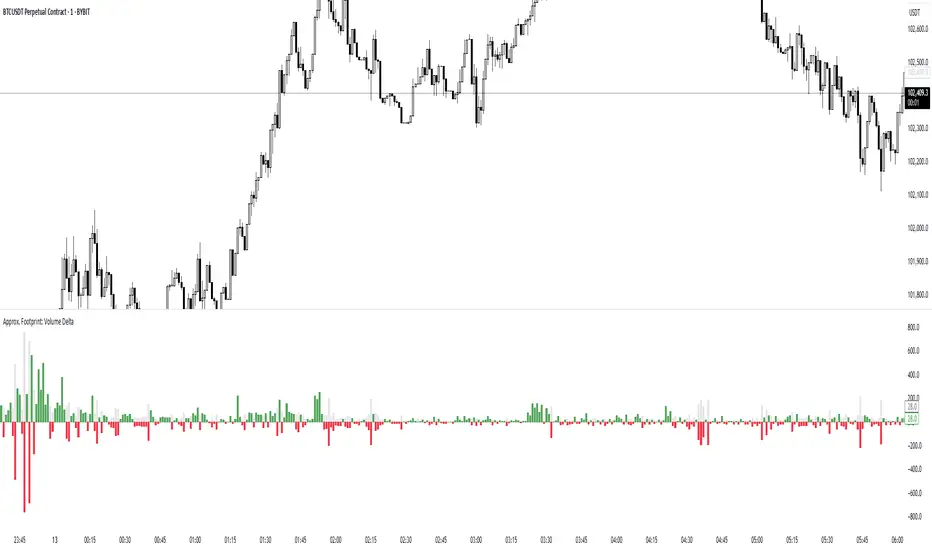
Approx. Footprint: Volume DeltaThis indicator brings you a simplified “footprint” view by charting the volume delta—the imbalance between bullish and bearish volume—alongside total bar volume.
Delta Bars: Green/red columns show where buyers (close > open) or sellers (close < open) dominated each bar.
Total Volume: Semi-transparent gray columns in the background give you overall context.
No Hidden Data: Works on any symbol/timeframe without tick-by-tick or bid/ask feeds.
Use it to quickly spot bars with strong buying or selling pressure, identify momentum shifts, and confirm breakouts or reversals—all within TradingView’s standard volume streams.
Volume Sentiment Pro (NTY88)Volume Sentiment Edge: Smart Volume & RSI Trading System
Description:
Unlock the power of volume-driven market psychology combined with precision RSI analysis! This professional-grade indicator identifies high-probability trading opportunities through:
🔥 Key Features
1. Smart Volume Spike Detection
Auto-detects abnormal volume activity with adaptive threshold
Clear spike labels & multi-timeframe confirmation
RSI-Powered Sentiment Analysis
Real-time Bullish/Bearish signals based on RSI extremes
Combined volume-RSI scoring system (Strong Bull/Bear alerts)
2. Professional Dashboard
Instant sentiment status table (bottom-right)
Color-coded momentum strength visualization
Customizable themes for all chart styles
3. Institutional-Grade Tools
HTF (Daily/Weekly) volume confirmation
EMA trend-filtered momentum signals
Spike-to-Threshold ratio monitoring
4. Trade-Ready Alerts
Pre-configured "Bullish Setup" (Spike + Oversold RSI)
"Bearish Setup" (Spike + Overbought RSI)
Why Traders Love This:
✅ Real-Time Visual Alerts - SPIKE markers above bars + table updates
✅ Adaptive Thresholds - Self-adjusting to market volatility
✅ Multi-Timeframe Verification - Avoid false signals with HTF confirmation
✅ Customizable UI - 10+ color settings for perfect chart integration
Usage Scenarios:
Day Traders: Catch volume surges during key sessions
Swing Traders: Confirm reversals with RSI extremes
All Markets: Works equally well on stocks, forex & crypto
Confirmation Tool: Combine with your existing strategy
Sample Setup:
"Enter long when:
5. RED SPIKE label appears
Table shows 'Oversold RSI'
Momentum status turns 'Bullish'
Volume exceeds daily average (Confirmed)"
📈 Try Risk-Free Today!
Perfect for traders who want:
Clean, non-repainting signals
Institutional-level volume analysis
Professional visual feedback
Customizable trading rules
⚠️ Important: Works best on 15m-4h timeframes. Combine with price action for maximum effectiveness.
📜 Legal Disclaimer
By using this indicator, you agree to the following terms:
Not Financial Advice
This tool provides technical analysis only. It does NOT constitute investment advice, financial guidance, or solicitation to trade.
High Risk Warning
Trading financial instruments carries substantial risk. Past performance ≠ future results. Never risk capital you cannot afford to lose.
No Guarantees
Signals are based on historical data and mathematical models. Market conditions may change rapidly, rendering previous patterns ineffective.
User Responsibility
You alone bear 100% responsibility for trading decisions. We expressly disclaim liability for any profit/loss resulting from this tool's use.
Professional Consultation
Always consult a licensed financial advisor before taking positions. This tool should NEVER be used as sole decision-making criteria.
Educational Purpose
This indicator is provided "as is" for informational/educational use only. No representation is made about its accuracy or completeness.
Third-Party Data
We do not verify exchange data accuracy. Use signals at your own discretion after independent verification.

Vacuum Candles [XrayAlgo]The Vacuum Candles indicator helps traders identify inefficient price movements—where the price moves significantly but lacks sufficient volume to support it. These inefficiencies may signal weak trends, potential reversals, or false breakouts/breakdowns.
Inefficient candles are visually marked with a darker / black body to indicate when the price movement is disproportionate to the volume.
1. Spotting Potential Reversals
When the indicator marks an inefficient candle, it signals that the price movement may be unsustainable.
In an uptrend: A inefficient bullish candle suggests that the uptrend is losing momentum, potentially leading to a downward reversal.
In a downtrend: A inefficient bearish candle signals that the downtrend may be weakening, with a potential bullish reversal.
2. Identifying Breakout and Breakdown Failures
This indicator is useful for recognizing false breakouts or false breakdowns.
If price breaks resistance but the candle is inefficient, the breakout may be weak and could fail quickly.
If price breaks support with an inefficient bearish candle, the breakdown could be a false signal, with price reverting back above support.
3. Recognizing Weak Trends
Inefficient candles help you spot when a trend is losing strength and could soon reverse or consolidate.
In an uptrend: A series of dark body bullish candles suggests that the uptrend may be weakening, signaling a potential correction or trend reversal.
In a downtrend: A series of dark body bearish candles suggests that the selling pressure is weakening, indicating a potential bullish reversal.
4. Fine-Tuning Entries and Exits
Inefficient candles offer an opportunity to fine-tune your entries and exits based on weak price moves.
Entering a trade: An inefficient candle near key support or resistance can indicate a reversal, making it a good entry point for a counter-trend position.
Exiting a trade: If you're already in a trend, and an inefficient candle appears, it suggests the trend is losing strength, indicating it may be a good time to exit before a potential reversal.
5. Fine-Tuning with Inputs
The Vacuum Candles indicator includes two key inputs:
Length: The number of candles used to calculate the average price movement and volume. A longer length (e.g., 20-30) smooths out the inefficiencies, while a shorter length (e.g., 10-15) makes the indicator more sensitive to recent price moves.
Multiplier: Controls the threshold for what is considered an inefficient candle:
A higher Multiplier (e.g., 1.5–3) filters out smaller inefficiencies and focuses on large discrepancies.
A lower Multiplier (e.g., 0.1–0.9) captures even smaller inefficiencies in highly efficient markets.

Premarket VolumeTimeframe: Use on intraday charts (e.g., 1-minute, 5-minute) with extended hours enabled.
Behavior: The plot will appear at 4:00 AM, grow as volume accumulates, and disappear at 9:30 AM each day.
Range Breakout Signals [AlgoAlpha]OVERVIEW
This script detects range-bound market conditions and breakout signals using a combination of volatility compression and volume imbalance analysis. It identifies zones where price consolidates within a defined range and highlights potential breakout points with visual markers. Traders can use this to spot market transitions from ranging to trending phases, aiding in decision-making for breakout strategies.
CONCEPTS
The script measures volatility by comparing the ratio of the simple moving average (SMA) of price movements to their median value. When volatility drops below a threshold, the script assumes a range-bound market. It then tracks the cumulative volume of buying and selling pressure to assess breakout strength. The approach is based on the idea that market consolidation often precedes strong moves, and volume distribution can provide clues on the breakout direction.
FEATURES
Range Detection : Uses a volatility filter to identify low-volatility zones and marks them on the chart with shaded boxes.
Volume Imbalance Analysis : Evaluates cumulative up and down volume over a confirmation period to assess directional bias.
Breakout Signals : When price exits a detected range, the script plots breakout markers. A ▲ symbol indicates a bullish breakout, and a ▼ symbol indicates a bearish breakout. Additional "+" markers indicate strong volume imbalance favoring the breakout direction.
Adaptive Timeframe Volume Analysis : The script dynamically adjusts its volume calculation based on the chart’s timeframe, ensuring reliable signal generation across different trading conditions.
Alerts : Notifies traders when a new range is detected or when a breakout occurs, allowing for automated monitoring.
USAGE
Traders can use this script to identify potential trade setups by entering positions when price breaks out of a detected range. For breakout confirmation, traders can look at volume imbalance cues—bullish breakouts with strong buying volume may indicate sustained moves, while weak volume breakouts may lead to false signals. This script is particularly useful for breakout traders, range traders seeking to fade breakouts, and those looking to automate trade alerts in volatile markets.

Breakout and Retest Signals [AlgoAlpha]OVERVIEW
This script detects breakout and retest signals by identifying key pivot points in price action and analyzing their relationship with historical swing highs and lows. It highlights breakout structures using ATR-based tolerance levels and volume analysis to confirm potential trend continuations or reversals. The script marks significant price levels with dynamic boxes and dashed lines to help traders visualize breakout and retest areas effectively.
CONCEPTS
The script relies on pivot point analysis, a technique used to identify significant price levels where the market has previously reversed. It dynamically tracks a set number of recent swing highs and lows, allowing traders to see if the price is revisiting a previously significant level. The concept of breakouts and retests is widely used in technical analysis to determine potential entry points. A breakout occurs when the price moves beyond a resistance or support level, and a retest happens when the price returns to test that level before continuing in the breakout direction. This script enhances that analysis by incorporating ATR-based tolerance levels, ensuring that price zones are not too large.
FEATURES
Breakout and Retest Markings : Highlights breakout and retest areas with shaded boxes, allowing traders to visualize where price action is confirming key levels.
Volume Delta and Ratio : Analyzes volume at breakout levels to gauge the strength of the move, displaying volume delta information for additional context. The script also displays the ratio of selling to buying at the retest along traders to make better judgement on their entries.
Multi-Timeframe Adaptability : Dynamically adjusts volume analysis to align with the appropriate lower timeframe, ensuring reliable volume comparisons.
Alerts for Breakout and Retest Events : Traders can receive real-time notifications when bullish or bearish breakout retests are detected.
USAGE
This script is best suited for traders looking to identify strong breakout and retest setups across different timeframes. Users can customize the pivot detection period and swing point memory to adjust sensitivity based on their trading style. The ATR length and multiplier allow further refinement of breakout tolerance, reducing noise in volatile markets. The breakout zones are displayed as shaded boxes, where traders can assess whether a price retest is occurring under favorable conditions. Alerts can be set to notify traders of potential trade opportunities.

Volatility-Volume Index (VVI)Volatility-Volume Index (VVI) – Indicator Description
The Volatility-Volume Index (VVI) is a custom trading indicator designed to identify market consolidation and anticipate breakouts by combining volatility (ATR) and trading volume into a single metric.
How It Works
Measures Volatility : Uses a 14-period Average True Range (ATR) to gauge price movement intensity.
Tracks Volume : Monitors trading activity to identify accumulation or distribution phases.
Normalization : ATR and volume are normalized using their respective 20-period Simple Moving Averages (SMA) for a balanced comparison.
Interpretation
VVI < 1: Low volatility and volume → Consolidation phase (range-bound market).
VVI > 1: Increased volatility and/or volume → Potential breakout or trend continuation.
How to Use VVI
Detect Consolidation:
Look for extended periods where VVI remains below 1.
Confirm with sideways price movement in a narrow range.
Anticipate Breakouts:
A spike above 1 signals a possible trend shift or breakout.
Why Use VVI?
Unlike traditional volatility indicators (ATR, Bollinger Bands) or volume-based tools (VWAP), VVI combines both elements to provide a clearer picture of consolidation zones and breakout potential.

Adaptive Sharp Momentum█ Introduction
The Adaptive Sharp Momentum Study has the following all-in-one features:
• A noise-free, trend-following indicator.
• Automatically detects implied tops and bottoms within fast price cycles.
• It identifies price consolidations and periods of indecision; often challenging to spot.
• Includes a unique feature for detecting directional price squeezes.
• An integrated volatility measure helps avoid false signals and clarifies trend direction.
• Lastly, it alerts traders when a volume climax is likely reached during a move.
This study primarily focuses on capturing momentum while concurrently alerting traders to shifting market dynamics, thereby aiding in the decision to either extend a position’s duration or optimize exit timing. The set of analytical tools, deployed alongside the trend-following indicator, are integrated to reflect the concepts outlined above. Furthermore, this framework utilizes distinctive methods for trend identification, consolidation recognition, directional squeeze assessment, and volume climax analysis—approaches that are not currently documented in publicly available resources.
█ Explanation of Core Components
1. Trend Following Consolidated Adaptive Moving Average:
At the core of the study is the Jurik Adaptive Average Curve, a fast-response adaptive moving average refined with an adaptive Relative Strength Index (RSX) function, known as Jurik RSX. This curve displays three trend modes—bullish, bearish, and indecisive—each customizable in color.
Users can adjust parameters such as the Phase and Consolidation Period:
• Phase: Influences the timing of trend signals, accommodating various trading styles. A lower phase value can produce leading signals, while a higher value may result in lagging signals.
• Consolidation Period: Helps filter out false signals. Optimize this period based on the time frame and instrument.
• Momentum Slope Threshold: As mentioned earlier, the Jurik moving average values are consolidated against the Dynamic Jurik RSX. Crossing the slope threshold of the Jurik RSX will trigger consolidation.
The main curve in the middle represents the overall trend. The issue with moving averages is that they work well in trends but when market is in consolidation, many false signals can be generated. The consolidation period acts as a second fast signal curve that helps eliminate the false signals generated through the standard adaptive moving average. This is basically done by measuring the momentum of the move itself through the Jurik RSX. There are other tools in this study that should also help the trader avoid false signals which will be fully described below.
2. Implied Tops and Bottoms
The study also detects Implied Tops and Bottoms during market cycles using the Composite Momentum and Projections. It offers three detection modes:
• Strong Signals: Indicate significant potential reversal points.
• Medium Signals: Typically displayed near the end of a trend, suggesting traders should prepare to exit.
• Rolling Signals: Alert traders to set tight stop losses to secure profits, as the market may be approaching a turning point.
By default, the colors of Rolling Signals and Medium Signals are the same for simplicity.
Note the following:
• The fast and slow period have the most effect on implied tops and bottoms detection.
• Adjusting the main period will also have an overall effect.
The above chart shows rolling tops, rolling bottoms, strong tops, and strong bottoms. A rolling top of bottom indicate an increase in momentum in that direction and thus a tight stoploss would be recommended, while a strong top/bottom indicates that an exit is warranted.
3. Consolidation and Volatility
If enabled, '+' will appear above the ceiling and floor plots if consolidation is detected. Consolidation is detected by using lookback function that determine if price is below a threshold or not. If below, then consolidation would be confirmed. This is accomplished by adjusting the ' Price Consolidation Threshold ' period
The above chart demonstrates detection of consolidation on a 1-minute chart. Also, note the ceiling and floor plot, it expands when volatility is high.
Consolidation detection helps weed out long and short signals indicated by the main curve.
4. Directional Squeeze
Another unique feature of this indicator is the detection of directional price squeeze. Directional squeeze is defined as a price push in the direction indicated by momentum whether upward or downward. This is different from the common squeeze indicators found on the web since this one is detecting a directional push.
The Directional Squeeze feature, indicated by up and down triangles above the main curve, highlights strong trends in the market's current direction:
• Trend Continuation: Allows traders to stay in profitable trades longer during strong trending markets.
• Multiple Modes: Offers single-bar (short-term) and longer-term squeezes. Single-bar squeezes can signal potential market reversals, while longer-term squeezes are useful in sustained trends.
Be mindful that under certain conditions, the directional squeeze could be directionless(sideways) if consolidation is outlined by the indicator. This is another useful feature the trader could utilize. The chart above mostly demonstrates directional squeeze but directionless can also be observed.
5. Volume Volatility and Volume Climax Detection
An essential feature of the Adaptive Sharp Momentum Study is its ability to measure Volume Volatility and detect Volume Climax moments:
• Volume Volatility Measure: Integrated into the study to help avoid false signals by assessing the strength of market moves. It provides better clarity on trend direction by indicating when the market is experiencing significant volume changes.
• Volume Climax Alerts: The study alerts traders when a volume climax is likely reached during a move, which is helpful for identifying potential reversal points or the culmination of a trend. Brighter confirmation signal dots indicate these climaxes, helping traders make timely entry/exit decisions.
• Adjustable Parameters: Traders can set the Volume Volatility Threshold and adjust the Volume Lookback Period to tailor the sensitivity of volume climax detection according to their trading strategy.
5. The indicator contains other useful features:
• Cycles: Helps determine when to enter long or short trades based on upward or downward market cycles. It also aids in recognizing retracement levels during a trend, allowing traders to capitalize on brief counter-trend movements. Those cycles can be observed as the up and down gray lines on the chart.
• Real-Time Table: The table is another visual aid that summarizes the status of each feature in real-time.
█ How to Use this Study Effectively
The main curve in the middle is your final decision point. Prior to entering a trade look for the following:
• Is the market in consolidation? If yes, then you'd be advised not to enter the trade until the study clearly shows no consolidation
• Is the ceil or floor plots showing a strong top or bottom, or even a volume climax in the direction to intend to enter? If yes, then either ensure you enter at a tight stop or don't enter
• Is there an indication of a directional squeeze with no consolidation or volume climax? Then this would be an ideal place to enter. Be mindful though that entering directional squeeze too late is not recommended.
• Once you are in the trade, look at consolidation, implied tops and bottoms, and volume climax to determine exit point. You will quickly realize if you entered a trade prematurely.
• Utilize the directional squeeze and the prevalent trend to help you stay in the trade longer.
• Adjust your stop losses depending on whether you are seeing a rolling implied top/bottom or a strong top/bottom.
• Also, at volume climaxes, be ready to exit. The approach with volume climax detection should be the same as the implied tops/bottoms.
Below is a chart demonstrating trading on a 1-minute chart. The study could be used for any time frame:
** Important Note **
This study relies on volume readings. Incorrect evaluation will be concluded without proper volume data.
█ How the Adaptive Sharp Momentum Works?
---Main Curve - Jurik Moving Average and RSX---
The Jurik Moving Average (JMA) and the Jurik RSX with Fisher transform (Relative Strength Index Extended) are technical tools designed to enhance data processing efficiency. The JMA uses an adaptive smoothing algorithm to dynamically adjust to market conditions, reducing lag while maintaining high responsiveness to price changes. the JMA incorporates a mechanism that determines smoothness based on input volatility. The RSX, on the other hand, tracks relative strength without introducing the overshoots and noise commonly seen in other momentum indicators. It achieves this by applying a yet another JMA smoothing function that ensures stability and consistency, making it a better candidate for identifying shifts.
This is a unique approach, but can simply be equated to two moving averages crossing over, except in this case, the RSX is crossing over with the JMA.
The process of determining market trends and consolidation for the main curve revolves around evaluating multiple conditions and rankings of indicators such as Jurik RSX, Fisher Transform, and Volume-based metrics (Adaptive On Balance Volume and Price Volatility). Here's how consolidation and trends are identified:
1. Trend Override Logic: The core logic evaluates whether specific conditions override the default trend determined by the JMA.
• Bearish Overrides: A trend is classified as bearish if specific conditions involving negative slopes of the RSX, bearish Fisher Transform readings, and other auxiliary rankings (AOBV trend rank or volatility ranks) are met.
• Bullish Overrides: Similarly, bullish trends are determined by the presence of positive RSX slopes, bullish Fisher readings, and supporting AOBV and volatility ranks.
• Neutral Overrides: If neither bullish nor bearish overrides dominate, and conflicting conditions are detected (e.g., a bearish Fisher with a bullish OBV), the trend can be overridden to neutral.
2. Dynamic Slope and Rank Analysis: RSX and Jurik Slopes: The slopes of the RSX and Jurik indicators play an important role. Increasing slopes suggest bullish momentum, while decreasing slopes imply bearish momentum.
3. Narrow Spread Analysis: Consolidation zones are identified by examining conditions like narrow spreads in price action and mixed indicator signals (e.g., a positive RSX slope alongside a neutral or bearish AOBV).
• When consolidation is detected, the system looks for confirming signals (AOBV or Fisher alignment) to determine whether the next move is likely to be bullish or bearish.
4.Fallback Logic:
If no explicit conditions are met for bullish, bearish, or neutral trends, the system defaults to comparing the current and previous values of the Jurik Moving Average. If the JMA is rising, the trend is set to bullish; otherwise, it defaults to bearish.
The process of consolidating The RSX with JMA, attempts to confirm the trend suggested by the Jurik moving average. As shown above, several factors play into this, but it is mostly motivated by the RSX and its slope
-- Detecting Tops and Bottoms --
• Composite Momentum
The Composite Momentum indicator analyzes the market's directional strength to identify implied tops and bottoms, especially at extreme values. It evaluates momentum by categorizing it into ranges that reflect moderate or strong trends for both bullish and bearish conditions. When momentum exceeds a positive threshold, it indicates a strong top, whereas values below a negative threshold then it's a strong bottom.
• Laguerre Dynamic Projection Bands
The Laguerre Dynamic Projection Bands focuses on price positioning within calculated dynamic boundaries. By applying linear regression, it projects upper and lower price bands, which serve as potential resistance and support levels. The oscillator value ranges from 0 to 100, representing the relative position of the current price. A value above 70 indicates the price is near a projected top, while a value below 30 suggests proximity to a projected bottom. Through custom Laguerre smoothing, the setup ensures that its signals remain stable and actionable.
• How They Work Together
The Composite Momentum and Projection Oscillator complement each other in detecting market tops and bottoms. The Projection Oscillator provides an early indication when price nears a critical level, while the Composite Momentum confirms whether the momentum supports the formation of a significant top or bottom.
-- Consolidation Detection, Volatility, and Volume Climax Detection --
• Summary of Consolidation Detection:
Consolidation is identified through a combination of statistical and smoothing applied to price data. The approach calculates deviations around the main plot using squared price inputs, smoothed averages, and adaptive multipliers. These deviations form dynamic upper and lower boundaries that adapt to changing market conditions. The system further evaluates these boundaries against historical bars to calculate a volume percentage, which indicates how often recent price action remains within these bands. A low percentage suggests consolidation, characterized by reduced volatility and price movement confined within a tighter range.
The bands around the main plot are derived from the calculated maximum deviations, creating adaptive ceilings and floors that expand or contract based on market dynamics. The Ceiling and Floor plots represent the outermost boundaries, while additional retracement plots are drawn based on the Composite Momentum wave rank. For example, during an uptrend, the retrace levels adjust upward in fractional steps relative to the deviation, signaling possible resistance levels. In downtrends, similar logic applies in reverse to determine support levels. These bands visually represent the volatility envelope and help contextualize price movements relative to expected ranges. Whenever, low volatility is detected, a visual "+" indicator is added to the plot to highlight that the market is likely in consolidation mode.
• How the Adaptive OBV Applies the Same Logic:
The Adaptive On-Balance Volume (OBV) uses a similar mechanism to detect volume climaxes by analyzing deviations in volume data. Instead of price, the OBV logic applies the squared input and smoothing methods to volume flows. By comparing these deviations to historical norms, the system identifies periods of high or low volatility in volume, which often coincide with potential breakouts or consolidation zones.
• How They Work Together
The consolidation detection process and the adaptive bands work in tandem to provide traders with a clear visualization of market conditions. When consolidation is detected, the dynamic bands narrow and a "+" sign is visualized, signaling reduced volatility and potential breakout opportunities. Similarly, volume-based analysis through the adaptive OBV helps confirm whether a breakout is accompanied by significant volume, adding confidence to trade decisions. Together, they enable anticipation of market shifts.
-- Directional Squeeze --
A directional price squeeze refers to a market condition where price compresses in a particular direction. This provides traders with an opportunity to stay in trades longer by aligning with the prevailing directional bias. This unique concept generates dynamic limits based on lookback period. Their convergence upward or downward is typically a strong indication of a price push toward the respective direction.
In this approach, the system looks at the highest and lowest values of a smoothed momentum reading over a recent period and measures the distance between them. Instead of relying on a static “overbought” or “oversold” line, it calculates new boundaries as a fraction of that distance, scaling the thresholds to match the price behavior. When these dynamically adjusted limits converge, it suggests a “directional squeeze”—meaning price is moving within a more compressed or focused range. Because these boundaries adapt to the market’s own highs and lows, they provide a more responsive indication of when price may be shifting into or out of a strong directional move.
• Determining the Directional Squeeze
Directional squeeze is identified using dynamic limits derived from two key factors:
Schaff Trend Cycle (STC) for single-bar squeezes. and the Slow RSI (SRSI) for multi-bar or longer-term squeezes. Both are utilizing a custom alpha factor for adaptability and conformance with the JMA and Dynamic RSX studies.
• Directional Trend Confirmation:
If the SRSI or STC approaches the limits, additional conditions such as Fisher RSX (momentum signals) and AOBV (volume signals) and the trend already established by the JMA are aligned. If so, then a squeezed in that trend directional is established.
█ Why These Components All Work Together?
The Adaptive Sharp Momentum Study integrates multiple components to provide a framework for analyzing market dynamics. Each feature addresses specific challenges in trading:
• Core Trend Identification:
The Jurik Adaptive Moving Average (JMA) and Jurik RSX ensure better trend detection by reducing noise and dynamically confirming momentum, thus minimizing lag and false signals.
• Implied Tops and Bottoms:
The combination of Composite Momentum and Laguerre Dynamic Projection Bands highlights critical turning points. This dual-layered approach identifies potential reversals and key support/resistance levels with improved clarity.
• Consolidation and Volatility:
Adaptive ceilings, floors, and consolidation detection filter out indecisive market phases. This helps avoid unreliable signals and provides a better perspective on potential breakouts or continuations.
• Directional Squeeze:
The Directional Squeeze feature identifies directional bias in price compression. Its dynamic thresholds adapt to market conditions, aiding in the assessment of strong directional moves.
• Volume Climax:
Volume volatility and climax detection highlight key moments of market activity, aiding in the evaluation of trend strength and potential turning points.
• Integrated Framework:
The integration of these components creates a system where each element complements the others.
This study offers a methodical approach to analyzing trends, momentum, and volatility while filtering noise. It is a tool designed to assist traders in navigating complex market conditions.
█ Disclaimer
This script is provided for educational and informational purposes only and should not be considered financial advice. Trading financial instruments carries a high level of risk and may not be suitable for all investors. Before using this script, please consult with a qualified financial advisor to ensure it aligns with your individual circumstances. The author does not guarantee the accuracy or completeness of the script and is not responsible for any losses or damages that may occur from its use. Use this script at your own risk.
AI Volume Breakout for scalpingPurpose of the Indicator
This script is designed for trading, specifically for scalping, which involves making numerous trades within a very short time frame to take advantage of small price movements. The indicator looks for volume breakouts, which are moments when trading volume significantly increases, potentially signaling the start of a new price movement.
Key Components:
Parameters:
Volume Threshold (volumeThreshold): Determines how much volume must increase from one bar to the next for it to be considered significant. Set at 4.0, meaning volume must quadruplicate for a breakout signal.
Price Change Threshold (priceChangeThreshold): Defines the minimum price change required for a breakout signal. Here, it's 1.5% of the bar's opening price.
SMA Length (smaLength): The period for the Simple Moving Average, which helps confirm the trend direction. Here, it's set to 20.
Cooldown Period (cooldownPeriod): Prevents signals from being too close together, set to 10 bars.
ATR Period (atrPeriod): The period for calculating Average True Range (ATR), used to measure market volatility.
Volatility Threshold (volatilityThreshold): If ATR divided by the close price exceeds this, the market is considered too volatile for trading according to this strategy.
Calculations:
SMA (Simple Moving Average): Used for trend confirmation. A bullish signal is more likely if the price is above this average.
ATR (Average True Range): Measures market volatility. Lower volatility (below the threshold) is preferred for this strategy.
Signal Generation:
The indicator checks if:
Volume has increased significantly (volumeDelta > 0 and volume / volume >= volumeThreshold).
There's enough price change (math.abs(priceDelta / open) >= priceChangeThreshold).
The market isn't too volatile (lowVolatility).
The trend supports the direction of the price change (trendUp for bullish, trendDown for bearish).
If all these conditions are met, it predicts:
1 (Bullish) if conditions suggest buying.
0 (Bearish) if conditions suggest selling.
Cooldown Mechanism:
After a signal, the script waits for a number of bars (cooldownPeriod) before considering another signal to avoid over-trading.
Visual Feedback:
Labels are placed on the chart:
Green label for bullish breakouts below the low price.
Red label for bearish breakouts above the high price.
How to Use:
Entry Points: Look for the labels on your chart to decide when to enter trades.
Risk Management: Since this is for scalping, ensure each trade has tight stop-losses to manage risk due to the quick, small movements.
Market Conditions: This strategy might work best in markets with consistent volume and price changes but not extreme volatility.
Caveats:
This isn't real AI; it's a heuristic based on volume and price. Actual AI would involve machine learning algorithms trained on historical data.
Always backtest any strategy, and consider how it behaves in different market conditions, not just the ones it was designed for.

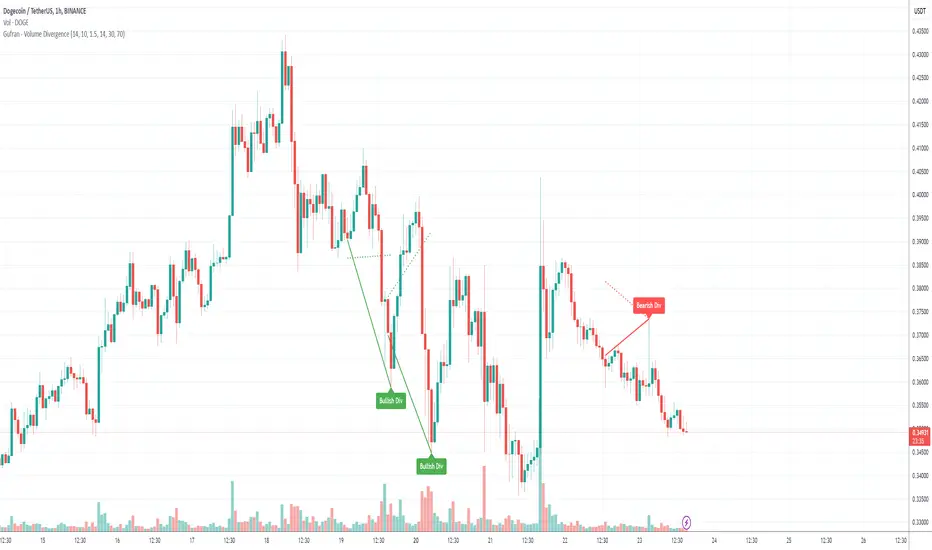
Gufran - Volume DivergenceThis indicator detects bullish and bearish divergences by analyzing price action, volume trends, and RSI (Relative Strength Index) for added confirmation. It highlights key market reversals or trend continuations by identifying when price movement diverges from volume dynamics, providing traders with actionable insights for entry and exit points.
Key Features:
Divergence Detection:
Bullish Divergence: Price makes a lower low, but volume shows higher lows, signaling potential upward reversals.
Bearish Divergence: Price makes a higher high, but volume shows lower highs, signaling potential downward reversals.
RSI Confirmation:
Bullish Signals: Confirmed when RSI is in the oversold zone.
Bearish Signals: Confirmed when RSI is in the overbought zone (optional relaxation of RSI conditions available).
Normalized Volume Analysis:
Volume is scaled to the price range, ensuring clear and meaningful visualization alongside price action.
Customizable Parameters:
Lookback Period: Define how far back the script looks to identify divergences.
Volume Significance: Adjust the threshold for significant volume movements.
RSI Levels: Fine-tune overbought and oversold thresholds for optimal signal accuracy.
Gap Control: Avoid clutter by setting a minimum number of candles between successive divergence signals.
Clear Visual Representation:
Bullish Divergence: Marked with green labels and connecting lines.
Bearish Divergence: Marked with red labels and connecting lines.
Dotted lines show normalized volume divergence, while solid lines indicate price divergence.
Ideal For:
Traders who rely on volume dynamics to validate price movements.
Those looking for an added layer of confidence using RSI to filter false signals.
Swing and intraday traders aiming to identify market reversal zones or continuation patterns.
Customization Options:
Lookback Period: Adjustable range for detecting highs and lows.
Volume Threshold: Define the multiplier for significant volume changes.
RSI Settings: Tailor overbought/oversold levels to suit your trading style.
Relax RSI Condition: Toggle stricter or more flexible conditions for bearish divergences.
How to Use:
Add the indicator to your chart and configure the parameters to fit the asset and timeframe you are trading.
Look for:
Green “Bullish Div” labels near price lows for potential buying opportunities.
Red “Bearish Div” labels near price highs for potential selling opportunities.
Use this indicator in combination with other tools like support/resistance levels, trendlines, or moving averages for a comprehensive trading strategy.
Disclaimer:
This indicator is a tool for educational purposes and should not be used as a standalone trading signal. Always conduct proper risk management and consider additional technical/fundamental analysis before making trading decisions.
Relative Volume Index [PhenLabs]Relative Volume Index (RVI)
Version: PineScript™ v6
Description
The Relative Volume Index (RVI) is a sophisticated volume analysis indicator that compares real-time trading volume against historical averages for specific time periods. By analyzing volume patterns and statistical deviations, it helps traders identify unusual market activity and potential trading opportunities. The indicator uses dynamic color visualization and statistical overlays to provide clear, actionable volume analysis.
Components
• Volume Comparison: Real-time volume relative to historical averages
• Statistical Bands: Upper and lower deviation bands showing volume volatility
• Moving Average Line: Smoothed trend of relative volume
• Color Gradient Display: Visual representation of volume strength
• Statistics Dashboard: Real-time metrics and calculations
Usage Guidelines
Volume Strength Analysis:
• Values > 1.0 indicate above-average volume
• Values < 1.0 indicate below-average volume
• Watch for readings above the threshold (default 6.5x) for exceptional volume
Trading Signals:
• Strong volume confirms price moves
• Divergences between price and volume suggest potential reversals
• Use extreme readings as potential reversal signals
Optimal Settings:
• Start with default 15-bar lookback for general analysis
• Adjust threshold (6.5x) based on market volatility
• Use with multiple timeframes for confirmation
Best Practices:
• Combine with price action and other indicators
• Monitor deviation bands for volatility expansion
• Use the statistics panel for precise readings
• Pay attention to color gradients for quick assessment
Limitations
• Requires quality volume data for accurate calculations
• May produce false signals during pre/post market hours
• Historical comparisons may be skewed during unusual market conditions
• Best suited for liquid markets with consistent volume patterns
Note: For optimal results, use in conjunction with price action analysis and other technical indicators. The indicator performs best during regular market hours on liquid instruments.
