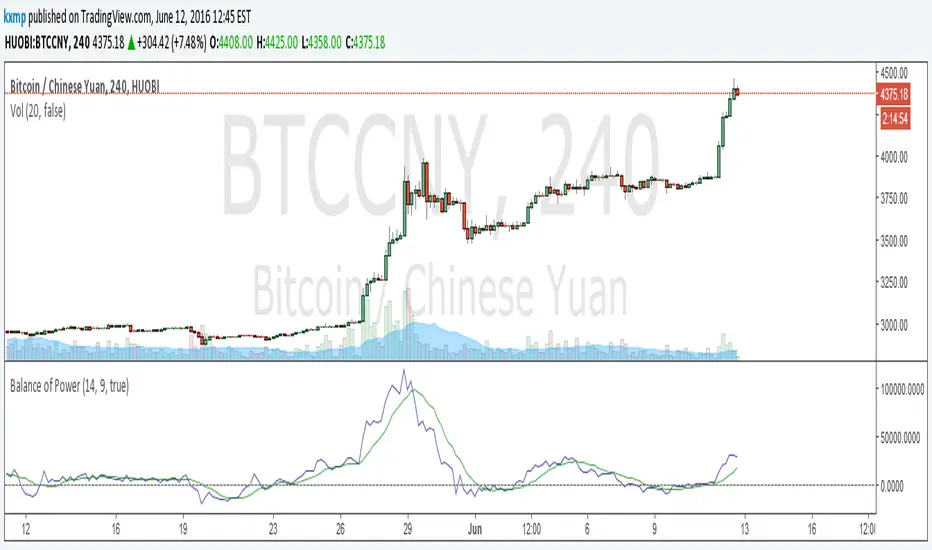
Volume weighted Balance of PowerIt's a simple indication. I multiplied the output of bop with volume, make it more smoother. Indicador Pine Script®por c07311227
Colored Volume Bars standard deviation from meanThe colour bars: Green: Price up - Volume > 2 x STD of last 21 bars Blue: Price up - Volume > 1 x STD of last 21 bars Maroon: Price down - Volume > 2 x STD of last 21 bars Purple: Price down - Volume > 1 x STD of last 21 bars Grey: not high volume bar Green line: 2 bar sma Red line: 8 period sma of the greenline Bollinger band: 55 period sma of the 21 period sma with bands 1.618 deviation from the meanIndicador Pine Script®por SteynTrade1111261
Colored Volume Bars standard deviation from meanThe colour bars: Green: Price up - Volume > 2 x STD of last 21 bars Blue: Price up - Volume > 1 x STD of last 21 bars Maroon: Price down - Volume > 2 x STD of last 21 bars Purple: Price down - Volume > 1 x STD of last 21 bars Grey: not high volume bar Green line: 2 bar sma Red line: 8 period sma of the greenline Bollinger band: 55 period sma of the 21 period sma with bands 1.618 deviation from the meanIndicador Pine Script®por SteynTrade116
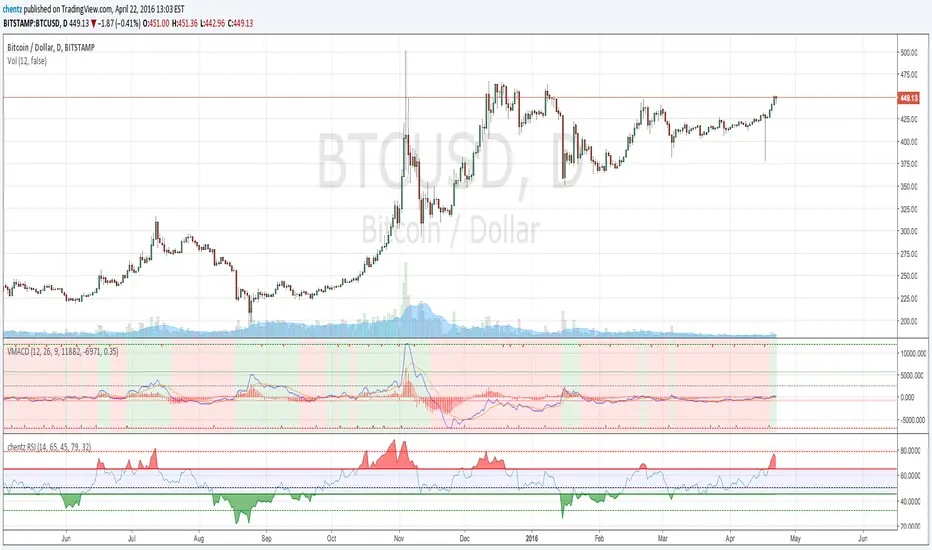
chentz Volume MACDA MACD indicator over the volume to see pattern over the volume. Adaptation of script from and using the theoretical foundation from www.moneyshow.comIndicador Pine Script®por chentz131
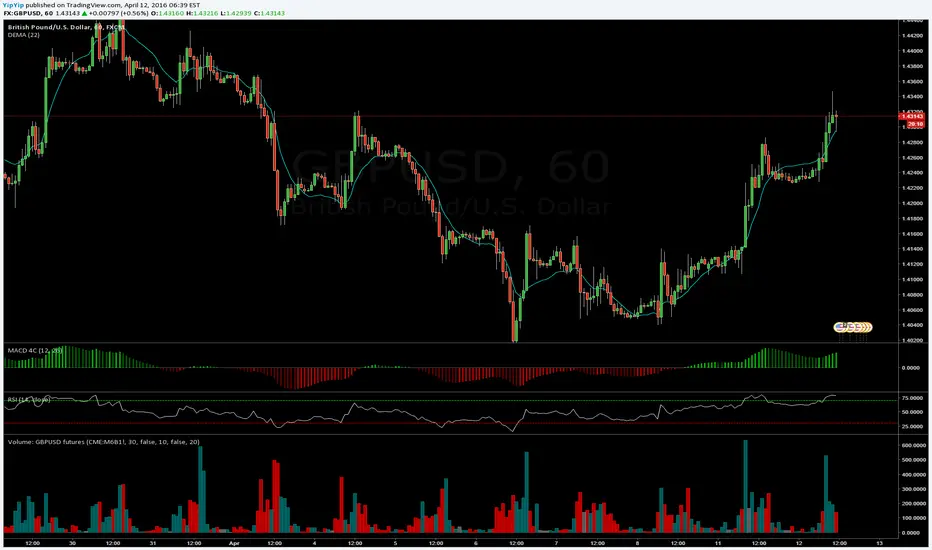
Volume+ (GBPUSD futures)Futures Volume GBPUSD pair cross using CME Futures Volume Indicador Pine Script®por YipYip53
Indicator420double hull moving average crossover hull moving average / volume weighted moving average crossover Red dot = SELL Green dot = BUY or Longest MA color change to green = BUY Longest MA color change to red = SELL by SeaSide420Indicador Pine Script®por SeaSide420Atualizado 33254
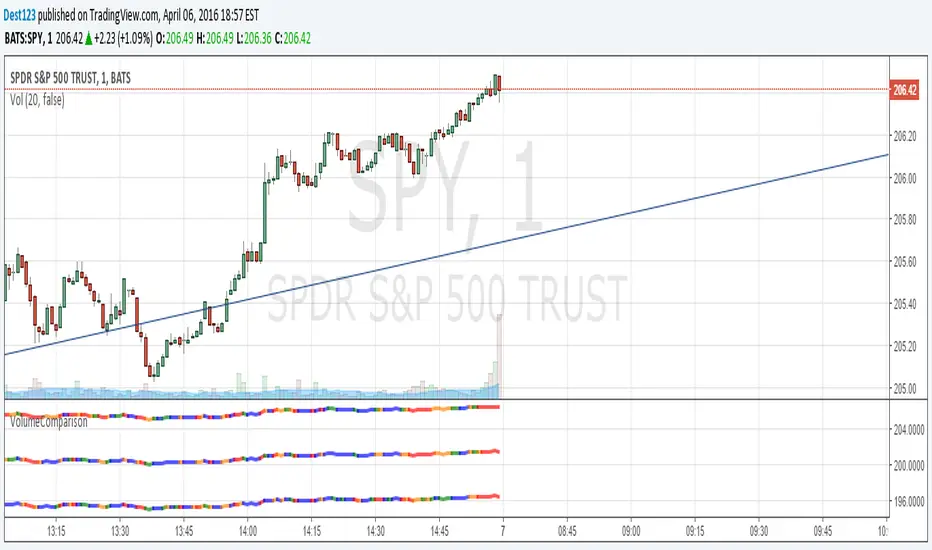
VolumeVsVSMAComparisonVolume vs the volume sma . Blue is low volume , green is normal, yellow is high, and red is very high. Top bar is 100sma, middle is 25sma, and bottom is 5 sma .Indicador Pine Script®por Dest12311503
VolumeVsVSMAComparisonShows 3 bars. One for the 100sma, one for 25sma, and one for 5sma. The bar color is blue if it's "low volume" compared to the sma, green if it's about average, yellow if it's high, and red if it's very high. Top bar is 100sma, middle is 25, and bottom is 5Indicador Pine Script®por Dest123123
BUY & SELL PRESSURE by RegressionBUY & SELL PRESSURE by Regression Analysis at candle price/volume (Rate-Of-Change) Ver. 3 By Ricardo M Arjona @XeL_Arjona DISCLAIMER: The Following indicator/code IS NOT intended to be a formal investment advice or recommendation by the author, nor should be construed as such. Users will be fully responsible by their use regarding their own trading vehicles/assets. The embedded code and ideas within this work are FREELY AND PUBLICLY available on the Web for NON LUCRATIVE ACTIVITIES and must remain as is. WHAT'S THIS? This is my 3rd. revision of the original implementation for AmiBroker by Karthik Marar's of it's BUY AND SELL PRESSURE INDICATORS but this time, constructed under a complete REGRESSIVE ANALYSIS premise based in Rate Of Change (A kind of Slope but measured in % Performance). Some minimal adaptation's (and cleaning) have been made: Instead of simple Range calculation at price, Rate Of Change (Regressive) is used. Oscillator of Pressure can be deactivated in favor of a simple RoC Cumulative Pressures at candle. Oscillator can read Volume data from external tickers for accurate Index calculation. ( NYA can use TVOL as example.) Code is small, cleaner and faster =) ! Cheers! Any feedback will be welcome... @XeL_ArjonaIndicador Pine Script®por xel_arjona22241
4MA StrategyUses 4 Ma cross... Double Hull Moving Averages Volume Weighted Moving Average Weighted Moving Average <<<<< by SeaSide420 >>>>>>Estratégia Pine Script®por SeaSide42066 1 K
[RS]Price Divergence Detector V2UPDATE: added CCI to the list of oscilators.Indicador Pine Script®por RicardoSantosAtualizado 2525 3.6 K
[RS]Price Divergence Detector V1Update: added Fisher Transform to the list of oscillators.Indicador Pine Script®por RicardoSantos1111471
Volume SpikesPlots volume the same as the built-in indicator. However, this indicator colors the column according to its change relative to the previous column. In other words, this indicator displays a green column on increased volume and a red bar on decreased volume.Indicador Pine Script®por nboone215
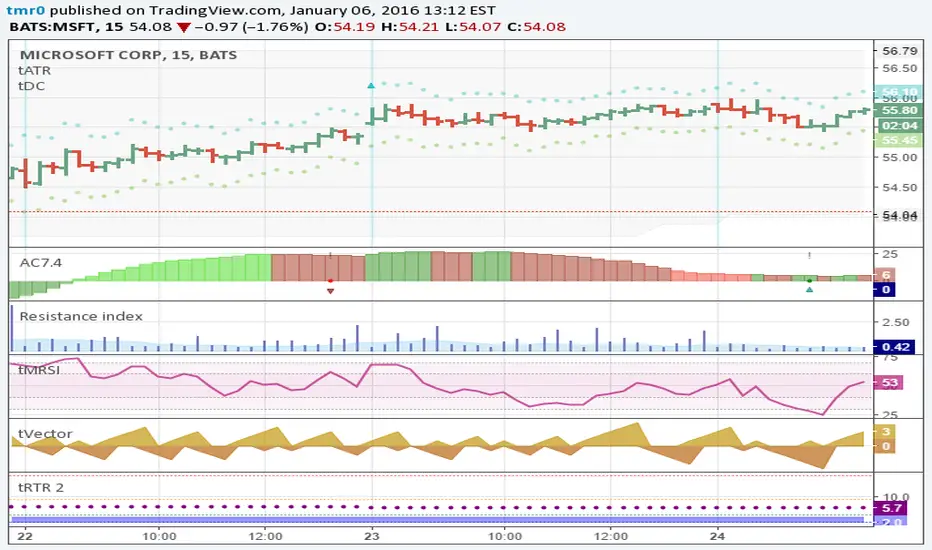
Resistance indexHistogram shows the market resilience as volume ratio to the true range. Area is EMA volume.Indicador Pine Script®por tmr0152
On Balance Volume Analysis [Albert]OBV indicator with moving averages on it.Indicador Pine Script®por Albert22291
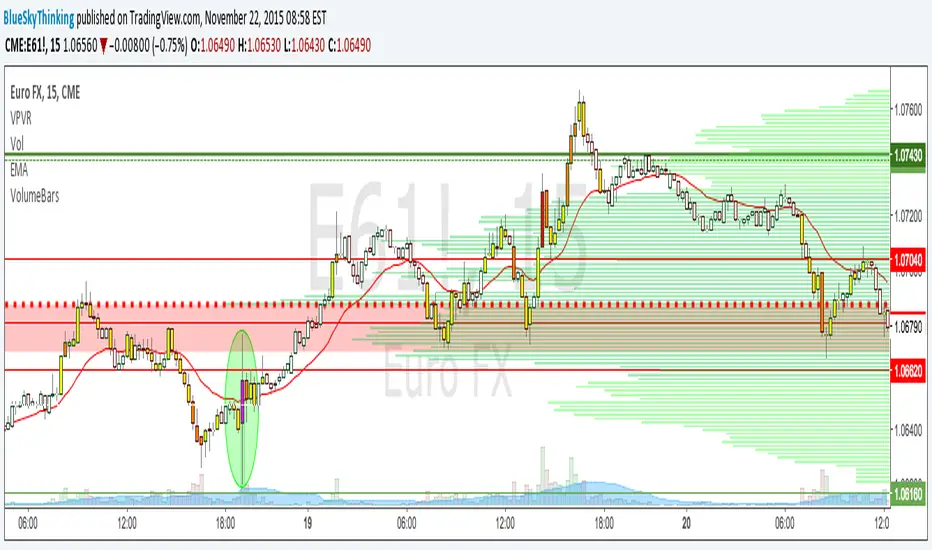
VolumeBarsHighlights the candles with higher volume.. yellow, orange, red or purple. Easy to spot buyers and sellers. Best use on stocks or futures (as forex volume depends on broker).Indicador Pine Script®por BlueSkyThinking55347
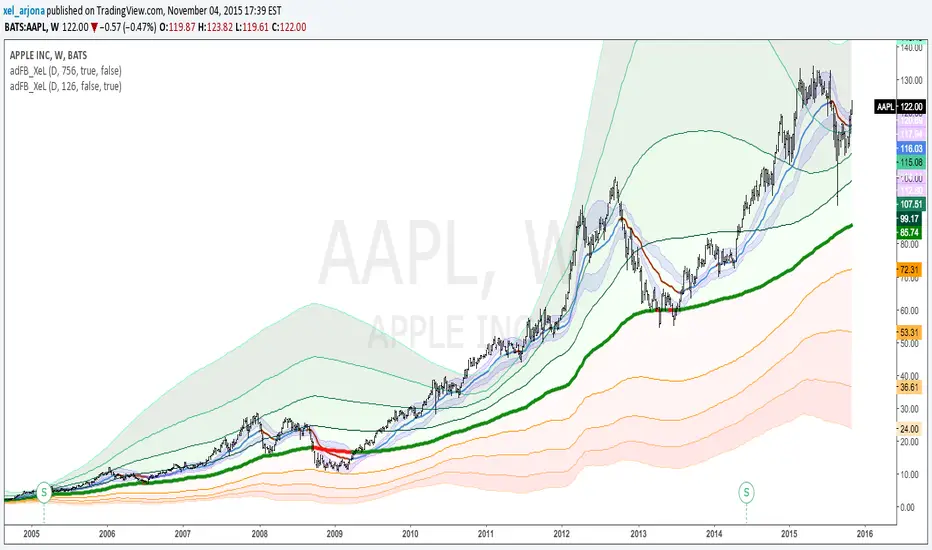
EVWMA Acc/Dist. Pressure & FRACTAL BANDS by @XeL_ArjonaEVWMA ACCUMULATION/DISTRIBUTION PRESSURE & FRACTAL BANDS Version: 3.0 @ 4.11.2015 By Ricardo M Arjona @XeL_Arjona DISCLAIMER: The following indicator IS NOT INTENDED TO BE A FORMAL INVESTMENT ADVICE OR TRADING RECOMMENDATION BY THE AUTHOR, nor should be construed as such. Users will be fully responsible by their use regarding any kind of trading vehicles or assets. The following script and ideas within this work are FREELY AND PUBLICLY availables on the Web for NON LUCRATIVE ACTIVITIES and must remain as is. -== IMPORTANT: THIS IS AN EXPERIMENTAL INDICATOR ==- What is this? This work is a derivation of my previous Accumulation/Distribution scripts publicly available in TradingView in an effort to clean, speedup and make the indicator cleaner as possible. The current indicator is based on already tested and Mathematically proof concepts as described below: The MAIN Rolling back median line or "Vortex" is constructed by a simple and equal weighting of distributed volume along the candle range (This approach is just an "estimator" of Buyers Vs. Sellers given the lack of tick resolution in TradingView, a real "DELTA" can only be 100% reliable with Market Depth (Ask/Bid ticks)), Given this, with each "volume weights", the price is post-processed against a true statistical Average calculation formerly: ELASTIC VOLUME WEIGHTED MOVING AVERAGE. The FRACTAL BANDS are just Standard Deviation's with GOLDEN RATIO as multiplier (1.618) derived one from each other within it's origin on the former "Vortex Median". The Standard Error Bands comply as the original indicator described by Jon Andersen but given the true statistical nature of EVWMA, the original LinReg line has been substituted by the former. ALL NEW IDEAS OR MODIFICATIONS to this indicator are welcome in favor to deploy a better technical tool. Any important addition to this work MUST REMAIN PUBLIC by means of CreativeCommons CC & TradingView user rules. (C) 2015 @XeL_ArjonaIndicador Pine Script®por xel_arjona77939
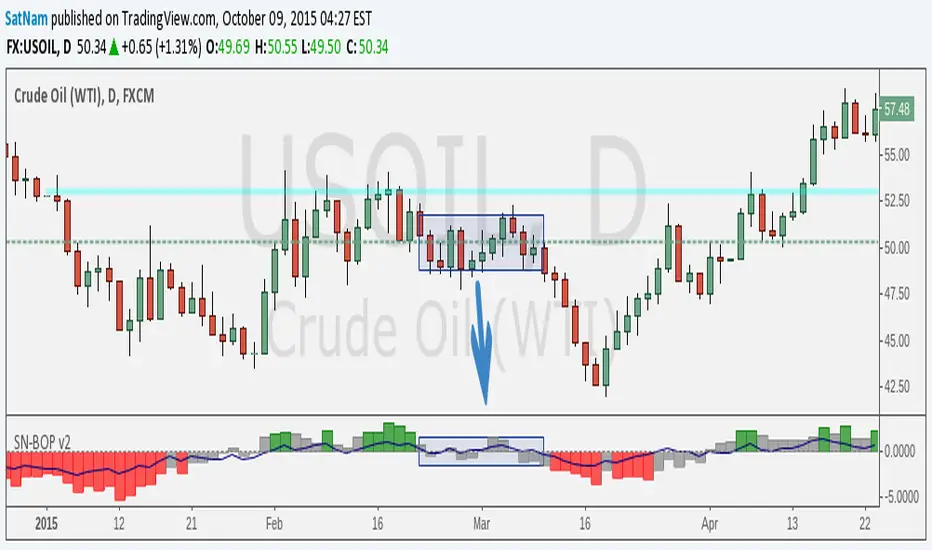
SN Smoothed Balance of Power v2Hi all, here is an updated version of the indicator script I published yesterday. The goal of this indicator is to try and find darkpool activity. The indicator itself is not enough to fully identify darkpool but it should be able to detect quiet accumulation. What makes this Balance of Power different from others on TV is that it is smoothed by using a moving average. Notes: - The values that are default are completely arbitrary except for the VWMA length (a 14-day period for the 1D chart is the norm). For instance the limit where it shows red/green I picked because it works best for the 1D chart I am using. Other TF's and charts will need tweaking of all the values you find in the options menu to get the best results. - I modified the indicator such that it is usable on charts that do not show volume. HOWEVER, this chart is default to NYMEX: CL1!. To get different volume data this needs to be changed in the option menu. - I am in no way an expert on darkpool/HFT trading and am merely going from the information I found on the internet. Consider this an experiment. Credits: - Lazybear for some of the plotting-code - Igor Livshin for the formula - TahaBintahir for the Symbol-code (although I'm not sure who the original author is...)Indicador Pine Script®por SatNam44517
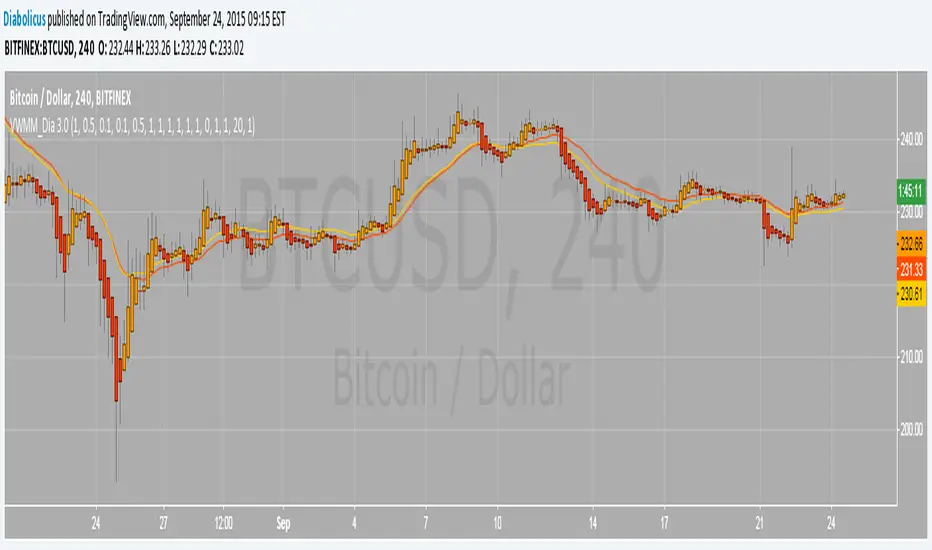
Volume Weighted Market Mean 3.0 [Dia]150924 - v3.0 This script is a complete rewrite of the previous version here . It gathers market data from up to 8 different Bitcoin exchange pairs (8 is maximum due to script limitations).The influence of each single exchange can be customized individually, default is 50% for 0-fee exchanges, 10% for futures and 100% for all others. For each single exchange a standard deviation from the composite mean price and a average price range are determined. To make data from exchanges with different liquidity comparable, all single exchange price ranges are normalized to the range of the composite mean price. To make data from exchanges with different fee structure (= exchanges that constantly trade at a premium / discount) comparable, all single exchange prices are corrected by their respective standard deviations. To account for trade volume, all price data is weighted by the current candles volume. - optional Heikin Ashi candle display - optional EMAs - lots of switches to play around with ;-) Indicador Pine Script®por Diabolicus11146
BTC Volume Index 1.1 beta [Dia]Indicator calculates total volume across multiple bitcoin exchanges. The influence of each exchange can be adjusted seperately. 0 fee exchanges default to 50% 0 fee futures default to 10% Define custom lookback periods for price breakout detection. Look for low-volume price reversals in those candles immediately following high volume peaks. The lower the volume and the greater the open/close price difference of that 2nd candle is compared to the previous one, the higher the likelihood of a local top/bottom being in. Note: Bar highlighting is still experimental, future versions will include better filtering options. Use for confirmation only, not as standalone trading system.Indicador Pine Script®por Diabolicus57
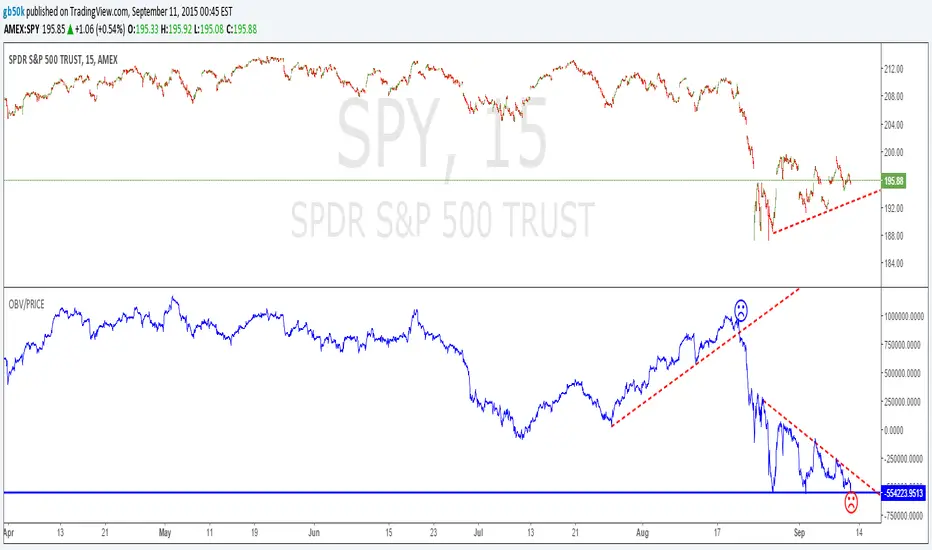
On Balance Volume/PriceFirst, look at the chart, then read. Use OBV/Price to see a price adjusted by 'On Balance Volume' - (OBV), a momentum indicator that measures positive and negative volume flow, was developed by Joseph Granville and introduced in 1963. The indicator, together with trend lines, provides good entry/ exit points. In the chart note the exit point before the crash. Also, note the "wedge" - a bit lees optimistic that the 'price only' wedge for SPY. Indicador Pine Script®por gb50k33784
[RS]Price Divergence Detector V0Price Overlay for Multiple Method Choice Divergence Detection:Indicador Pine Script®por RicardoSantos33837
Dollar normalized volumeAn indicator that multiply the closing price with the current volume. (close X volume) This will show the relative interest in the underlying asset regardless of the price change over time. For the case of FXCM, when the price fell from $16 to $1, its volume spiked 16x at the same time given the fact that 16x more shares can now be purchased with the same amount of dollar. Enjoy! and remember to give a thumbs up. Indicador Pine Script®por LastBattle55480