Volatility Spike EstimatorPlots the Average True Range (ATR), its historical mean, the upper threshold for a volatility spike, and uses background color to show the likelihood of a volatility spike based on the current ATR value.
Green background indicates an increased likelihood of a volatility spike, while red background means a spike might have already occurred or be in progress.
Update: In this version, we added a short-term ATR calculation with an adjustable input parameter, shortTermATRLength. The likelihood of a volatility spike is now estimated based on the short-term ATR instead of the original ATR. This change makes the indicator more sensitive to recent market conditions and can help detect potential volatility spikes more quickly.
Volatilitytrading

Volatility MeterThe title is quite self explanatory. It is a Volatility Meter based on Bollinger Bands Width and MA.
These parameters can be selected by users in settings tab:
- Basic Bollinger Bands Parameters: length , standart deviation and source
- Timeframes: 1h, 2h, 3h and 4h
If the indicator is red it means volatility is high in the market. If it is white , it means that market is not volatile right now.
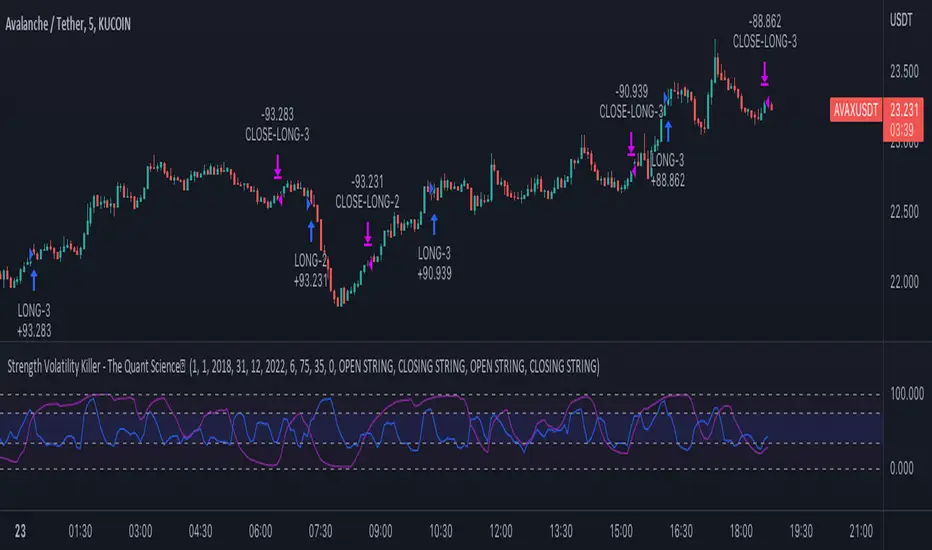
Strength Volatility Killer - The Quant ScienceStrength Volatility Killer - The Quant Science™ is based on a special version of RSI (Relative Strength Index), created with the simple average and standard deviation.
DESCRIPTION
The algorithm analyses the market and opens positions following three different volatility entry conditions. Each entry has a specific and personal exit condition. The user can setting trailing stop loss from user interface.
USER INTERFACE SETTING
Configures the algorithm from the user interface.
AUTO TRADING COMPLIANT
With the user interface, the trader can easily set up this algorithm for automatic trading.
BACKTESTING INCLUDED
The trader can adjust the backtesting period of the strategy before putting it live. Analyze large periods such as years or months or focus on short-term periods.
NO LIMIT TIMEFRAME
This algorithm can be used on all timeframes.
GENERAL FEATURES
Multi-strategy: the algorithm can apply long strategy or short strategy.
Built-in alerts: the algorithm contains alerts that can be customized from the user interface.
Integrated indicator: indicator is included.
Backtesting included: quickly automatic backtesting of the strategy.
Auto-trading compliant: functions for auto trading are included.
ABOUT BACKTESTING
Backtesting refers to the period 13 June 2022 - today, ticker: AVAX/USDT, timeframe 5 minutes.
Initial capital: $1000.00
Commission per trade: 0.03%
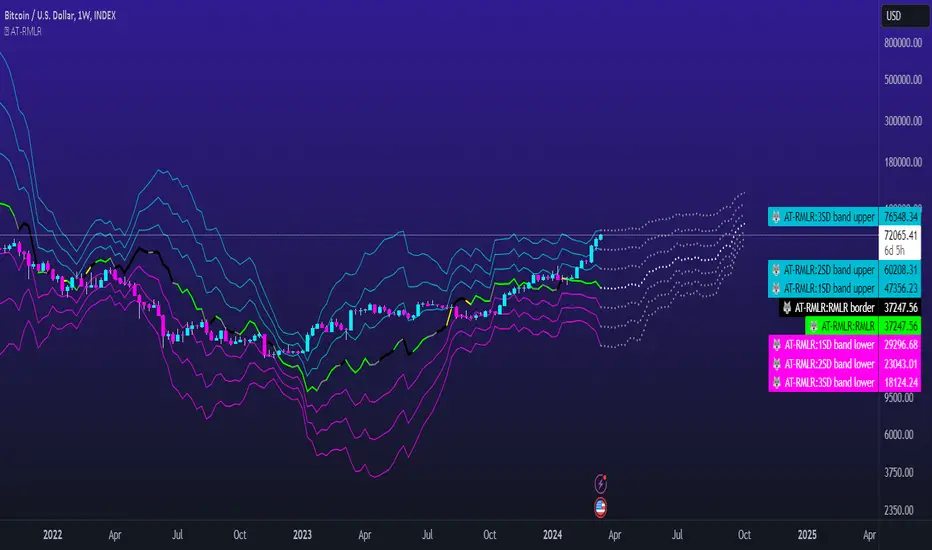
AT - Reverse Mean Log Returns - Coder WolvesReverse Mean Log Returns (RMLR) indicator
Here at Alpha Trading, we create indicators that are based on Volatility, Probability and Statistics. We always add our own secret sauce, to turn mathematical principles into indicators that are tradeable. If you have been here for a while, or even if you are new, you have most likely heard us talk about Returns in our other indicators such as the Wolfsbane, RMS Z-Score or some of our returns based oscillators.
Theory
Log Returns of Price are commonly used to normalize price action. In contrast to price which never reverts to the mean, log returns are mean reverting.
In addition we assume that log returns are normally distributed, whereas price is never normally distributed. Price is log normal distributed, therefore it is wrong to calculate standard deviation directly on price, like in Bollinger bands. But for the normal distributed log returns it is mathematically correct and can be used to find extremes of the market.
Why did we create the RMLR
What if we could see that mean (where the log returns will reverse) and market extremes (multiples of standard deviations) on a price scale? Well, that's our Reverse Mean Log Returns (RMLR) indicator.
RMLR shows the Reverse Mean of Log Returns and their first, second and third standard deviation. These levels represent the probability that the current price action will not exceed that certain band. For the 1st level (1st std-dev) it is 68.3%, for the second level 95.4% and the third 99.7% that the price will close not exceeding that level, assuming normal distribution of underlying log returns.
Meaning of the future prediction of RMLR
If the Direction of past Price Action is UP then the Direction of the related RMLR IN THE FUTURE will most probably be UP.
If the Direction of past Price Action is DOWN then the Direction of the related RMLR IN THE FUTURE will most probably be DOWN.
In other words, Past Price Action of any specific candle determines the Direction of the Future RMLR produced from that past PA candle.
In other words, when RMLR is working on normal settings, Past Price Action does in fact predict future RML Returns.
RMLR Input Settings
SAMPLE SIZE - the lookback period.
SHOW STANDARD DEVIATION BANDS - the ability to choose 1st, 2nd or 3rd standard deviation ranges.
SWITCH BAR COLOR BY TREND - when selected the bar color will show bullish trend above the mean and bearish trend below the mean.
SHOW RMLR PREDICTION - when selected you can view the predicted future RMLR based on past price action.
LOCK ON - options to choose what future prediction you want to view. mean, 1st, 2nd and 3rd standard deviations are your choices.
OVERRIDE CONTINUOUS MARKET PROTECTION - when selected you can view the future RMLR prediction on non-continuous markets. USE AT YOUR OWN RISK.
CORRELATION COEFFICIENT SETTINGS - option to set the lookback length for the correlation between the RMLR and price action.
RMLR DISPLAY SETTINGS - allows you to choose from 5 different color schemes for the inner, 1st and 2nd outside lines for the RMLR. You can also adjust the border line widths and the colors for correlation coefficient direction and significant correlation.
DIRECTION PREDICTOR COLORS - allows you to set up predictor lengths, sensitivity settings and color options.
DIRECTION TREND COLORS - allows you to set up trend lengths, sensitivity settings and color options.
References
quantivity.wordpress.com
Volatility Trigger IndexThe script allows to assess the volatility of an asset.
It works by calculating the rate of change and the standard deviation.
The index is useful to determine the lowest volatility periods (could be useful to look strategies) and also it determine the highest volatility periods (maybe for exits or partial closes).
It has 3 iputs:
Lenght.
Low volatility value.
High volatility value.
The low and high values are set after a visual inspection. The values changes in each time frame. Usually when the timeframe is higher the value of the index is higher as well. So the low and high levels must be changed after each time frame set.
As an idea could be used in combination with any moving average to determine the market direction and the index used as a trigger.

VIX Volatility Trend Analysis With Signals - Stocks OnlyVIX VOLATILITY TREND ANALYSIS CLOUD WITH BULLISH & BEARISH SIGNALS - STOCKS ONLY
This indicator is a visual aid that shows you the bullish or bearish trend of VIX market volatility so you can see the VIX trend without switching charts. When volatility goes up, most stocks go down and vice versa. When the cloud turns green, it is a bullish sign. When the cloud turns red, it is a bearish sign.
This indicator is meant for stocks with a lot of price action and volatility, so for best results, use it on charts that move similar to the S&P 500 or other similar charts.
This indicator uses real time data from the stock market overall, so it should only be used on stocks and will only give a few signals during after hours. It does work ok for crypto, but will not give signals when the US stock market is closed.
**HOW TO USE**
When the VIX Volatility Index trend changes direction, it will give a green or red line on the chart depending on which way the VIX is now trending. The cloud will also change color depending on which way the VIX is trending. Use this to determine overall market volatility and place trades in the direction that the indicator is showing. Do not use this by itself as sometimes markets won’t react perfectly to the overall market volatility. It should only be used as a secondary confirmation in your trading/trend analysis.
For more signals with earlier entries, go into settings and reduce the number. 10-100 is best for scalping. For less signals with later entries, change the number to a higher value. Use 100-500 for swing trades. Can go higher for long swing trades. Our favorite settings are 20, 60, 100, 500 and 1000.
***MARKETS***
This indicator should only be used on the US stock markets as signals are given based on the VIX volatility index which measures volatility of the US Stock Markets.
***TIMEFRAMES***
This indicator works on all time frames, but after hours will not change much at all due to the markets being closed.
**INVERSE CHARTS**
If you are using this on an inverse ETF and the signals are showing backwards, please comment with what chart it is and I will configure the indicator to give the correct signals. I have included over 50 inverse ETFs into the code to show the correct signals on inverse charts, but I'm sure there are some that I have missed so feel free to let me know and I will update the script with the requested tickers.
***TIPS***
Try using numerous indicators of ours on your chart so you can instantly see the bullish or bearish trend of multiple indicators in real time without having to analyze the data. Some of our favorites are our Auto Fibonacci, Directional Movement Index, Volume Profile with buy & sell pressure, Auto Support And Resistance, Vix Scalper and Money Flow Index in combination with this Vix Trend Analysis. They all have real time Bullish and Bearish labels as well so you can immediately understand each indicator's trend.

TradeChartist Actuator™TradeChartist Actuator is an extremely functional indicator that converts the price action volatility and momentum into a meaningful trading system (based on user defined Standard Deviation Factor), that consists of expanding/contracting Volatility Range Bands, Dynamic Trend Support/Resistance Bands and 2 types of Breakout Signals in a visually stunning design. The script also neatly packs in ZigZag & manual/automatic Fibonacci Retracement tools, option to filter the signals using an external filter and other useful extras like ™TradeChartist Dollar Candles and much more.
===================================================================================================================
™TradeChartist Actuator User Manual
█ Actuator Range Bands
Actuator Range Bands consists of a Mean line, an Upper Band and a Lower Band which are based on user defined Standard Deviation Factor (Default - 1.618, Min - 0.5, Max - 2). The 1.618 factor works extremely well as the unnecessary volatility data of the bands are eliminated by Actuator's logic. In my personal tests, 1.618 works consistently better than any other value in visually showcasing the true volatility range. By eliminating the unnecessary volatility data from the original non-stabilized bands, Actuator helps detect price momentum by detecting two types of breakouts.
Bands Breakout - Filtered
When the price breaks out of the upper or lower band after a trend, there is a strong possibility of a reversal especially when the volatility expansion/contraction takes place. This is detected using a built in filter with the Filtered Bands Breakout and the user can choose to use the closing price or High/Low price as the trigger for breakouts. This trade setup is very useful especially at zones where the Actuator Range Bands contract or squeeze after an expansion as shown in the OANDA:XAUUSD 1hr chart below.
Also, after a consistent expansion of the bands with price trending in the upper channel or the lower channel, users can spot good profit taking or Short trade opportunities with confirmation of overbought price and if possible a strong bear divergence as show in the BINANCE:LUNAUSDTPERP 1hr chart below.
It can be seen from the chart above that even though Actuator is designed to detect Extreme Bands Breakout using High/Low price, it is done with a little bit of filtering by the script logic and hence didn't generate a Bear signal at the lower band support zone.
Mean Breakout - Filtered
In most Mean Reversion models, mostly oscillators, the mean plays an important role in helping traders predict the price dynamic, but it also presents a challenge whether that mean will act as support or resistance so the trader can take a position that will have a high probability of success. Filtered Mean Breakout helps exactly to identify the price dynamic at the mean zone and helps reduce the dilemma. Actuator uses Volatility Trend and Momentum of the price action at mean to determine Bull/Bear breakouts. Following NASDAQ:AAPL 1hr chart shows an example of 2 instances of Filtered Mean Breakout detection, one bull and one bear and further area where no Breakout was detected in spite of price crossing the mean.
This Breakout type is really helpful in spotting early moves and also reduces the high volatility risk of Extreme Bands Breakout in some cases.
===================================================================================================================
█ External Filter
Actuator breakout signals can be further filtered using the feature of connecting an external signal as a trade filter.
External filter like RSI , MACD etc. can be used to filter breakouts by connecting to ™TradeChartist Actuator under ╔═══ 𝗣𝗹𝘂𝗴 𝗙𝗶𝗹𝘁𝗲𝗿 𝗵𝗲𝗿𝗲 ═══ 🔌 dropdown by enabling 𝐔𝐬𝐞 𝐄𝐱𝐭𝐞𝐫𝐧𝐚𝐥 𝐅𝐢𝐥𝐭𝐞𝐫.
To get the external filter to work, 𝐒𝐢𝐠𝐧𝐚𝐥 𝐓𝐲𝐩𝐞 must be set right. For plots that are non oscillatory like Moving Averages, Super Trend etc., choose type as Non Oscillatory and for Oscillators like RSI , CCI , MACD etc., choose type as Oscillatory .
For Oscillators, levels must be specified for 𝐎𝐬𝐜𝐢𝐥𝐥𝐚𝐭𝐨𝐫 𝐁𝐮𝐥𝐥 𝐅𝐢𝐥𝐭𝐞𝐫 𝐯𝐚𝐥𝐮𝐞 and 𝐎𝐬𝐜𝐢𝐥𝐥𝐚𝐭𝐨𝐫 𝐁𝐞𝐚𝐫 𝐅𝐢𝐥𝐭𝐞𝐫 𝐯𝐚𝐥𝐮𝐞, especially if the Oscillator doesnt have 0 as midline, like RSI . Even for 0 mid oscillators like CCI , filter levels like 100/-100 work effectively to filter noise.
Use 𝐁𝐮𝐥𝐥/𝐁𝐞𝐚𝐫 𝐁𝐚𝐜𝐤𝐠𝐫𝐨𝐮𝐧𝐝 𝐅𝐢𝐥𝐥 under Actuator Visuals section to paint the trade zones background. It helps visually see the effect of filters on the breakout entries and also the trade performance.
The following chart shows the Filter settings with ™TradeChartist Momentum Drift Oscillator connected to Actuator as Oscillatory signal with filter values 0.
The two example charts of 1hr BINANCE:BTCUSDT below shows the difference in Actuator signals based on Oscillatory signal from ™TradeChartist Momentum Drift Oscillator and the difference can be seen from the highlighted Bull/Bear Background Fill.
Without External Filter
With External Filter
===================================================================================================================
█ Dynamic Trend Support/Resistance Bands
In addition to Volatility Range Bands, Actuator also plots Dynamic Trend Support and Resistance bands that are more sensitive to price action and helps the user determine growing support/resistance which is indicated by coloured dots. These dots normally appear when the Support or Resistance stays at the same level for a few bars and change between Bull and Bear colours based on how the price interacts with them as shown below.
===================================================================================================================
█ Useful Trade Tools
™TradeChartist Dollar Candles
Dollar Candles help detect the volatility exhaustion prices and plots $ signs to help the trader take profits or move stop loss levels to secure gains. The $ signs do not appear for every trade zone, but whenever price hits a critical level, it shows up above price bar (for Bull trend) or below price bar (for Bear trend) in real time. Users can also set alerts for Dollar Candles with Once Per Bar setting. The Daily NASDAQ:TSLA chart below shows the Dollar Candles on both Bull and Bear trends.
It is important to note that taking pockets of profits on a leveraged trade position or moving up stop loss to maximize trend gains at $ candles will help increase Average Profitability Per Trade (APPT) .
Bull/Bear Background Fill
Bull/Bear Background Fill paints the trade zones in Bull and Bear colours. This helps visualize the difference in trade zones when testing various settings and also helps analyze past performance of Actuator Signals with or without the use of External Filter.
Entry Stop Loss Reference
Reference zone for stop loss has always been a tricky one for traders. Using a fixed percentage stop at entry may not be best during high volatility moves. Over the extensive period of Actuator testing, a simple solution to this problem was found. The previous trend's Range Bands Mean Line served as a perfect reference point for Entry Stop. Also while analysing this Mean line, it was found to be a perfect horizontal support/resistance line and also helped detect unproductive trades. The example 15m chart of NASDAQ:AMD shows how the Entry Stop Loss Reference performed.
Stop Line Touch Points plot orange touch points on the Stop Line whenever the price hits it during the trade.
Actuator Colour Bars
Actuator Colour Bars paints the Momentum Strength on the price bars. This helps visually see the price bars venturing into the Overbought or the Oversold zones. Also, this feature also helps spot divergences as higher highs or lower lows with less intense Bull/Bear colour than the previous high/low shows diminishing momentum as shown in the 1h chart of OANDA:GBPJPY below.
===================================================================================================================
█ ZigZag & Fibonacci Toolkit
Actuator plots developing and completed ZigZags based on Bull and Bear trend depending on the Breakout Type and Breakout Price from the settings.
Option to enable or disable 𝐙𝐢𝐠𝐙𝐚𝐠 𝐂𝐨𝐧𝐧𝐞𝐜𝐭𝐨𝐫 which can be helpful for Harmonic traders.
Option to display 𝐙𝐢𝐠𝐙𝐚𝐠 𝐇𝐢𝐠𝐡𝐬/𝐋𝐨𝐰𝐬 and 𝐑𝐒𝐈 𝐚𝐭 𝐇𝐢𝐠𝐡𝐬/𝐋𝐨𝐰𝐬 in one of two styles.
Two types of Fibonacci to choose from - 𝐀𝐮𝐭𝐨-𝐅𝐢𝐛𝐬 and 𝐅𝐢𝐛𝐬 𝐛𝐚𝐬𝐞𝐝 𝐨𝐧 𝐋𝐨𝐨𝐤𝐛𝐚𝐜𝐤.
𝐀𝐮𝐭𝐨-𝐅𝐢𝐛𝐬 option plots Auto Fibonacci levels based on Bull/Bear trend depending on user specified Breakout Type and Breakout Price.
𝐅𝐢𝐛𝐬 𝐛𝐚𝐬𝐞𝐝 𝐨𝐧 𝐋𝐨𝐨𝐤𝐛𝐚𝐜𝐤 plots Fibonacci levels based on the highest high and lowest low of the lookback period (𝐃𝐚𝐲𝐬 or 𝐂𝐚𝐧𝐝𝐥𝐞𝐬).
Fibonacci levels can be reversed by enabling 𝐑𝐞𝐯𝐞𝐫𝐬𝐞 from settings.
Enabling 𝐂𝐮𝐫𝐫𝐞𝐧𝐭 𝐏𝐫𝐢𝐜𝐞 𝐅𝐢𝐛 𝐋𝐚𝐛𝐞𝐥 displays the current Fib level of the developing price bar.
Option to customize Fib levels and colours.
4hr chart of BINANCE:BTCUSDT showing Auto Fibonacci levels, Zig-Zag with Trend High/Lows, Zig-Zag connectors with Fib Ratios and RSI at Trend High/Low prices.
Note:
If momentum doesn't slow down, the fibs can extend beyond 1 and may continue way beyond 4.618 fib level. These are quite rare depending on how distant the near high/low is based.
ZigZag and Fibonacci are good reference indicators and should always be used as confirmations rather than standalone indicators.
===================================================================================================================
█ Actuator Colour Scheme
Actuator employs 3 built in colour schemes namely Chilli , Flame and Sublime Grayscale and a versatile colour scheme Custom which enables the user to customise the colour combinations of the components of the Actuator script.
===================================================================================================================
█ Alerts
Alerts can be created for the following.
Actuator Bull Breakout Signal - Once Per Bar Close
Actuator Bear Breakout Signal - Once Per Bar Close
Actuator Long Dollar - Take Profit - Once Per Bar
Actuator Short Dollar - Take Profit - Once Per Bar
Actuator Stop Line Hit - Once Per Bar
Note: The script doesn't repaint, so the alerts can be used with confidence. To check this, users can do bar replays to check if the plots and markers stay in the same place.
===================================================================================================================
Best Practice: Test with different settings first using Paper Trades before trading with real money
===================================================================================================================

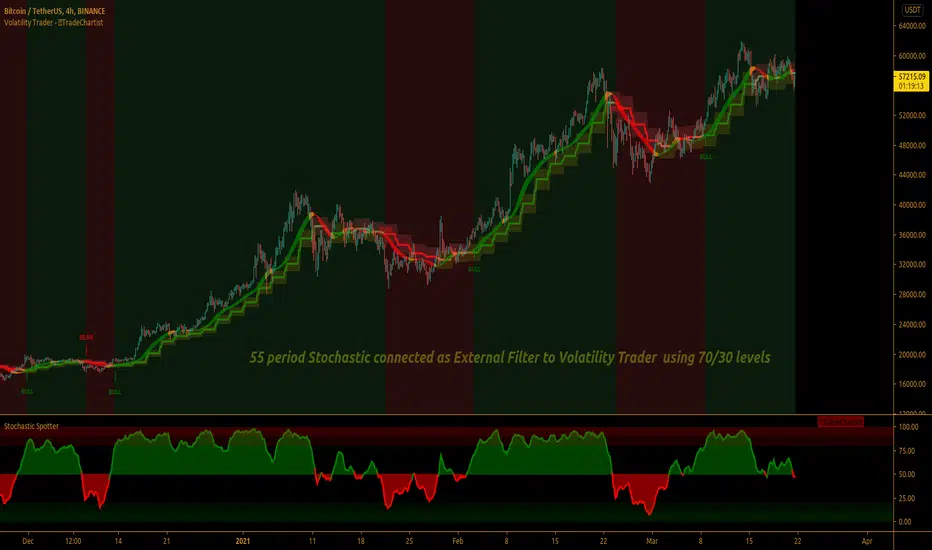
TradeChartist Volatility Trader ™TradeChartist Volatility Trader is a Price Volatility based Trend indicator that uses simple to visualize Volatility steps and a Volatility Ribbon to trade volatility breakouts and price action based on lookback length.
===================================================================================================================
Features of ™TradeChartist Volatility Trader
======================================
The Volatility steps consists of an Upper band, a Lower band and a Mean price line that are used for detecting the breakouts and also used in plotting the Volatility Ribbon based on the price action. The Mean Line is colour coded based on Bull/Bear Volatility and exhaustion based on Price action trend.
In addition to the system of Volatility Steps and Volatility Ribbon, ™TradeChartist Volatility Trader also plots Bull and Bear zones based on high probability volatility breakouts and divides the chart into Bull and Bear trade zones.
Use of External Filter is also possible by connecting an Oscillatory (like RSI, MACD, Stoch or any Oscillator) or a non-Oscillatory (Moving Average, Supertrend, any price scale based plots) Signal to confirm the Bull and Bear Trade zones. When the indicator detects the Volatility breakouts, it also checks if the connected external signal agrees with the trend before generating the Bull/Bear entries and plotting the trade zones.
Alerts can be created for Long and Short entries using Once per bar close .
===================================================================================================================
Note:
Higher the lookback length, higher the Risk/Reward from the trade zones.
This indicator does not repaint , but on the alert creation, a potential repaint warning would appear as the script uses security function. Users need not worry as this is normal on scripts that employs security functions. For trust and confidence using the indicator, users can do bar replay to check the plots/trade entries time stamps to make sure the plots and entries stay in the same place.
™TradeChartist Volatility Trader can be connected to ™TradeChartist Plug and Trade to generate Trade Entries, Targets etc by connecting Volatility Trader's Trend Identifier as Oscillatory Signal to Plug and Trade.
===================================================================================================================
Best Practice: Test with different settings first using Paper Trades before trading with real money
===================================================================================================================
This is not a free to use indicator. Get in touch with me (PM me directly if you would like trial access to test the indicator)
Premium Scripts - Trial access and Information
Trial access offered on all Premium scripts.
PM me directly to request trial access to the scripts or for more information.
===================================================================================================================
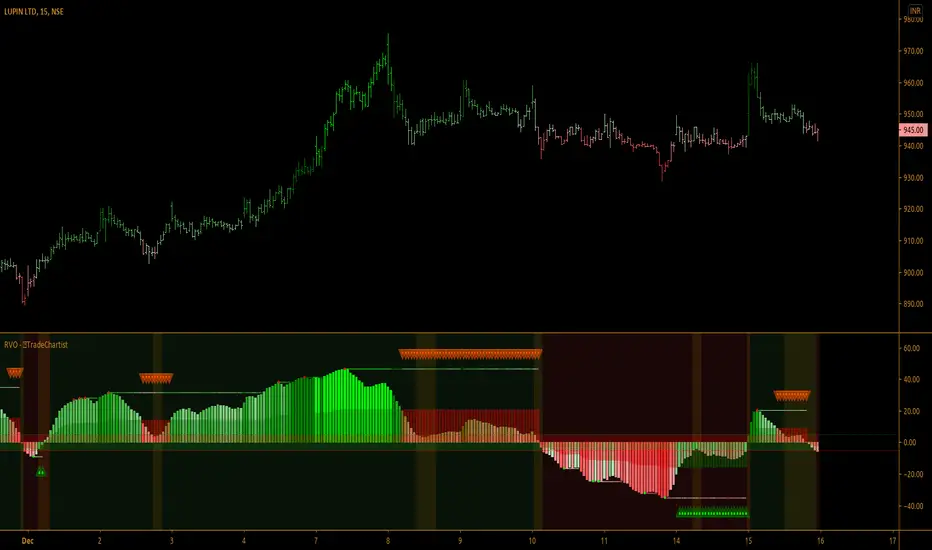
Relative Volatility OscillatorRelative Volatility Oscillator is a volatility based oscillator and works very well on Lower Time Frames on volatile assets. It uses one of five periods (34,55,89,144,233) to calculate relative volatility of the current bar with the volatility trend of one of the 5 periods from the settings, using percentile rank.
Features of Relative Volatility Oscillator
Choice of one of five periods for the Relative Volatility Oscillator plot.
SOS Triangles to indicate Bull/Bear Exhaustion.
Option to plot Volatility Zones. Oscillator Values between -5 and 5 will be plotted using exhaustion colours and can be used to monitor trades closely for trend reversals.
Choice of 3 colour themes including option to plot trend based coloured price bars.
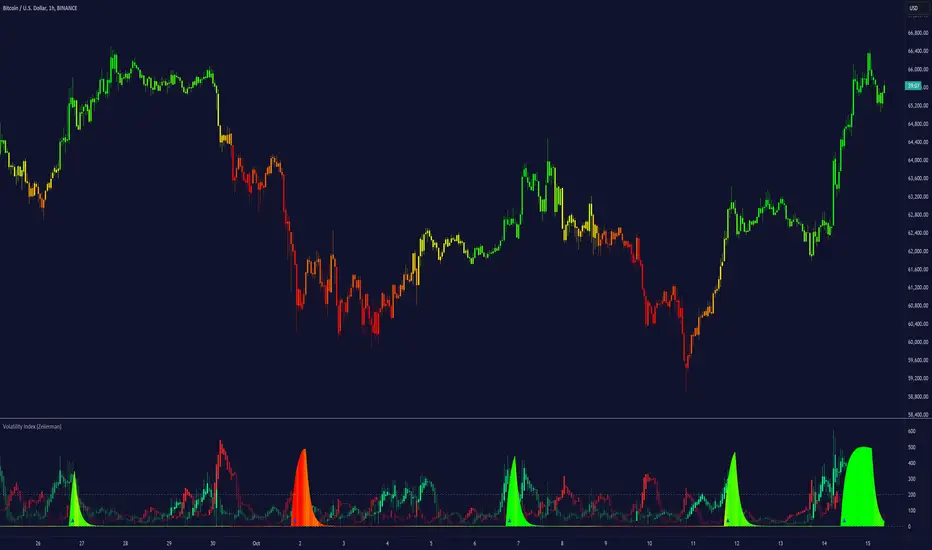
Volatility Index (Expo)Volatility Index (Expo)
DESCRIPTION
Volatility can be referred to many things, but a commonly accepted definition of volatility is that it’s a measure of the risk or uncertainty in the market. Higher volatility is equal to more risk in the market. A simple way of describing it is that when volatility is high, the value of the market can be spread out over a larger range of values. This means that the price of the market can change dramatically over a short time period in either direction. A lower volatility means that a market's value does not fluctuate dramatically, and tends to be steadier. However, how to calculate and to apply volatility has been widely debated and many different calculations have been used. Volatility Index is a must for a professional trader in today's volatile markets.
This Volatility Index is derived from research within Volatility.
HOW TO USE
1. Use the indicator to detect low- respectively high volatility.
2. Enter the market when the volatility is low, and exit the market when the volatility is high.
3. Use the indicator to identify when the volatility peaks. Can indicate that the market will shift or can be good areas to take profits.
Trend
When the market is in a positive trend, the volatility is low and stable. The opposite happens when the market is in a negative trend, the volatility is high and price moves boldly.
As a rule ,when volatility increases unusually(abnormal) in relation to previous periods something is happening in the market, then wait until the volatility peaks or when the indicator does not make any new highs (the indicator becomes flat), and in conjunction with that the trending price action doesn’t make any new lows or respectively highs. When this happens there is a high probability that the market will take a temporary turn.
Positive volatility refers to when the volatility index increases with green candlesticks this means that the buyers are more aggressive than sellers. (Can indicate a trend change)
Negative volatility refers to when the volatility index increases with red candlesticks this means that the sellers are more aggressive than buyers. (Can indicate a trend change)
INDICATOR IN ACTION
This indicator is best presented live, the graphs below gives a hint of how the Volatility Index works.
The indicator works on any market, security, currency, stock, etc. and on any timeframe.
BTCUSD
EURUSD
WALL STREET
I hope you find this indicator useful , and please comment or contact me if you like the script or have any questions/suggestions for future improvements. Thanks!
I will continue to work on this indicator, so please share your experience and feedback with me so that I can continuously improve it. Thanks to everyone that have contacted me regarding my scripts. Your feedback is valuable for future developments!
ACCESS THE INDICATOR
• Contact me on TradingView or use the links below
-----------------
Disclaimer
Copyright by Zeiierman.
The information contained in my scripts/indicators/ideas does not constitute financial advice or a solicitation to buy or sell any securities of any type. I will not accept liability for any loss or damage, including without limitation any loss of profit, which may arise directly or indirectly from use of or reliance on such information.
All investments involve risk, and the past performance of a security, industry, sector, market, financial product, trading strategy, or individual’s trading does not guarantee future results or returns. Investors are fully responsible for any investment decisions they make. Such decisions should be based solely on an evaluation of their financial circumstances, investment objectives, risk tolerance, and liquidity needs.
My scripts/indicators/ideas are only for educational purposes!