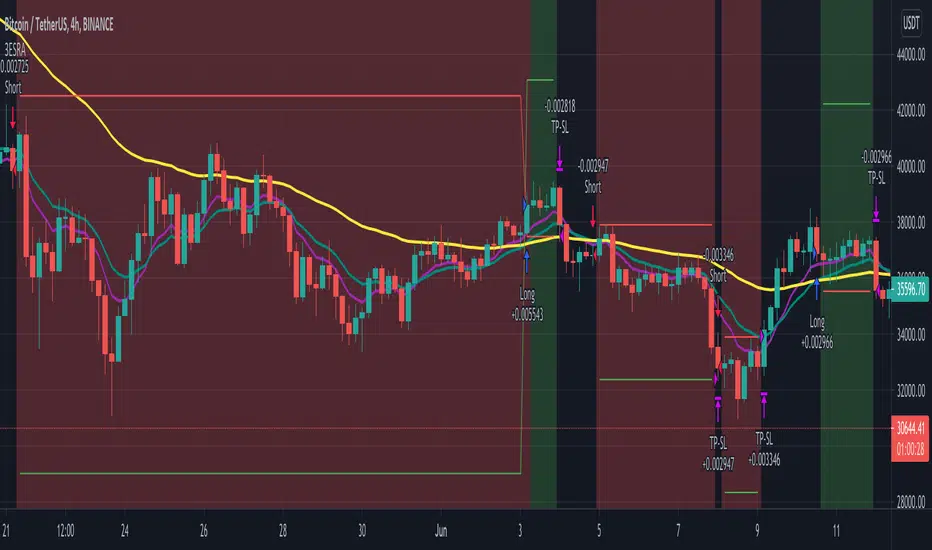
I developed a different strategy perspective for the Profit Maximizer PMax indicator prepared by Kıvanç Özbilgiç. When you come to the settings section; - You will see 2 options as Straregy Type. You can test the price and pmax intersections as different strategies. - I added the Long-Short option for spot traders to calculate the profitability rate correctly....
This is a very simple trend following strategy for Day Trading. The premise is to follow the Moving Average for the trend direction and buy/sell the dips and blips in the trend. 1. In an uptrend, when the candle action offers a "dip", or a lower high, the strategy will then buy on the close of the candle that breaks the high of the previous candle. 2. In a...
Profit Maximizer - PMax Explorer STRATEGY & SCREENER screens the BUY and SELL signals (trend reversals) for 20 user defined different tickers in Tradingview charts. Simply input the name of the ticker in Tradingview that you want to screen. Terminology explanation: Confirmed Reversal: PMax reversal that happened in the last bar and cannot be...
For Educational Purposes. Results can differ on different markets and can fail at any time. Profit is not guaranteed. This only works in a few markets and in certain situations. Changing the settings can give better or worse results for other markets. This is a longer term trend following strategy that uses Donchian Channels for trend following and uses the upper...
Today I am glad to bring you another great creation of mine, this time suited for crypto markets. MARKET Its a high and low strategy, designed for crypto markets( btcusd , btcusdt and so on), and suited for for higher time charts : like 1hour, 4hours, 1 day and so on. Preferably to use 1h time charts. COMPONENTS Higher high and lower low between different...
For Educational Purposes. Results can differ on different markets and can fail at any time. Profit is not guaranteed. This only works in a few markets and in certain situations. Changing the settings can give better or worse results for other markets. This is a mean reversion strategy based on Bollinger Bands and the Intraday Intensity Index (a volume indicator)....
This strategy trial is let you to giving sell and buy orders with ATR (average true range) and an coefficent for them. it is my first strategy work, needs to be upgraded. USE IT WITH YOUR OWN RISK. IT IS NOT EVEN GUARANTEED TO WORK.
The IFR2 strategy is based on the RSI indicator. If the two period RSI is less than the overbought level (25 is the default, but you can configure it to be lower), a long position is placed at the close of the candle. If you are doing it live, you'd have to enter the market ~ 10 minutes before it closes, check the RSI, and buy if it is lower than your overbought...
2 agitated candles falling inside ATR range, awaiting possibly a big move. Buy / Sell signals at combined high / low can be used as order with other as stop loss. Counter trade, when this minimal stop loss is hit, is also as useful. However, wait till the SL candle closes, before opening position on the other side. Works quite well on 15 mins chart, with settings...
This strategy is based on a lagged 24 periods Donchian Channel and a 200 periods EMA . The enter positions are calculated this way : Bull entry 1. we wait for the close of a candle below the channel and it must be below the 200 EMA 2. the following candle must be a green one and close in the lagged channel 3. we put a long order at the close of the...
This strategy combines VWAP and BB indicators BUY RULE 1. EMA50 > EMA 200 2. if current close > vwap session value 3. check if price dipped BB lower band for any of last 10 candles EXIT RULE 1. price closes above BB upper band STOP LOSS EXIT 1. As configured --- default is set to 5% warning: for the use of educational purposes only
I wanted to share this strategy that I use myself for binary options trading. After trading binary options for several years I have learned that every single day is unique... assets behave differently every single day. So, when I start the day I want to know which is the optimum combination of parameters in my indicators that will give me the signals I want...
Set the color for each bands and indicate the Bollinger bands. In order to indicate with simple moving average line,hide the bollonger bands line and set the color for bands. ボリンジャーバンドの帯域ごとに色を設定して表示します。 単純移動平均線と同時表示しても見やすいように、ボリンジャーバンドの線を非表示にして、帯域に色を設定して表示することができます。
Same coding only coloring and strategy version added //Barcolor Green = Trail1 > Trail2 and close > Trail2 and low > Trail2 Blue = Trail1 > Trail2 and close > Trail2 and low < Trail2 Red = Trail2 > Trail1 and close < Trail2 and high < Trail2 Yellow = Trail2 > Trail1 and close < Trail2 and high > Trail2 //It gives White color where there is...
I am sharing the strategy version of the indicator used before. It is very simple to use. These are the settings I use, you can change, test and use as you wish. Atr Period 5 Highest High Period 10 Multiplier 2.5 It can generate more signals in shorter time frames. The success rate will be higher in longer time frames.
STRATEGY version of SuperTrend Indicator: SuperTrend is one of the most common ATR based trailing stop indicators. In this version you can change the ATR calculation method from the settings. Default method is RMA, when the alternative method is SMA . The indicator is easy to use and gives an accurate reading about an ongoing trend. It is constructed with two...
This is a strategy build inside tradingview, which I found it works great with swing/position trading. It works based on parabolic sar indicator, when indicator is below the candle, is an uptrend and when its its above is a downtrend. At the same time it's very nice, because it has a sort of stop loss which is dynamic, because it triggers when candle crosses...
A little Script as part of a Tutorial using Monday as entries and Friday as exits/shorts, with option to Long-Only and a rudimentary Stoploss. outlined in detail here can't find a better fitting Category, so bear with me