Option CalculatorOption Calculator – Comprehensive Feature Guide
The aiTrendview Option Calculator is a feature-rich options trading dashboard built using Pine Script, designed for real-time market interpretation and strategy selection. It integrates Black-Scholes-based pricing models with dynamic market inputs to help traders evaluate directional bias, volatility, risk, and potential profitability in a structured, intuitive format. The tool supports both beginner and experienced options traders in making data-driven decisions.
Core Inputs and Pricing Foundations
Users can input the strike price, days to expiration, implied volatility (IV), interest rate, and option type (call or put). These values feed directly into calculations for the option's theoretical price, Greeks, and expected move. For example:
• Strike Price helps define moneyness, impacting delta and risk/reward balance.
• Days to Expiry determines the speed of time decay (theta).
• Risk-Free Rate adjusts for time value and interest rate impact (rho).
• Implied Volatility affects premium pricing and vega exposure.
• Option Type sets the directional foundation for strategy analysis.
Live Market Data Integration
The script pulls current underlying price, price change, and volume comparison against a moving average (e.g., current volume vs. 20-day average). This helps identify unusual trading activity or volume spikes. Volatility readings are also incorporated using ATR or external volatility indexes to enhance the realism of IV assessments.
Greek Calculations
The dashboard provides visual and numerical values for all five major Greeks:
• Delta shows directional sensitivity and is plotted with a visual bar.
• Gamma represents the rate of delta change, especially critical near-the-money.
• Theta measures time decay and is most impactful in the final weeks before expiration.
• Vega tracks sensitivity to volatility shifts, crucial for premium-selling strategies.
• Rho reflects sensitivity to interest rates, primarily relevant in long-dated options.
Each Greek is calculated based on real-time inputs, providing a statistical framework for assessing risk and return.
Market Sentiment & Risk Environment
A sentiment scoring system interprets the put-call ratio (PCR), volume trends, and price momentum (e.g., RSI). IV levels are color-coded (e.g., low, medium, high) to identify whether options are relatively cheap or expensive. These values support better timing decisions and help identify whether to be a buyer or seller of premium.
Strategy Recommendation Engine
The script dynamically evaluates six core strategies based on current data:
1. Long Call
2. Short Put
3. Long Put
4. Bull Call Spread
5. Long Straddle
6. Iron Butterfly
Each strategy is assigned a confidence score (0–100%) and updated in real-time. This system is designed to match the appropriate strategy to market conditions such as trend, volatility, and time to expiration.
Risk-Adjusted Trading Insights
The dashboard helps traders evaluate whether to initiate trades, reduce exposure, or wait:
• High Confidence (80%+): Favorable environment; standard sizing recommended.
• Moderate Confidence (60–80%): Trade with caution and reduced risk.
• Low Confidence (<60%): Consider avoiding the trade or waiting for better setup.
It also supports risk mitigation through defined-risk strategies and provides guidance on stop-loss, profit targets, and time-based exits (e.g., managing options with <21 days to expiry).
Real-Time Monitoring
The script continuously tracks:
• Changes in Greeks as price, volatility, or time evolve.
• Profit probability estimates using expected move and breakeven pricing.
• Volume activity and IV rank to spot institutional behavior.
This empowers traders to manage trades proactively, adjust exposure, or lock in profits based on changing market conditions.
Practical Use Case Flow
Step 1: Input Setup
Enter option-specific parameters (strike, expiry days, IV, etc.) and let the dashboard auto-calculate risk metrics.
Step 2: Analyze Market
Use sentiment analysis, IV level, and volume data to understand the environment.
Step 3: Select Strategy
Rely on the confidence score and recommendation engine to choose a suitable options strategy.
Step 4: Manage Risk
Apply size rules based on signal strength, adjust based on exposure, and set alerts if needed.
Step 5: Monitor Outcomes
Track Greeks, probability, and progress metrics to stay informed throughout the trade.
Trading Environment Adaptation
• Low IV: Favor long premium strategies (e.g., long straddles, long calls).
• High IV: Favor premium selling strategies (e.g., iron condors, credit spreads).
• Bullish Markets: Focus on call-based trades or bullish spreads.
• Sideways Markets: Use neutral setups like iron butterflies or calendar spreads.
Position sizing and stop-loss logic are aligned with industry practices (e.g., risk no more than 2% per trade, take profit at 50%, and cut losses at double the premium received).
Dashboard Interpretation Guide
• Green: High confidence strategy, favourable IV, and strong volume confirmation.
• Yellow: Mixed signals or moderate conviction – proceed with caution.
• Red: Low confidence, poor conditions – better to wait for clearer opportunities.
Disclaimer from aiTrendview
This script is intended for educational and informational use only. It does not offer financial advice or trading signals, nor does it guarantee results. aiTrendview and its affiliates are not responsible for any financial loss or decision made using this tool. Options trading involves substantial risk and is not suitable for all investors. Past performance of any strategy or metric does not guarantee future results. Users are encouraged to consult with a certified financial advisor and conduct independent research before making trading decisions.
Crude Oil WTI

Williams Percent Range with Trendlines and BreakoutsHere is my "Williams Percent Range with Trendlines and Breakouts" indicator, a simple yet powerful tool for traders. This indicator combines the classic Williams %R oscillator, which helps identify overbought and oversold levels, with added trendlines for easier trend analysis at a glance.
It's designed to make spotting potential breakouts easier by drawing attention to significant price movements. With customizable settings for the Williams %R period and trendline sensitivity, it's a flexible tool for various symbols and trading styles.
Whether you're looking to refine your trading strategy or just need a clearer view of market trends, this indicator should offer a straight forward approach to hopefully enhance your trading decisions.
Disclaimer: This indicator is intended for educational and informational purposes only. Always conduct your own research and analysis before making trading decisions.

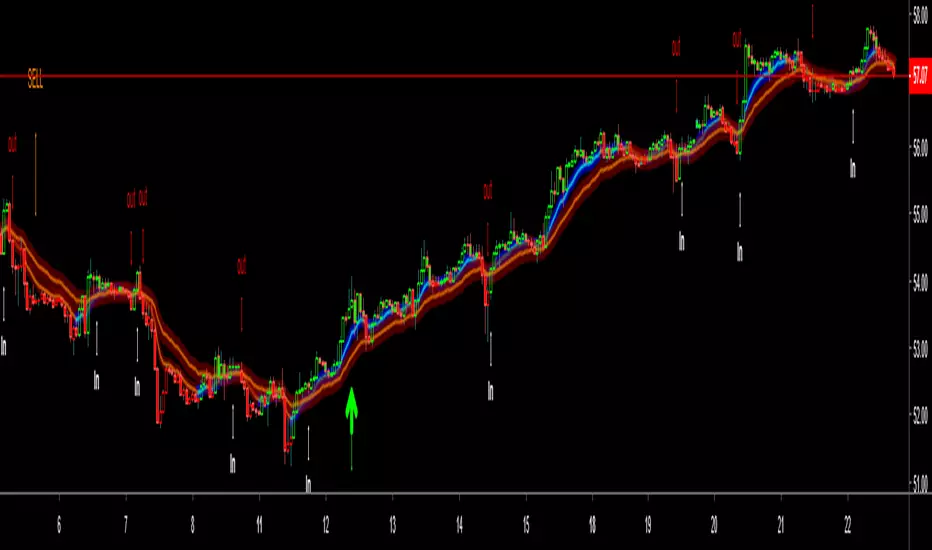
BE - Golden Cross Crude KeyTraders, i have been observing crude oil for about 3 months now and somehow I can see that crude is respecting 42 days Moving average and crosses have created massive spikes most of the time.
However you need to be mindful of the time to trade and timeframe since not all crosses creates spikes.
Note: I have been testing on a 15min timeframe.
Keeping this in mind, this indicator is a automated solution which takes trade entries on crosses plus buffer and exits based on the specified Sl type.
Enjoy!
DISCLAIMER: No sharing, copying, reselling, modifying, or any other forms of use are authorized for our documents, script / strategy, and the information published with them. This informational planning script / strategy is strictly for individual use and educational purposes only. This is not financial or investment advice. Investments are always made at your own risk and are based on your personal judgement. I am not responsible for any losses you may incur. Please invest wisely.
Happy to receive suggestions and feedback in order to improve the performance of the indicator better.

Commercial FV PriceTrend V1Hello Traders ,
This is a trend trading Indicator where support and resistance and demand zone has been mentioned , It plots according to the trend change . Important point of the indicator is at time when we enter , just on the bases of buy and sell we enter and most of the time market takes out our SL or market reverses or trend changes , There comes the zones part and its functionality is mentioned in the images below and entry is only confirmed only when the candle penetrates inside the any of the zone be that be Resistance zone or Demand Zone and then breaks the low of the Zone (if trend is bearish) then only one can take short position and high of the zone should be the Stoploss ... Similarly if the trend is bullish and price is between Resistance and Demand Zone , if the price breaks the resistance and continue no long position can be taken , atleast for once it should penetrates back inside the Resistance Zone and then breaks the high of the zone that time long entry will become valid and low of the zone will be the Stoploss and 1:3 Risk Reward . By the way this can work with any type of market. However I concluded Intraday levels too which can be turned off according to user comfortability along with mean channel .
Aqua defines BULLISH TREND
RED defines BEARISH TREND
Rules for exit
lONG Exit= Candle closes below Zone Low
Short Exit =Candle closes above Zone high
-----------------
Disclaimer
Copyright by FaizanNawazz.
The information contained in my scripts/indicators/strategies/ideas does not constitute financial advice or a solicitation to buy or sell any securities of any type. I will not accept liability for any loss or damage, including without limitation any loss of profit, which may arise directly or indirectly from the use of or reliance on such information.
All investments involve risk, and the past performance of a security, industry, sector, market, financial product, trading strategy, or individual’s trading does not guarantee future results or returns. Investors are fully responsible for any investment decisions they make. Such decisions should be based solely on an evaluation of their financial circumstances, investment objectives, risk tolerance, and liquidity needs.
My scripts/indicators are only for educational purposes!
Happy Trading!

Accurate BUY & SELL 5 mins TF by RRAlways trade using 5 mins Time frame of chart.
For Buy entry always buy 1 point above the candle closing price & SL would be previous candle low or 30 points.
For Sell Entry Always Sell 1 point below the candle opening price & SL would be previous candle high or 30 points.
Do not take trades using 3 mins Time frame, as there is lot of noise. It works best with 5 mins Time frame.
I have adjusted/set according my trading pattern, if needed use the settings options to set accordingly .
Removed range highlighter to keep the chart simple.
Original Version credits to ZacVaughn
Actual Version i just set alerts and change the parameters for Crude OIL 5min Chart.
NO REPAINT.
Wait For Barclose

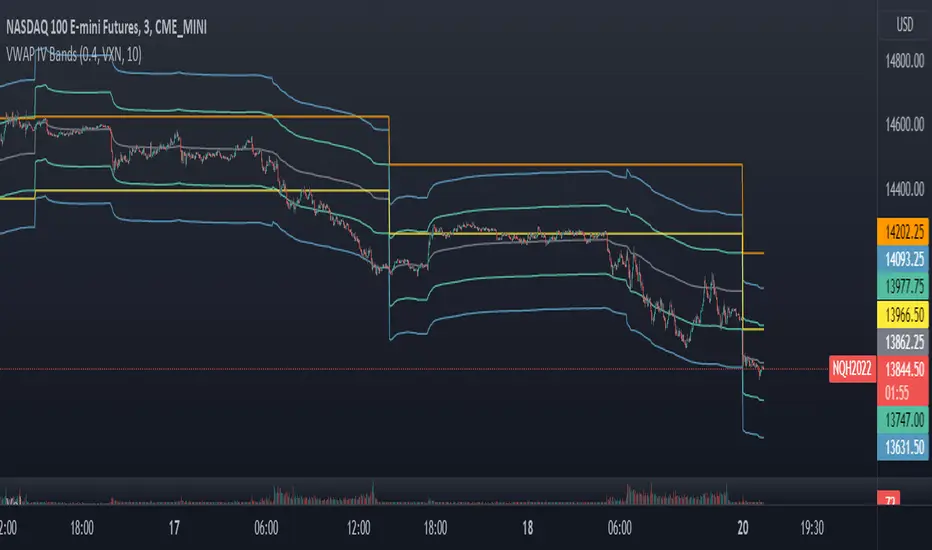
VWAP Implied Volatility BandsThis script takes the built in VWAP function and creates bands using various Volatility Indexes from the CBOE. The script plots the bands at desired multiples, as well as the closing value of the prior day's first set of bands. Users can choose from the following:
VIX(ES), VXN(NQ), RVX(RTY), OVX(CL), GVX(GC), SIV(ZS), CIV(ZC), TYVIX(ZN), EUVIX(EURUSD), BPVIX(GBPUSD)
Upon selecting the desired volatility index, users must change the multiplier to fit the underlying product since the indexes are all calculated differently.
The goal with this script was to use market generated information (IV) to highlight potential trade locations.
Market StatsThis script escapes much of the subjective technical analysis and discretionary trading in general. With this Script/Indicator, you will be able to have access to the statistics tested day by day in the markets, statistics that will be a decisive support in your trading plan. Its analysis and creation is based on the quantitative trading system, since these statistics have a testing and database behind, which makes it a potential indicator for your trading.
You can change the time of the market you want to operate, also the colors of the labels of the statistics, their distance, color of the letters, fully editable to adapt it to the type of market you operate.
Its design involves values of the previous session ( RTH ) and extension session (OVERNIGHT), so it will be complemented with markets that are assimilated to that configuration (indices, stocks, futures, CFDs, forex, commodities ) maybe you can adapt it with cryptocurrencies, but being 24/7 you would have to modify its schedule.
Important levels included:
YHOD: Yesterday High of Day
ONH: Onvernight High
ONM: Overnight Mid
YPOC: Yesterday Point of Control
HALFGAP: Close Price Mid
GAP: Yesterday Close Price
ONL: Overnight Low
YLOD: Yesterday Low of Day
IBH: Initial Balance High
IBL: Initial Balance Low
The IBH and IBL levels will appear after 60 minutes into the session, indicating our balance zone. The one that will add more statistics to our trading.
_________________________________________________________________________________________________________________________________________________________________________________________________________
Este script, escapa mucho del análisis técnico subjetivo y del trading discrecional en general. Con este Script/Indicador, podrás tener acceso a las estadísticas testeadas día a día en los mercados, estadísticas que serán un apoyo decisivo en tu plan de trading. Su análisis y creación se basa en el sistema de trading cuantitativo, ya que estas estadísticas, tienen un testeo y base de datos por detrás, lo cual lo hace un indicador potencial para tu trading.
Podrás modificar el horario del mercado que quieres operar, también los colores de las etiquetas de las estadísticas, su distancia, color de las letras, completamente editable para que lo adaptes al tipo de mercado que operas.
Su diseño implica valores de la sesión anterior ( RTH ) y sesión de extensión (OVERNIGHT), por lo que se complementará con los mercados que se asimilen a esa configuración (índices, acciones, futuros, CFDs, forex, commodities ) quizás lo puedas adaptar con criptomonedas, pero al ser 24/7 habría que modificar su programación.
Niveles importantes incluidos:
YHOD: Yesterday High of Day
ONH: Onvernight High
ONM: Overnight Mid
YPOC: Yesterday Point of Control
HALFGAP: Close Price Mid
GAP: Yesterday Close Price
ONL: Overnight Low
YLOD: yesterday Low of Day
IBH: Initial Balance High
IBL: Initial Balance Low
Los niveles de IBH y IBL, aparecerán después de 60 minutos iniciada la sesión, indicando así́, nuestra zona de balance. La que agregará más estadísticas a nuestra operativa.

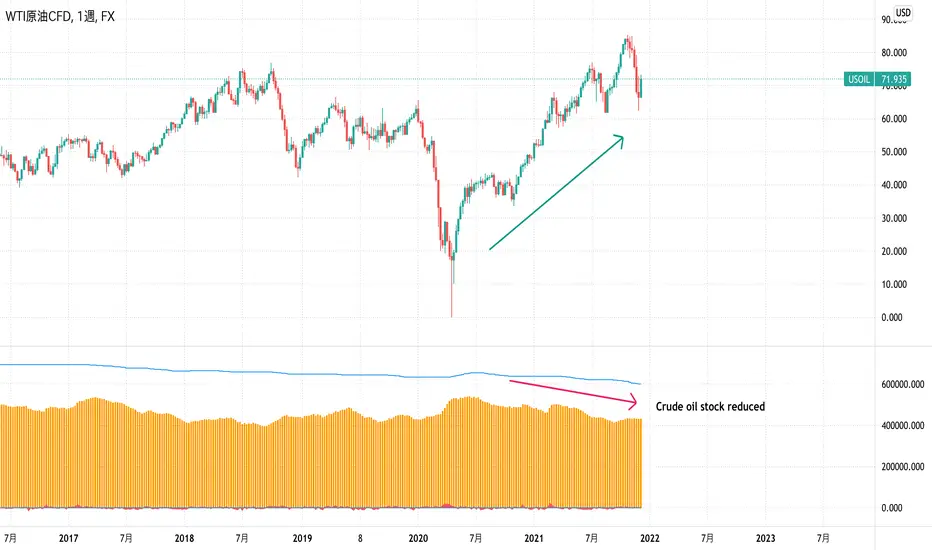
EIA Crude Oil Stock StatisticsJapanese below / 日本語説明は下記
Dear Oil Traders/Investors,
I have created this indicator which shows EIA crude oil stock statistics provided by EIA(U.S. Energy Information Administration).
Like other commodities, oil prices are highly affected by demand and supply and increase/decrease of crude oil stock cause crude oil price fluctuation.
This indicator is created to help oil traders/investors easily analyze crude oil statistics along with price movement.
It displays the following data as per data released by EIA on weekly basis. (Data source is quandle.com)
-Crude Oil Ending Stock
-Crude Oil SPR Ending Stock
-Stock changes from previous week(Calculated by the indicator)
-% changes(Calculated by the indicator)
Enjoy!
============================
原油トレーダー/投資家の皆さん
EIA(米エネルギー省エネルギー情報局)が公表している原油在庫統計をサブウィンドウに表示するインジケーターを開発しました。
他のコモディティと同様に、原油価格は需要と供給に大きく影響を受けます。
特に原油在庫の増減は原油価格を変動させる要因の一つです。
このインジケーターは原油トレーダー/投資家が原油在庫統計を価格の動きとともに容易に分析できることを目的としています。
EIAから週単位で公開されるデータのうち、以下のデータを表示します。(データソースはquandle.comです。)
-原油在庫
-SPR在庫
-原油在庫変動数(対前週比)
-原油在庫変動率(%)(対前週比)
GoldenCO Aie3Use of GCOv3 strategy for market analysis
This gco3 strategy uses exponential moving average analysis which is 5emas to show the movement of stock prices in the market. It is also to track the impending changes to the market price. the use of EMA is more sensitive to trend changes and it is one way to see the trend of price movements and as a guide to the trader.
The parameters used are EMA5/EMA20/EMA50/EMA100/EMA200.
The above parameters indicate a price condition that includes 4 phases of the price trend, namely the accumulation, uptrend, distribution, and ddowntrend phases.
we hope that, by recognizing and knowing the trend of this price movement it can help traders in trading activities well and can reduce risk. May it benefit the trader.
DISCLAIMER ; This is not Buy/Sell call, Just analysis idea for education. Trade At Your Own Risk
NPetro V10.12 for CL, ZL and ZC (Delayed Graph)NPetro V10.12
There are 6 key point in this indicator which are :-
•Lines
•Ticks Status
•Volume Strength
•ACV+ & Arrows
•Gap Remover
•Entry Point
Lines
There are 5 lines that represent Support and Resistant as the guidance in determining market direction.
Purple line, Blue line, Green line, Yellow line and Bollinger band line.
•Purple line represent volume base SnR .
•Blue line represent short term SnR .
•Green line represent long term SnR .
•Yellow line represent current market movement.
•Bollinger Band is to identify sideway market.
Ticks status
Ticks status is a status label that shows todays movement from the lowest and movement from the highest
•Going Up - total movement from the lowest of the day to current price.
•Going Down - total movement from the highest of the day to current price.
Volume Strength
Strong Volume Strength is shown as Purple or Blue candle.
•Purple Candle - shows strong volume pushing the price down.
•Blue Candle - shows strong volume pushing the price up.
ACV+ & Arrows
Accumulated Volume + is a tools that combine Relative Strength of volume and price together to evaluate Overbought and Oversold conditions.
•Purple Arrow - Displayed when Purple candle appeared and Relative Strength of volume changes in ACV+ move above Overbought value.
•Blue Arrow - Displayed when Blue candle appeared and Relative Strength of volume changes in ACV+ move below Oversold value.
Recommended Timeframe
TF 3min (Confirmation TF)

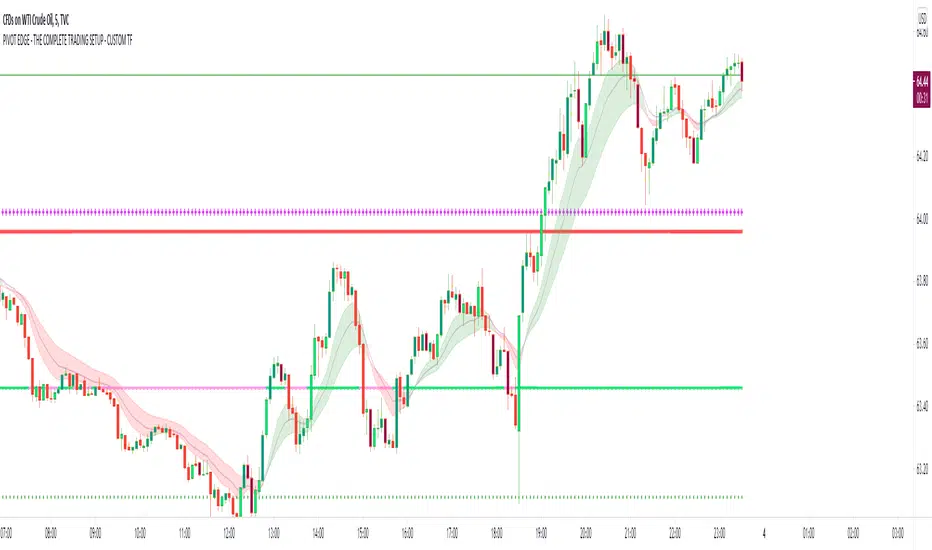
PIVOT EDGE - THE COMPLETE TRADING SETUP - CUSTOM TFIntroduction to the Indicator " PIVOT EDGE - The complete trading setup - CUSTOM TF " It means custom timeframe
The Foundation layout for this indicator is based on PIVOT's which are nothing but the most important levels that the price has respected in the past. The values for the pivots are derived from the key attributes of the price in any timeframe such as the OPEN, HIGH, LOW and CLOSE. These define the mood of the price and where it intends to move in relation to the previous range formed. Earlier HIGH - LOW i.e the RANGE indicates the possible movement that a stock can make in the current session and as per the calculated pivots we can possible find out the tentative supports and resistances. In addition to this indicator, It is advisable to use the price action theory which helps in taking a right decision for entries.
This indicator by itself is complete in nature, i.e it guides the user for possible entry levels and the projected targets that we can achieve and also the likely stop loss limit in case the price reverses. So beforehand even before entering into a trade position, the user can ascertain what can be his loss or max profit and then he can chose an optimum position size for favorable results.
The beauty of this Indicator lies in the fact that it can be used for all types of trading like Scalping, Intra day, Swing or Positional and Investments also. It works on all timeframes and across all market segments like EQUITY, COMMODITIES , FUTURES , OPTIONS , FOREX etc.
This indicator can be used for any exchange and any time zone also without any changes or adjustments needed.
Now let us understand the features of this Indicator in detail.
TIMEFRAME - It has options to choose between Day, week and month as timeframe. By default it is set to Day timeframe
DISPLAY MAJOR LEVELS - These are the important support and resistance levels calculated based on the past price data. Most important ones are marked in BOLD RED and BOLD GREEN between which the price tends to move generally.
Apart from these, We have breakout level marked in light green and if price breaks this level we can expect targets upto extended levels and beyond marked in blue.
we also have breakdown level marked in light red and if price breaks this level we can expect targets down up to extended levels and below it marked in blue.
In addition I have coded intermediate target levels that appear in light gray between the extended levels or blue lines. Sometimes when the gap between these targets are huge, price cannot reach the targets and reverses at these intermediate targets. You can use them as targets or trailing stop loss based on your plan
DISPLAY HIDDEN LEVELS - These levels are intermediate supports and resistances that can be used whenever the present day indicated range is very wide. Whenever we have an explosive moments in market the range of that day is very huge and so he next day support and resistance band becomes very wide indicating the sideways movement day within that range. And on those days we can switch on the hidden levels and the price respects these levels and most of the days it is inside this range only.
DISPLAY PREVIOUS HIGH / LOW / CLOSE - I have included Daily / Weekly and monthly levels. It is important to know the earlier highs / lows and close since price respects it very must just like support and resistance .
PEMA - This is an important EMA based indicator which potentially indicates curves of support and resistance during retracements or pullbacks. If the curves are breached then the trend is reversed and the price will tend to move to the next pivots .
IMPORTANT NOTE : This indicator does not guarantee any favorable results nor protect your from any loss. You own the complete risk of your trades. It is suggested that you use this indicator and do back testing for considerable period to understand how it works the the potential win rate it can give. If you have any doubts or need any clarifications of assistance in understanding, you can message me and I will try to help.
Happy and Safe trading - Mohan from PIVOT EDGE
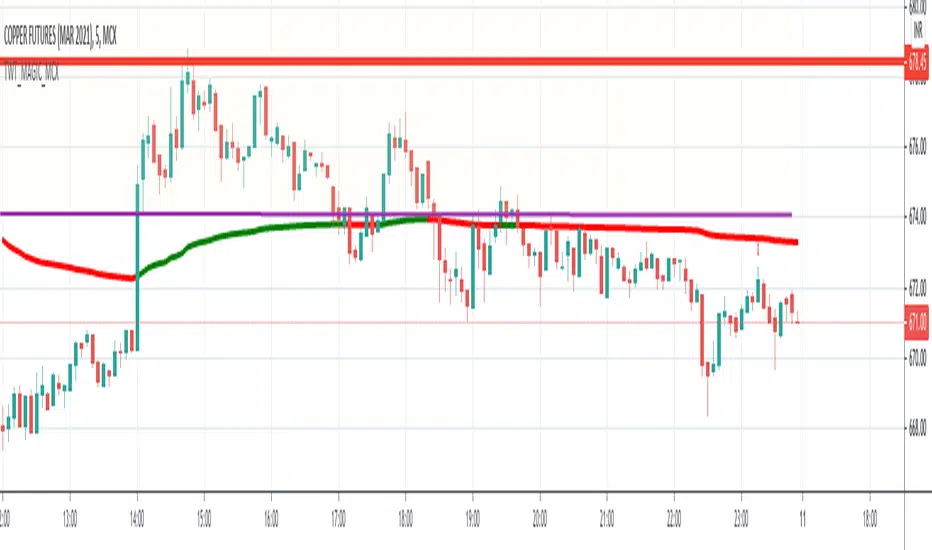
TWT_MAGIC_MCXDescription:
TWT_MAGIC_MCX is designed to trade the MCX commodities for overnight positions.
The logic behind this is to calculate the closing price based on today's price action and come up with suggestion at end of the closing to BUY or SELL for Next Day.
How to Trade::
if on a 5 Minute Chart, the GREEN arrow appears at 23:25 Candlestick then Enter BUY position
if on a 5 Minute Chart, the RED arrow appears at 23:25 Candlestick then Enter SELL position
if on a 5 Minute Chart, no arrow appears at 23:25 Candlestick then Do not take any trade.
Trade need to be taken between 23:25 to 23:30
Profit/SL need to booked at next morning.
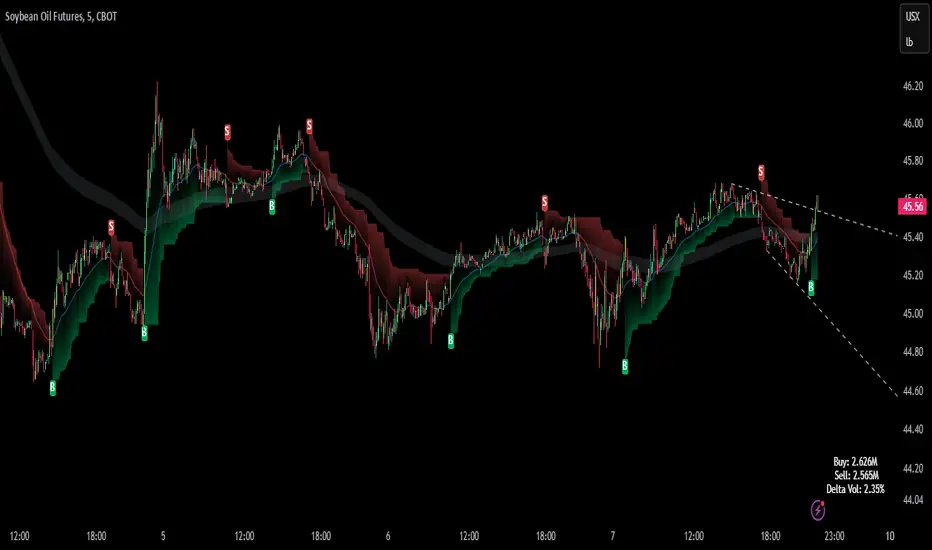
Intraday BUY/SELLBUY & SELL Scalp Signals for Crude Oil Future Contracts (Or it can be used with any scrip with good amount of Volume) based on Sma & RSI overbought/oversold alert (!) for possible reversal indication.
Take Buy position only if candle breaks the high of alert candle & for Sell positions, take position if candle breaks low of the alert candle.
Best to perform with 3 min timeframe on Crude Oil Futures

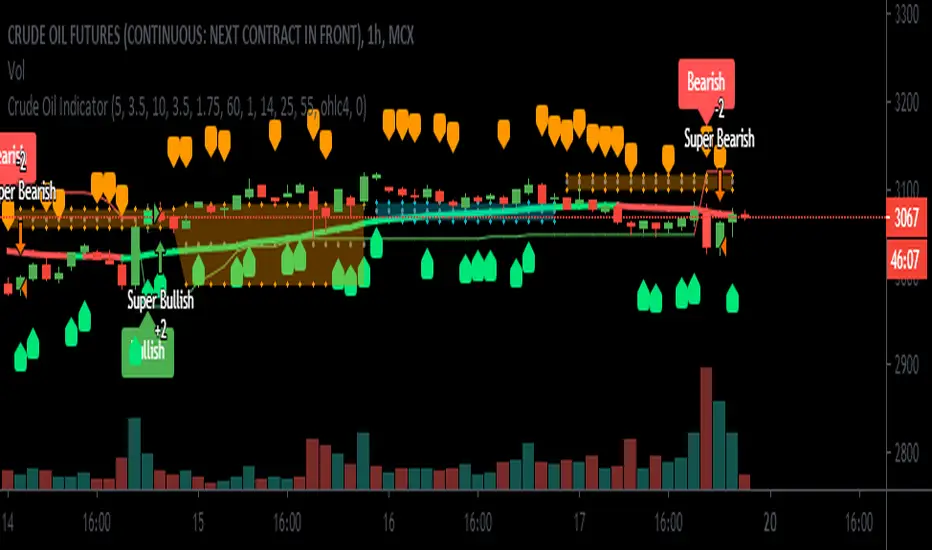
Crude Oil Indicator [SIDD]Crude Oil Indicator is giving two signal Bullish and Bearish . Bullish signal is used to take long trade and Bearish signal is used to close existing long trade and take new short trade and so on.
To get More signal of Bullish and Bearish user must enable More Signals check box that will check crossover and cross down of price close with Gaps.
I am using 2 ATR and one ADX and Gaps and VWMA to make signal profitable with 15 minutes 1 hr ,2hr,3hr,4hr chart time frame.
I have checked last few years data for back testing. Based on past performance it doesn't work well in 30 minute and 1 day chart time frame as results are not good in back testing. I have designed this indicator for Indian crude oil context though it can be used with other market as well.
1st ATR used to find trend with price crossover.
2nd ATR ADX is used to find the trend change details only. I have taken VWMA and ATR both to consider trend change.
Highlight Gap Up and Gap Down is used to know daily market opening gap up and gap down area. Gaps act as support and resistance .
VWMA Plotted as Blue line. Rising VWMA considered as uptrend and falling VWMA considered as downtrend.
Flat VWMA considered as no trend zone. In no trend zone every second third candles cross VWMA .
User must keep the default setting for getting better results as results are back tested. If setting changed then result may vary.
I have added here back tested performance user can see those results. I have added commission and slippage as well. Past year performance not guarantee for future years result so before taking any trade trader must take conscious decision.
This indicator is available on Subscription.
PM/ DM for more information about the script access.
Use the link below to obtain access to this indicator.
ZoneBand (@Mido_yuiya)Bollinger band is converted to EMA , and support and resistance bands are made into regions

USOIL to MCX Crude INR - by AnanthThis Indicator convert and display the MCX Crude oil price in INR by calculating the USOIL Multiplied by USDINR plus Slippage Buffer value. The buffer can be set by the user as Input Value.

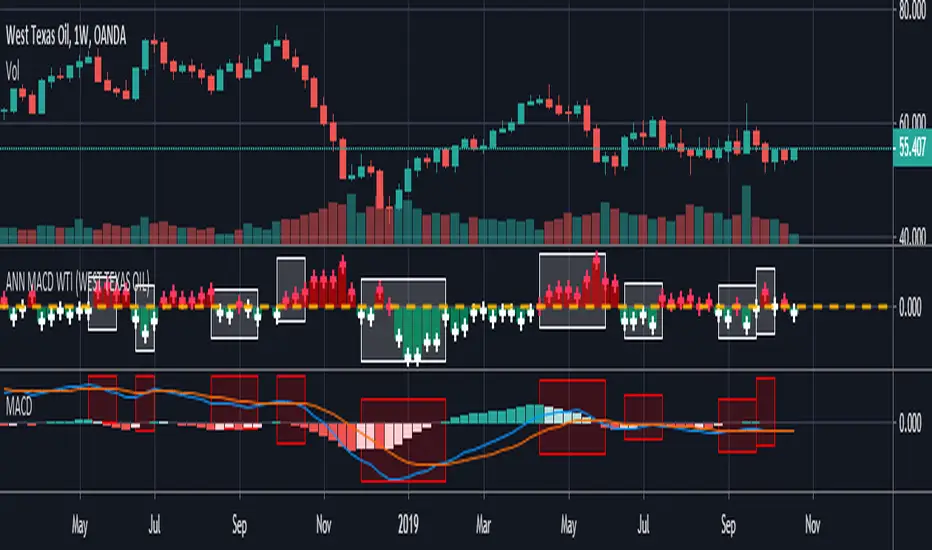
ANN MACD WTI (West Texas Intermediate) This script created by training WTI 4 hour data , 7 indicators and 12 Guppy Exponential Moving Averages.
Details :
Learning cycles: 1
AutoSave cycles: 100
Training error: 0.007593 ( Smaller than average target ! )
Input columns: 19
Output columns: 1
Excluded columns: 0
Training example rows: 300
Validating example rows: 0
Querying example rows: 0
Excluded example rows: 0
Duplicated example rows: 0
Input nodes connected: 19
Hidden layer 1 nodes: 2
Hidden layer 2 nodes: 6
Hidden layer 3 nodes: 0
Output nodes: 1
Learning rate: 0.7000
Momentum: 0.8000
Target error: 0.0100
Special thanks to wroclai for his great effort.
Deep learning series will continue. But I need to rest my eyes a little :)
Stay tuned ! Regards.


PpSignal PerPro V6 Indicator Version with alarmThis is the of PerPro V6 indicator version with alarm. Remember in trend changes the indicator may repaint the signal. Please use other indicators to accompany the entries.
in small periods, such as 1, 3 and 5 minutes and pairs or high volatility stock we have seen a repaint until confirms the trend.
if you want to use it in 1, 3 or 5 minutes condigurelo in tf 1h or 240 up. in 1h charts we recommend 480, 720 or D in forex, in stock 1h tf W, in 1D graph set in W or M. It may be at the beginning of a new signal repaint.
I'll leave it free for 3 months then I'll change the code and make it private.

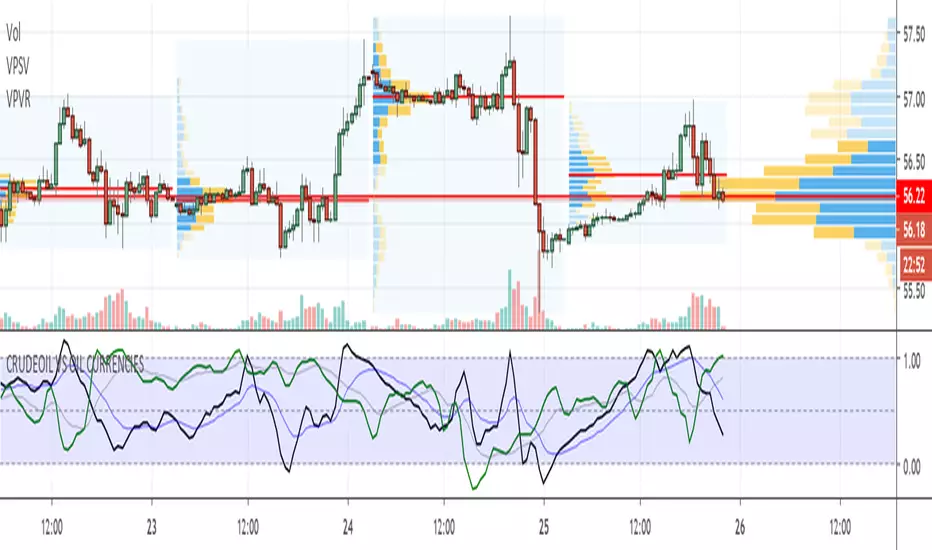
CRUDEOIL VS OIL CURRENCIESThis Script helps the traders to understand the saturation and reversal points for CRUDE based on the CRUDE DEPENDENT Currencies (CANADIAN LOONI, MEXICO, NORWAY and RUSSIA)
All the sweet crude participants including WTI.
It's a must needed indicator for Crude oil trading