Multiple Indicator 50EMA Cross AlertsHere’s a screener including Symbol, Price, TSI, and 50 ema cross in a table output.
The 50 Exponential Moving Average is a trend indicator
You can find bullish momentum when the 50 ema crossed over or a bearish momentum when the 50 ema crossed under we are looking to take advantage by trading the reversion of these trends.
True strength index (TSI) is a trend momentum indicator
Readings are bullish when the True Strength Index shows positive values
Readings are bearish when the indicator displays negative values.
When a value is above 20, we look for selling overbought opportunity and when the value is under 20, we look for buying oversold opportunity.
You can select the pair of your choice in the settings.
Make sure to create an alert and choose any alerts then an alert will trigger when a price cross under or cross over the 50 ema for every pair separately.
This allow the user to verify if there is a trade set up or not.
Disclaimer
This post and the script don’t provide any financial advice.
TSI

HLC True Strength Indicator (with Vix)HLC True Strength Indicator Volume Weighted with Vix Line by SpreadEagle71
This indicator is a True Strength Indicator with Close, High and Low used together, along with the TSI of the Vix.
The white line is the close. The red line is the lows and the blue is the highs. These are also volume-weighted.
How to Interpret:
1. zero line crosses. If SPY/SPX500 crosses the zero line, then its bullish. If the purple Vix line crosses up, watch out because this is bearish.
2. white/blue/red lines cross purple (Vix). If they cross upwards, this is bullish. If downward, this is bearish. Basically, SPX, ES1!, SPY or even DIA can be used. The security and the Vix should travel in opposite directions and cross the zero-line at the same time. But this is not always the case.
3. Black area infills. These are used between the close and the highs (blue) and the lows(red). Close should not be between these in order to have momentum.
4. Close (white line) leads. Close is the last price so it tends to show where the others (highs and lows) are going. If the close is sagging below a high where the blue lines are on top, this could mean that there is a reversal coming. Same holds true for a white line above a "valley" formed by the blue and red lines; it could mean a reversal to the upside soon.
5. The Black Infill areas as a squeeze or contraction/expansion area. The thinner the black infill areas, the more of a momentum "squeeze" could be present. Wide black infill areas mean increased volatility and what may come next is a reversion to the mean for volatility. See TTM Squeeze Indicator or the Squeeze Momentum Indicator (kudos LazyBear).
Lastly, just remember indicators indicate; they are not magic. :)
SpreadEagle71

Bogdan Ciocoiu - Code runnerDescription
The Code Runner is a hybrid indicator that leverages other pre-configured, integrated open-source algorithms to help traders spot regular and continuation divergences.
The Code Runner specialises in integrating some of the most popular oscillators well known for their accuracy when scalping using divergence strategies.
Uniqueness
The Code Runner stands out as a one-stop-shop pack of oscillator algorithms that traders can further customise to spot divergences.
The indicator's uniqueness stands from its capability to recast each algorithm to apply to the same scale. This feature is achieved by manually adjusting the outputs of each algorithm to fit on a scale between +100 and -100.
Another benefit of the Code Runner comes from its standardisation of outputs, mainly consisting of lines. Showing lines enables traders to draw potential regular and continuation divergences quickly.
The indicator has been pre-configured to support scalping at 1-5 minutes.
Open-source
The Code Runner uses the following open-source scripts and algorithms:
www.tradingview.com
www.tradingview.com
www.tradingview.com
www.tradingview.com
www.tradingview.com
www.tradingview.com
www.tradingview.com
www.tradingview.com
These algorithms are available in the public domain either in TradingView space or outside (given their popularity in the financial markets industry).

Bogdan Ciocoiu - MoonshotDescription
Moonshot is an indicator that encapsulates the value delivered by the TSI, MACD, Awesome Oscillator and CCI algorithms to produce signals to enable users to enter positions in ideal market conditions. Moonshot integrates the value delivered by the above four algorithms into one script.
This indicator is particularly useful when trading continuation/reversal divergence strategies.
Uniqueness
The Moonshot's uniqueness stands from integrating the above algorithms into the same visual area and leveraging preconfigured parameters suitable for 1-3 minute scalping techniques.
In addition, Moonshot allows swapping or furthermore configuring the above four algorithms in such a way to align signals by colour-coding or shape thickness to aid the users with identifying any emerging patterns quicker.
Furthermore, Moonshot's uniqueness is also reflected in the way it has standardised the outputs of each algorithm to look and feel the same (including the scale at which the shapes are shown) and, in doing so, enables users to plug them in/out as needed.
Open-source
The indicator leverages the following open-source scripts/algorithms:
www.tradingview.com
www.tradingview.com
www.tradingview.com
www.tradingview.com

TOTC - Trade outside the Channel (aka "Chaos Coaster") [Free]To make the strategy known as the "Chaos Coaster" (published by "Perfect Entry" group) easy to use, simplify backtesting, and increase awareness, I combined three indicators into one. The result is this standalone indicator, which provides clear signals based on the original rules of the strategy.
Let's look at the rules and components of the strategy to explain how the indicator works and signals:
As a baseline we use a "Pivot (Fractal) Chaos Channel" or also known as "Fractal Chaos Band".
Essentially, the "Fractal Chaos Channel" shows an overall panorama of price action. As they filter out the insignificant price fluctuations. The upper level is created by drawing price highs and the lower level is created by drawing price lows.
As our first confirmation and to identify the direction of the trend, we use the momentum technical oscillator “TSI – True Strength Indicator”.
As a second confirmation, we use my indicator "PaP - Procul ad Pretium", which is not yet public. It helps to identify a trend at an early stage or to serve as confirmation. In short, as the name implies, the indicator tries to identify the trend based on the distance of prices to trending averages, smoothed with moving averages of your choice.
(In the original version of the strategy, "Piphunter lmi" by the_w15rdx is used. PaP provides comparable results.)
The rules for "long" or "short" signals
The basic rule is: "Trade outside the channel" when PaP and TSI point in the same direction.
Rule 1 of the Strategy:
A candle breaks and closes outside the "Pivot (Fractal) Chaos Channel". For "long" positions, the price must break the upper level. For "short" positions, the price must break the lower level.
Rule 2 of the Strategy:
The direction of the TSI must match the break direction of the "Pivot (Fractal) Chaos Channel". For long positions, TSI must be above its signal line. Vice versa for "short" positions.
Rule 3 of the Strategy:
The direction of "PaP - Procul ad Pretium" must match the break direction of the "Pivot (Fractal) Chaos Channel".
Outputs and Filters
The output is the "Pivot (Fractal) Chaos Channel" whose background corresponds to the direction of "PaP - Procul ad Pretium" and whose lines reflect the direction of "TSI - True Strength Indicator".
"long" or "short" signals are indicated by colored candlesticks and arrows. If there are several signals per level of "Pivot (Fractal) Chaos Channel", they are also numbered consecutively.
In addition, the signals can be filtered by defining the maximum number of signals per pivot (fractal) level.
How can this indicator be used?
As mentioned, this indicator provides the signals for the strategy that has become known as the "Chaos Coaster". Details and even videos of this strategy can be found online. I can also provide a list of links upon request.
Limitations of this free version
The default settings of the indicator reflect the original version of the strategy. Some parameters cannot be changed or can only be changed to a limited extent in this free version. To get full access to all parameters, send me a private message here on TradingView.
Setting up alerts and what needs to be considered
Alerts take into account the settings of the indicator at the time of creating an alert. I therefore recommend setting up the alert again after making changes to the settings. To receive alerts: "Add Alert to TOTC" and select "Any alert() function call".
What do I need to consider?
It may be advisable to add further indicators and an analysis of the market structure in order to confirm the signals issued by the indicator. Please note that when you make adjustments to any strategy, you always carry out particularly detailed tests.
You would like to use this strategy, but you have adjustment requests, you want to have additional filters or features implemented, ...?
I am happy to create individual indicators based on "TOTC - Trade outside the Channel ". Write me a PM and we will discuss the details and conditions.
Will this indicator be further developed and will I receive free updates?
All my indicators are of course constantly updated and, if possible and with the aim of the indicator justifiable, supplemented by user requests. If you like this indicator and follow me here on TradingView, you will be informed about updates and also new indicators.

3 Seas - TSI Ergodic WavesThis is my own original approach at a True Strength Index, it uniquely filters out all inputs to remove the noise normally found in a more traditional TSI Oscillator.
My goal was to make my take on the TSI as similar to the original TSI as possible, while simply solving for its biggest weakness. A TSI is extremely noisy and overly reactive as is well documented in the finance industry which is why most now use RSI or MACD, What I did was apply a few conditional equations that when placed together form a filter that quells the re-activeness in the data that normally leads to the noise and this transfers across different time frames.
What Is the True Strength Index (TSI)?
The true strength index (TSI) is a momentum oscillator used to identify trends and reversals. The indicator may be useful for determining overbought and oversold conditions, indicating potential trend direction changes via centerline or signal line crossovers, and warning of trend weakness through divergences.
The TSI fluctuates between positive and negative territory. Positive territory means the bulls are more in control of the asset. Negative territory means the bears are more in control.
When the indicator divergences with price, the TSI may be signaling the price trend is weakening and may reverse.
A signal line can be applied to the TSI indicator. When the TSI crosses above the signal line it can be used as a buy signal, and when it crosses below, a sell signal. Such crossovers occur frequently, so use with caution.
Overbought and oversold levels will vary by the asset being traded.
The default settings are optimized for 20m, 3H, and 12H timeframes by default for BTC . Find your own settings for whatever security to gain your edge!
For any additional educational material please search for tutorials on TSI's, they will translate very well into this application but without the noisiness normally found within those same tutorial.
Additionally this indicator provides a dead band which allows users to pre-define what they wish to see as their cut-off for their entry and exit signal when trading.
In-depth tooltips have been included for additional help.

TSI in Dynamic Zones with Divergence and Pivot PointsTrue Strength Index , or TSI is considered a "leading indicator" - in contrast to a "lagging indicator" just as Moving Averages it does not show a confirmation what already happened, but it shows what can happen in the future. For example: The chart is climbing while the TSI oscillator is slowly declining, gets weaker and weaker, maybe even prints bearish divergences? That means that a reversal might be occurring soon. Leading indicators are best paired with Stop and Resistance Lines, General Trendlines , Fib Retracements etc. Your chart is approaching a very important Resistance Trendline but the TSI shows a very positive signal? That means there is a high probability that the Resistance is going to be pushed through and becomes Support in the future.
What are those circles?
-These are Divergences. Red for Regular-Bearish. Orange for Hidden-Bearish. Green for Regular-Bullish. Aqua for Hidden-Bullish.
What are those triangles?
- These are Pivots . They show when the TSI oscillator might reverse, this is important to know because many times the price action follows this move.
What are these blue or orange areas?
- Those are dynamic zones. For the analysis of the TSI its important to know if the indicator is in a state of oversold or overbought to filter out ranging price movement. Normally those zones are static, in this version of the TSI oscillator dynamic zones were added to show a dynamic calculation whether the TSI oscillator is oversold, overbought or ranging.
Please keep in mind that this indicator is a tool and not a strategy, do not blindly trade signals, do your own research first! Use this indicator in conjunction with other indicators to get multiple confirmations.

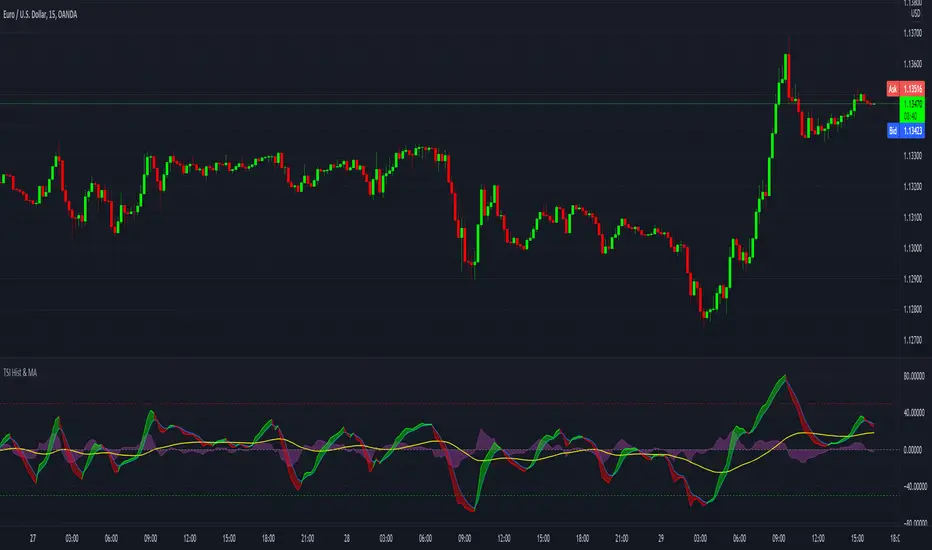
TSI with histogram and MA - SamXThis is an enhanced TSI. The others I've found on here have generally lacked sufficient settings context and/or alert definitions, so I made this version to address those gaps. In addition to that, I also added a way to plot a user-customizable moving average line of the TSI to better help identify trending conditions across TSI swings.
Multiple Indicators ScreenerA screener for multiple indicators with nice table output.
I was asked many times to update custom screener to display results in a table form. This way it looks much better.
You can play with background colors depend on values you're looking for.
In the screener, for example, I'm highlighting overbought/oversold RSI values, big ADX levels and trend of the Supertrend.
In parameters you can change settings for all indicators and change/disable tickers if 40 is too many for you.
There is only 1 function that calculates all these indicators. Potentially you can change and even add more indicators to this function.
Writing code for these kind of screener is a bit time consuming, so I even created a code generator in Python for these kind of indicators :) .
Disclaimer
Please remember that past performance may not be indicative of future results.
Due to various factors, including changing market conditions, the strategy may no longer perform as well as in historical backtesting.
This post and the script don’t provide any financial advice.

Library_All_In_OneLibrary "Library_All_In_One"
fnRSI()
fnTSI()
Discription:
Contains several functions of Pinescript all in one Library. This reduce your coding.
How to use:
import Wilson-IV/Library_All_In_One/1 as _lib
Examples of plotting the RSI and TSI:
plot(_lib.fnRSI(close, 14))
plot(_lib.fnTSI(close, 25, 14))
Markets:
It can be used to all markets.
NOTE:
It will expands with more function during time.

True Strength Index Histogram [Futures Market]This is a modified version of True Strength Index to fit the scalping trading style in futures market

EWO Breaking Bands & XTLElliott Wave Principle, developed by Ralph Nelson Elliott , proposes that the seemingly chaotic behaviour of the different financial markets isn’t actually chaotic. In fact the markets moves in predictable, repetitive cycles or waves and can be measured and forecast using Fibonacci numbers. These waves are a result of influence on investors from outside sources primarily the current psychology of the masses at that given time. Elliott wave predicts that the prices of the a traded currency pair will evolve in waves: five impulsive waves and three corrective waves. Impulsive waves give the main direction of the market expansion and the corrective waves are in the opposite direction (corrective wave occurrences and combination corrective wave occurrences are much higher comparing to impulsive waves)
The Elliott Wave Oscillator ( EWO ) helps identifying where you are in the 5 / 3 Elliott Waves , mainly the highest/lowest values of the oscillator might indicate a potential bullish / bearish Wave 3. Mathematically expressed, EWO is the difference between a 5 period and 35 period moving average. In this study instead 35-period, Fibonacci number 34 is implemented for the slow moving average and formula becomes ewo = sma (HL2, 5) - sma (HL2, 34)
The Elliott Wave Oscillator enables traders to track Elliott Wave counts and divergences. It allows traders to observe when an existing wave ends and when a new one begins. Included with the EWO are the breakout bands that help identify strong impulses.
The Expert Trend Locator ( XTL ) was developed by Tom Joseph (in his book Applying Technical Analysis) to identify major trends, similar to Elliott Wave 3 type swings.
Blue bars are bullish and indicate a potential upwards impulse.
Red bars are bearish and indicate a potential downwards impulse.
White bars indicate no trend is detected at the moment.
Added "TSI Arrows". The arrows is intended to help the viewer identify potential turning points. The presence of arrows indicates that the TSI indicator is either "curling" up under the signal line, or "curling" down over the signal line. This can help to anticipate reversals, or moves in favor of trend direction.

FOTSI - Open sourceI WOULD LIKE TO SPECIFY TWO THINGS:
- The indicator was absolutely not designed by me, I do not take any credit and much less I want them, I am just making this fantastic indicator open source and accessible to all
- The script code was not recycled from other indicators, but was created from 0 following the theory behind it to the letter, thus avoiding copyright infringement
- Advices and improvements are accepted, as having very little programming experience in Pine Script I consider this work still rough and slow
WHAT IS THE FOTSI?
The FOTSI is an oscillator that measures the relative strength of the individual currencies that make up the 28 major Forex exchanges.
By identifying the currencies that are in the overbought (+50) and oversold (-50) areas, it is possible to anticipate the correction of a currency pair following a strong trend.
THE THEORY BEHIND
1) At the base of everything is the 1-period momentum (close-open) of the single currency pairs that contain a certain currency. For example, the momentum of the USD currency is composed of all the exchange rates that contain the US dollar inside it: mom_usd = - mom_eurusd - mom_gbpusd + mom_usdchf + mom_usdjpy - mom_audusd + mom_usdcad - mom_nzdusd. Where the base currency is in second position, the momentum is subtracted instead of adding it.
2) The IST formula is applied to the momentum of the individual currencies obtained. In this way we get an oscillator that oscillates between 0 and its overbought and oversold areas. The area between +25 and -25 is an area in which we can consider the movements of individual currencies to be neutral.
3) The TSI is nothing more than a double smoothing on the momentum of individual currencies. This particularity makes the indicator very reactive, minimizing the delays of the trend reversal.
HOW TO USE
1) A currency is identified that is in the overbought (+50) or oversold (-50) area. Example GBP = 50
2) The second currency is identified as the one most opposite to the first. Example USD = -25
3) The currency pair consisting of the two currencies opens. So GBP / USD
4) Considering that GBP is oversold, we anticipate its future devaluation. So in this case we are short on GBP / SUD. Otherwise if GBP had been oversold (-50) we expect its future valuation and therefore we enter long.
5) It is used on the H1, H4 and D1 timeframes
6) Closing conditions: the position on the 50-period exponential moving average is split / the position at target on the 100-period exponential moving average is closed
7) Stoploss: it is recommended not to use it, if you want to use it it is equivalent to 5 times the ATR on the reference timeframe
8) Position sizing: go very slow! Being a counter-trend strategy, it is very risky to position yourself heavily. Use common sense in everything!
9) To insert the alerts that warn you of an overbought and oversold condition, it is necessary to enter the signals called "Overbought Signal" and "Oversold Signal" for each chart used, in the specific Trading View window. like me using multiple charts in the same window.
I hope you enjoy my work. For any questions write in the comments.
Thanks <3
//--------------------------------------------------------------------------------------------------------------------------------------------------------------------------------------------------------------
TENGO A PRECISARE DUE COSE:
- L'indicatore non è stato assolutamente ideato da me, non mi assumo nessun merito e tanto meno li voglio, io sto solo rendendo questo fantastico indicatore open source ed accessibile a tutti
- Il codice dello script non è stato riciclato da altri indicatori, ma è stato creato da 0 seguendo alla lettere la teoria che sta alla sua base, evitando così di violare il copyright
- Si accettano consigli e migliorie, visto che avendo pochissima esperienza di programmazione in Pine Script considero questo lavoro ancora grezzo e lento
COS'È IL FOTSI?
Il FOTSI è un oscillatore che misura la forza relativa delle singole valute che compongono i 28 cambi major del Forex.
Individuando le valute che si trovano nelle aree di ipercomprato (+50) ed ipervenduto (-50) , è possibile anticipare la correzione di una coppia valutaria al seguito di un forte trend.
LA TEORIA ALLA BASE
1) Alla base di tutto c'è il momentum ad 1 periodo (close-open) delle singole coppie valutarie che contengono una determinata valuta. Ad esempio il momentum della valuta USD è composto da tutti i cambi che contengono il dollaro americano al suo interno: mom_usd = - mom_eurusd - mom_gbpusd + mom_usdchf + mom_usdjpy - mom_audusd + mom_usdcad - mom_nzdusd . Ove la valuta base si trova in seconda posizione si sottrae il momentum al posto che sommarlo.
2) Si applica la formula del TSI ai momentum delle singole valute ottenute. In questo modo otteniamo un oscillatore che oscilla tra lo 0 e le sue aree di ipercomprato ed ipervenduto. L'area compresa tra +25 e -25 è un area in cui possiamo considerare neutri i movimenti delle singole valute.
3) Il TSI non è altro che un doppio smoothing sul momentum delle singole valute. Questa particolarità rende l'indicatore molto reattivo, minimizzando i ritardi dell'inversione del trend.
COME SI USA
1) Si individua una valuta che si trova nell'area di ipercomprato (+50) o ipervenduto (-50) . Esempio GBP = 50
2) Si individua come seconda valuta quella più opposta alla prima. Esempio USD = -25
3) Si apre la coppia di valuta composta dalle due valute. Quindi GBP/USD
4) Considerando che GBP è in fase di ipervenduto prevediamo una sua futura svalutazione. Quindi in questo caso entriamo short su GBP/SUD. Diversamente se GBP fosse stato in fase di ipervenduto (-50) ci aspettiamo una sua futura valutazione e quindi entriamo long.
5) Si usa sui timeframe H1, H4 e D1
6) Condizioni di chiusura: si smezza la posizione sulla media mobile esponenziale a 50 periodi / si chiude la posizione a target sulla media mobile esponenziale a 100 periodi
7) Stoploss: è consigliato non usarlo, nel caso lo si voglia utilizzare esso equivale a 5 volte l'ATR sul timeframe di riferimento
8) Position sizing: andateci molto piano! Essendo una strategia contro trend è molto rischioso posizionarsi in modo pesante. Usate il buonsenso in tutto!
9) Per inserire gli allert che ti avvertono di una condizione di ipercomprato ed ipervenduto, è necessario inserire dall'apposita finestra di Trading View i segnali denominati "Segnale di ipercomprato" ed "Segnale di ipervenduto" per ogni grafico che si usa, nel caso come me che si utilizzano più grafici nella stessa finestra.
Spero che possiate apprezzare il mio lavoro. Per qualsiasi domanda scrivete nei commenti.
Grazie<3

HULLTSIBOTDo you like TSI indicator?
Do you like HMA indicator?
The all new, HULLTSIBOT indicator!
About:
TSI indicator was on a space mission to mine other planets and then the crew stumbled upon a bunch of HMA indicator eggs. In the darkness of the slime room they found, There was a suddenly a bunch of failing and swearing and machinegun fire muzzle flashes, then all fell silent.
from the back shadow mist stepped forward a TSI indicator, but its eyes were bloodshot and it did not look the same...
The rescue ship found the TSI indicator motionless but still with a heartbeat....
a few days went past, the TSI indicator layed in the medic bay,
A medic noticed a bulge in the abdomen, that started to move!
The alien lifeform burst through the stomach of the TSI indicator and flew at the medic, covering the face and overpowering the new victim with ease...
Quickly it spread throughout the entire rescue ships crew, with many new alien lifeforms searching every corner for a new host.
The rescue ship flew on, able to land with autopilot as programmed for in emergencies, Thus the HULLTSIBOT was introduced to the humans world...
planet earth
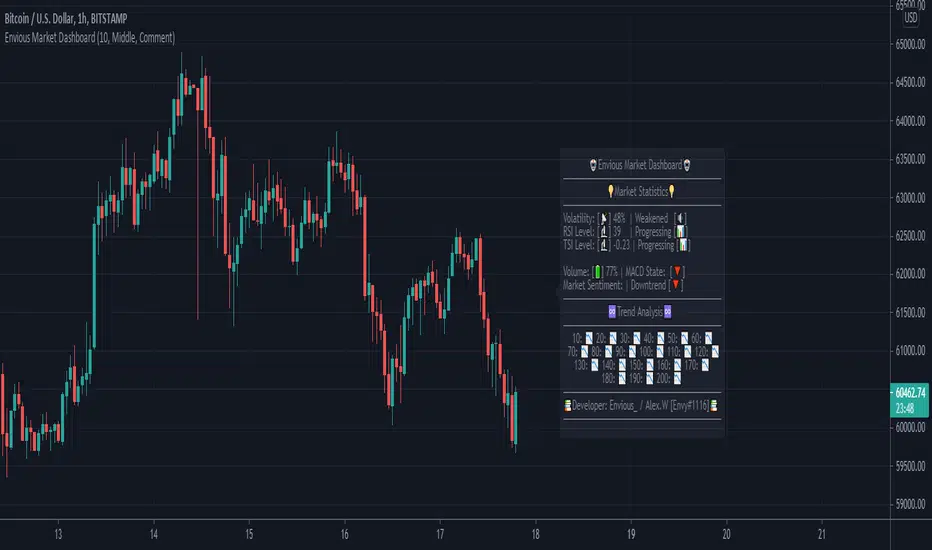
Envious Market DashboardHey traders, this is a market dashboard that can be useful to have on top of your charts. It provides information of the trends discovered, the volatility, the current MACD Trend, the current trend, RSI level, RSI Overbought / Oversold state, TSI level, TSI Overbought / Oversold state, the volume percentage, and more. You can customise the dashboard location, the colour of the dashboard, the background of the dashboard and its background colour. Hope this is useful to you traders :).
Multiple Screeners with AlertsI already published few version of my custom screeners. Unfortunately, because of TradingView's security function call limit you can't use more than 40 stocks in 1 screener.
Fortunately, you can compute multiple values in your function and screen few indicators at once.
In this script I show how you can compute 5 indicators at the same time for 40 instruments. I display then in different labels.
Every label consist of list of instruments satisfying current indicator conditions and a value for it. It can be absolute value as for RSI or -1/1 representing Bullish/Bearish event.
Also you can create 1 alert with result of all screeners inside.
In this example I took 5 indicators with following conditions:
RSI - "RSI < 30" or "RSI > 70"
TSI - "TSI < -30" or "RSI >30"
ADX - "ADX > 40"
MACD - "MACD Bullish Cross" or "MACD Bearish Cross" (1 and -1 in screener)
AO - "AO Crosses 0 UP" or "AO Crosses 0 DOWN" (1 and -1 in screener)
Params
- bars_apart - this parameter define how may bars apart you labels are on your chart. If you see labels overlapping, increase this number.
- Parameters for all used indicators
- 40 symbol inputs for instruments you want to use in this screener
Alerts
You can create an alert from it easily by selecting screener name from the list and then selecting "Any alert() function call".
No additional configuration is required, message and alert on close is generated in the code.
You should better change default name for your alert. Sometimes because of big amount of inputs you might receive an error.
Disclaimer
Please remember that past performance may not be indicative of future results.
Due to various factors, including changing market conditions, the strategy may no longer perform as good as in historical backtesting.
This post and the script don’t provide any financial advice.

Altered True Strength Indicator (TSI) Reupload-
Altered TSI provides a slightly more volatile signal that demonstrates extremities in price action with greater success than standard TSI. In addition, I added bull/bear cross indicators (green/red) to make it easier to notice the crosses to save time when the market is moving fast (I couldn't find a regular TSI script with this addition). Finally, the signal also has overextension parameters (red and green lines)
I think this is best used on Intraday time frames as the signals respond to volatility very well and using Heikin Ashi candles, trend is more visual. In this particular example, I am showing SPY on the 3m time chart (my favorite short time frame) and the signal alone provided many opportunities for trades when using simple divergences and countering overextension direction when short term (blue) signal crosses either
In the first example (purple lines), SPY ramps but it was a dull signal given the signal strength flatlining- we would be looking for a short entry. When the signal fires, it provides a clean $1.50 move down in spy.
In the second example (orange), the blue signal provides a nice V shape (rebound signal) in which we are looking for a long entry. 390.50 is a strong SPY support in confluence with 2nd std dev VWAP extension, but disregarding that bull signal fires resulting in a 2 dollar move upwards. Exit is provided when blue line crosses green overextension.
In the third example (white), we are searching for a short entry at 392.5 resistance in confluence with divergently higher highs. Bear cross signal when fired and a significant cross is visible provides a $2.50 move to the downside with a potential exit provided when blue line crosses red overextension line in confluence with previous LOD area.
In the fourth example (green), we watch as the blue line provides a V pattern, we are searching for a long entry. If you didn't take a riskier long at 2nd std dev VWAP overextension with V recovery on blue line at red overextension for a ride to vwap, then you are looking for a secondary entry long as you wouldn't take the trade at resistance (vwap). Bullishly divergent lows provide this entry and the signal does not bear cross at all (but looking for significant crosses is more important even if the signal were to make a minor bear cross). Bullishly divergent double bottom provides a long entry to end of day with a nice clean signal for a $5.00 move until eod or when signal crosses overextension range.
Ideally, close to the money options or SPY/SPXS/SPXL are best used in the intraday time frame.
Again, this is not a standalone indicator but it's best used in conjunction with other indicators/trading strategies
Any questions feel free to comment

TSI HMA CCIHi!
This strategy has TSI and CCI indicators with the CCI being based on a HMA instead of the Price.
There is a number of conditions that must combine to create buy or sell signals, but it is basically a couple of MA crossovers.
The strategy opens new orders on each candle if the conditions are met, Either direction, so it is hedging.
It wont open new orders if there is a floating loss, and so is constantly attempting to hold a floating profit (drawup instead of drawdown)
But It has a StopLoss (set by user) for closing of losing orders, and it closes all orders in basket style when account is in profit to users set amount target profit.
Low commission set to simulate swap but Forex pairs generally dont have commission like the crypto exchanges do. So if you use this on cryptos, remember to increase the commission to your brokers amount.
Crypto users will likely find that because this opens so many orders the commission could erase its profits.
So i recommend this for Forex only, and perhaps, only NZDUSD 4H chart. other pairs, change settings for.
The strategy has settings for testing on target time spans, so you could test it on just Jan-Feb 2020 for example, if you want, or from Jan 2020 to present day.
Have Fun! Open Script for copy/paste/edit/publish your own version :)

TSI Strength Meter vs USD with divergenceThis indicator consists of two lines. One is a gray line (USD) and the asset indicator is green or red.
The basis of this indicator is the true strength indicator (TSI) with parameters 5,15. Both line sets are based on a TSI (5,15).
The lookback period is for new highs / new lows. Default value is 200 periods.
GREEN/RED LINE
The first that is green and red is whatever you choose to display ( BTC in this case).
The green and red lines indicate going up or going down.
GRAY LINE
The gray line is the US Dollar . So everything is relative to that by default.
ZERO LINE CROSSES
These are momentum shifts. If you see a crossover of both around the zero line, its a good indication there is a change in momentum and a reversal of trend.
NEW HIGHS NEW LOWS
There are 4 new colors added to this indicator. For the asset you are viewing, a lime color means new highs within the lookback period. A new low is indicated by a yellow line color.
The new lows for the USD are white for new lows within the lookback period and blue line for the new highs.
DIVERGENCE
You can also spot divergences easily. For example, if a lime color is seen on the indicator line, that means "new high" but if it occurs below the last "new high" it means the asset is going up to new highs but the indicator is showing us that the readings are below the previous new highs, indicating a negative divergence.
The same goes for the yellow colored lines. higher yellows mean positive divergence.
And with the US Dollar , blue lines dropping means a negative divergence in the US Dollar , while white lines moving up means a positive dollar divergence.
INTERPRETATION
Examples:
If you see a green and sometimes red line of the asset indicator and a gray line that drops below the zero line; it may mean the asset is rising and the trend is up.
If you see a green and red line below the zero line and with a gray line above the zero line , it indicates there is a negative trend. If you suddenly see blue lines on the USD, this means its hitting new lows. If these blue lines then start to slowly move downwards; then we have a positive divergence. If that were to be followed by the green line crossing the zero line, its a pretty good be that the trend is changing and its a very good buying oportunity.

Volume Correlation Indicator [Fournier-Eaton]This script combines two correlation indicators into one:
Volume Oscillator Correlation
Price Correlation
Rationale : This script is predicated on the following premise: we rely often on price correlation. However, we overlook volume-volume correlation too often. The volumetric correlative decoupling of an equity and index or equity - equity can yield important information (and produce it as early or earlier than price-correlation).
Mechanism :
The primary component of this chart is the Volume Correlation Indicator (as red histogram). This is the correlation between the Volume Oscillator of current chart's symbol and the VO of your chosen comparison.
Secondarily, the standard price correlation is also charted for added information in line format.
Example : In the chart attached to this publication, note the following cases:
Case 1: The price correlation with QQQ was increasing as earnings approached. However, the volume correlation with QQQ was clearly decoupled as earnings approached.
Case 2: Contrastingly, other dips in price correlation can be found were volume correlations were behaving in tandem.
Note1: This is the first in a series of volume correlation indicators. Please let me know if you find this useful.

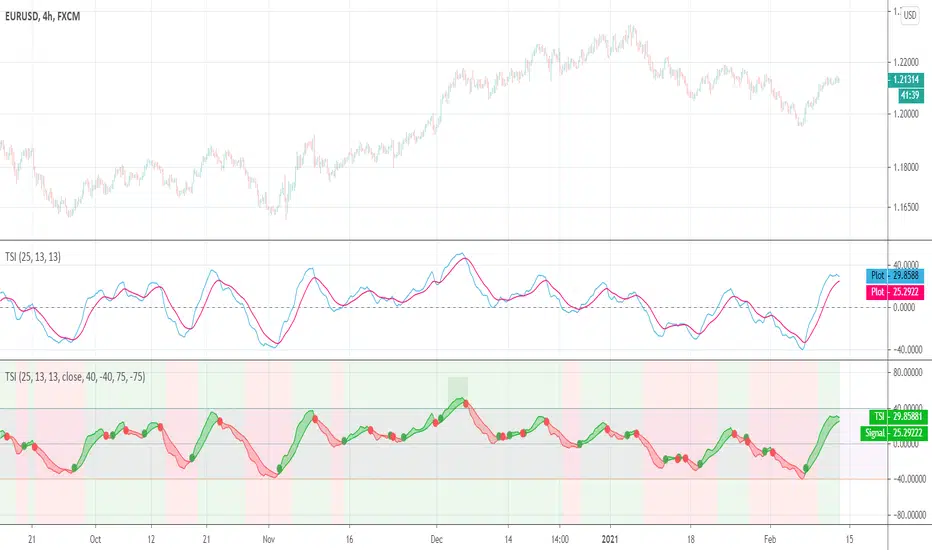
True Strength Index (TSI)User request. A tuned version of the built-in True Strength Index (TSI) indicator with the following options included:
TSI - Signal Histogram
TSI/Signal Crossovers
TSI/Signal Ribbon
Bands breakouts highlighting
Zero line crossovers background
Combo Backtest 123 Reversal & Ergodic TSI This is combo strategies for get a cumulative signal.
First strategy
This System was created from the Book "How I Tripled My Money In The
Futures Market" by Ulf Jensen, Page 183. This is reverse type of strategies.
The strategy buys at market, if close price is higher than the previous close
during 2 days and the meaning of 9-days Stochastic Slow Oscillator is lower than 50.
The strategy sells at market, if close price is lower than the previous close price
during 2 days and the meaning of 9-days Stochastic Fast Oscillator is higher than 50.
Second strategy
r - Length of first EMA smoothing of 1 day momentum 4
s - Length of second EMA smoothing of 1 day smoothing 8
u- Length of third EMA smoothing of 1 day momentum 6
Length of EMA signal line 3
Source of Ergotic TSI Close
This is one of the techniques described by William Blau in his book "Momentum,
Direction and Divergence" (1995). If you like to learn more, we advise you to
read this book. His book focuses on three key aspects of trading: momentum,
direction and divergence. Blau, who was an electrical engineer before becoming
a trader, thoroughly examines the relationship between price and momentum in
step-by-step examples. From this grounding, he then looks at the deficiencies
in other oscillators and introduces some innovative techniques, including a
fresh twist on Stochastics. On directional issues, he analyzes the intricacies
of ADX and offers a unique approach to help define trending and non-trending periods.
WARNING:
- For purpose educate only
- This script to change bars colors.

Combo Strategy 123 Reversal & Ergodic TSI This is combo strategies for get a cumulative signal.
First strategy
This System was created from the Book "How I Tripled My Money In The
Futures Market" by Ulf Jensen, Page 183. This is reverse type of strategies.
The strategy buys at market, if close price is higher than the previous close
during 2 days and the meaning of 9-days Stochastic Slow Oscillator is lower than 50.
The strategy sells at market, if close price is lower than the previous close price
during 2 days and the meaning of 9-days Stochastic Fast Oscillator is higher than 50.
Second strategy
r - Length of first EMA smoothing of 1 day momentum 4
s - Length of second EMA smoothing of 1 day smoothing 8
u- Length of third EMA smoothing of 1 day momentum 6
Length of EMA signal line 3
Source of Ergotic TSI Close
This is one of the techniques described by William Blau in his book "Momentum,
Direction and Divergence" (1995). If you like to learn more, we advise you to
read this book. His book focuses on three key aspects of trading: momentum,
direction and divergence. Blau, who was an electrical engineer before becoming
a trader, thoroughly examines the relationship between price and momentum in
step-by-step examples. From this grounding, he then looks at the deficiencies
in other oscillators and introduces some innovative techniques, including a
fresh twist on Stochastics. On directional issues, he analyzes the intricacies
of ADX and offers a unique approach to help define trending and non-trending periods.
WARNING:
- For purpose educate only
- This script to change bars colors.
