Stochastic Momentum Index (SMI) of Money Flow Index (MFI)"He who does not know how to make predictions and makes light of his opponents, underestimating his ability, will certainly be defeated by them."
(Sun Tzu - The Art of War)
▮ Introduction
The Stochastic Momentum Index (SMI) is a technical analysis indicator that uses the difference between the current closing price and the high or low price over a specific time period to measure price momentum.
On the other hand, the Money Flow Index (MFI) is an indicator that uses volume and price to measure buying and selling pressure.
When these two indicators are combined, they can provide a more comprehensive view of price direction and market strength.
▮ Improvements
By combining SMI with MFI, we can gain even more insights into the market. One way to do this is to use the MFI as an input to the SMI, rather than just using price.
This means we are measuring momentum based on buying and selling pressure rather than just price.
Another way to improve this indicator is to adjust the periods to suit your specific trading needs.
▮ What to look
When using the SMI MFI indicator, there are a few things to look out for.
First, look at the SMI signal line.
When the line crosses above -40, it is considered a buy signal, while the crossing below +40 is considered a sell signal.
Also, pay attention to divergences between the SMI MFI and the price.
If price is rising but the SMI MFI is showing negative divergence, it could indicate that momentum is waning and a reversal could be in the offing.
Likewise, if price is falling but the SMI MFI is showing positive divergence, this could indicate that momentum is building and a reversal could also be in the offing.
In the examples below, I show the use in conjunction with the price SMI, in which the MFI SMI helps to anticipate divergences:
In summary, the SMI MFI is a useful indicator that can provide valuable insights into market direction and price strength.
By adjusting the timeframes and paying attention to divergences and signal line crossovers, traders can use it as part of a broader trading strategy.
However, remember that no indicator is a magic bullet and should always be used in conjunction with other analytics and indicators to make informed trading decisions.
Indicador de Força Real (TSI)

Stochastic Momentum Index (SMI) Refurbished▮Introduction
Stochastic Momentum Index (SMI) Indicator is a technical indicator used in technical analysis of stocks and other financial instruments.
It was developed by William Blau in 1993 and is considered to be a momentum indicator that can help identify trend reversal points.
Basically, it's a combination of the True Strength Index with a signal line to help identify turning points in the market.
SMI uses the stochastic formula to compare the current closing price of an asset with the maximum and minimum price range over a specific period.
He then compares this ratio to a short-term moving average to create an indicator that oscillates between -100 and +100.
When the SMI is above 0, it is considered positive, indicating that the current price is above the short-term moving average.
When it is below 0, it is considered negative, indicating that the current price is below the short-term moving average.
Traders use the SMI to identify potential trend reversal points.
When the indicator reaches an extreme level above +40 or below -40, a trend reversal is possible.
Furthermore, traders also watch for divergences between the SMI and the asset price to identify potential trading opportunities.
It is important to remember that the SMI is a technical indicator and as such should be used in conjunction with other technical analysis tools to get a complete picture of the market situation.
▮ Improvements
The following features were added:
1. 7 color themes, for TSI, Signal and Histogram.
2. Possibility to customize moving average type for TSI/Signal.
3. Dynamic Zones.
4. Crossing Alerts.
5. Alert points on specific ranges.
5. Coloring of bars according to TSI/Signal/Histogram.
▮ Themes
Examples:
▮ About Dynamic Zones
'Most indicators use a fixed zone for buy and sell signals.
Here's a concept based on zones that are responsive to the past levels of the indicator.'
The concept of Dynamic Zones was described by Leo Zamansky ( Ph .D.) and David Stendahl, in the magazine of Stocks & Commodities V15:7 (306-310).
Basically, a statistical calculation is made to define the extreme levels, delimiting a possible overbought/oversold region.
Given user-defined probabilities, the percentile is calculated using the method of Nearest Rank.
It is calculated by taking the difference between the data point and the number of data points below it, then dividing by the total number of data points in the set.
The result is expressed as a percentage.
This provides a measure of how a particular value compares to other values in a data set, identifying outliers or values that are significantly higher or lower than the rest of the data.
▮ What to look for
1. Divergences/weakening of a trend/reversal:
2. Supports, resistances, pullbacks:
3. Overbought/Oversold Points:
▮ Thanks and Credits
- TradingView and PineCoders: for SMI and Moving Averages
- allanster: for Dynamic Zones

Athena Momentum Squeeze - Short, Lean, and Mean This is a very profitable strategy focusing on 15 minute intervals on the Micro Nasdaq Futures contracts. CME_MINI:MNQH2023
As this contract only keeps positions for on average about an hour risk is managed. At a profit factor of 3.382 with a max drawdown of $123 from January 1st to February 15. Looking back to Dec 2019 still maintains a profit factor of 1.3.
See backtesting: www.screencast.com
2019 backtesting: www.screencast.com
Based on the classic Lazy Bear Oscillator Squeeze with a number of modifications from ADX, MAs and adding fibonacci levels.
We like keeping strategies simple yet powerful, no completely where you can't understand your own trades.
Our team is always modifying and improving the strategy. Always open to collaborating on improving as there is no perfect strategy. www.screencast.com

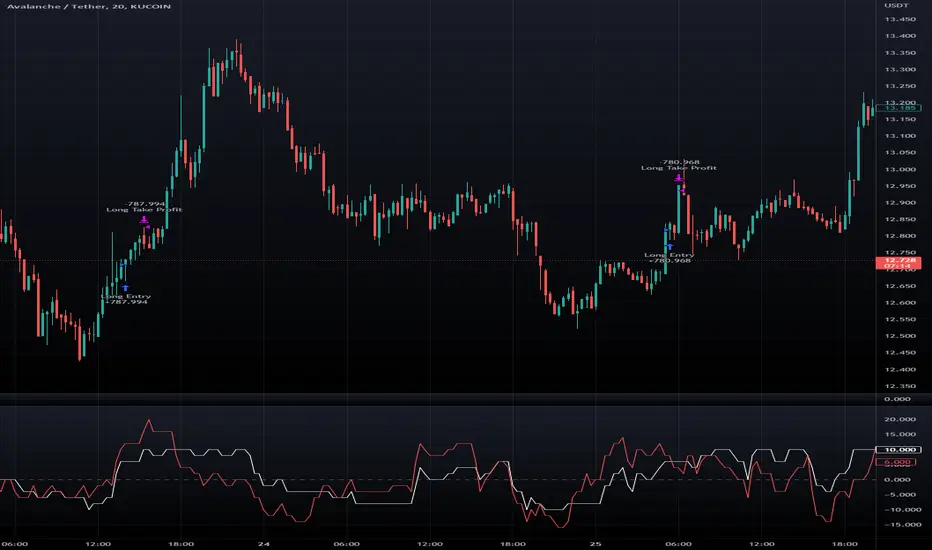
Macro Score - TSI-BasedA "macro score", as defined here, is created by giving various weights to different signals and adding them together to get one smooth score. Positive or negative values are assigned to each of the signals depending on if the statement is true or false (e.g. DPO > 0: +1, DPO < 0: -1). This manner of strategy allows for a subset of the available signals to be present at one time as opposed to every technical signal having to be active in order for a long/short signal to trigger.
This strategy has the signals and weights pre-determined in the code. Heaviest weights have been given to various TSI (True Strength Index) signals, including a crossover/crossunder of TSI signal and TSI value, a threshold for the TSI Signal (above or below 0), and a crossover/crossunder of the CMO (Chande Momentum Oscillator) and the TSI signal line. Additionally, there are thresholds for DPO (Detrended Price Oscillator, above or below 0), Jurik Volatility Bands (above or below 0), and Stoch RSI (above or below 50). These three signals hold a lighter weight than the three TSI signals.
The macro score itself is printed in an underlay as a white line that goes between -10 and 10 for this strategy. In addition to the macro score line, a red momentum line (sourced by the macro score itself) has been included. A crossover/crossunder of the macro score and the macro momentum line is included into the long/short signal syntax in addition to a threshold for the macro score (-6/6).
Take profit, stop loss, and trailing percentages are also included, found at the bottom of the Input tab under “TT and TTP” as well as “Stop Loss”. Make sure to understand the TP/SL ratio that you desire before use, as the desired hit rate/profitability percentage will be affected accordingly. This strategy does NOT guarantee future returns. Apply caution in trading regardless of discretionary or algorithmic. Understand the concepts of risk/reward and the intricacies of each strategy choice before utilizing them in your personal trading.
Profitview Settings:
If you wish to utilize Profitview’s automation system, find the included “Profitview Settings” under the Input tab of the strategy settings menu. If not, skip this section entirely as it can be left blank. Options will be “OPEN LONG TITLE”, “OPEN SHORT TITLE”, “CLOSE LONG TITLE”, and “CLOSE SHORT TITLE”. If you wished to trade SOL, for example, you would put “SOL LONG”, “SOL SHORT”, “SOL CLOSE LONG”, and “SOL CLOSE SHORT” in these areas. Within your Profitview extension, ensure that your Alerts all match these titles. To set an alert for use with Profitview, go to the “Alerts” tab in TradingView, then create an alert. Make sure that your desired asset and timeframe are currently displayed on your screen when creating the alert. Under the “Condition” option of the alert, select the strategy, then select the expiration time. If using TradingView Premium, this can be open-ended. Otherwise, select your desired expiration time and date. This can be updated whenever desired to ensure the strategy does not expire. Under “Alert actions”, nothing necessarily needs to be selected unless so desired. Leave the “Alert name” option empty. For the “Message”, delete the generated message and replace it with {{strategy.order.alert_message}} and nothing else.
Cheat Code's RedemptionWELCOME TO THE CHEAT CODE REDEMPTION PACK!!!!
I want to take a deep dive into what this indicator consists of and how you can use it to improve your trading strategy.
-What does the CCR consist of?
The Oscillator:
The oscillator is a combination of a true strength index sampled from on-balance volume and a regular RSI at default settings. The reason I added the on-balance volume is that it does not tend to remain at overbought or oversold conditions as traditional momentum oscillators do.
The Histogram:
The histogram is copied to a tee from the MACD histogram, the only difference here is that I extended the moving averages to depict a special pairing; the ema55 slow and ema21 fast. I then converted it into another true strength index, as the calculations fit all time frames.
The Divergences:
The divergences of an indicator can be extremely useful in catching scalp opportunities, a DARK RED/GREEN represents a REGULAR divergence, while a SALMON/LIGHT GREEN color represents a HIDDEN divergence.
The moving average:
The moving average built into this indicator is depicted as an aqua or yellow line, when the oscillator is moving in an uptrend, the moving average will appear aqua, when the oscillator is in a downtrend it will appear yellow. Use this as confirmation bias or as the third derivative of market position.
Oscillator Colors:
The Oscillator color is an important thesis of this indicator. When the line is green, it means the market is effectively in an uptrend, when it is red, it means the market is in a downtrend. Use this to prevent longing in a serious downtrend and vice versa.
If you have any questions regarding the indicator(s), feel free to reach out to me in the comments or through Direct Message!!!
Safe Trading, Don't get Rekt
- CheatCode1 <3

Divergence for Many Panel (D4MP+)Divergence for Many Panel (D4MP+)
This Divergence for Many Panel indicator is built upon the realtme divergence drawing code originally authored by LonesomeTheBlue, now in the form of a panel indicator.
The available oscillators, hand picked for their ability to identify high quality divergences currently include:
- Ultimate Oscillator (UO)
- True Strength Index (TSI)
- Money Flow Index (MFI)
- Relative Strength Index (RSI)
- Stochastic RSI
- Time Segmented Volume (TSV)
- Cumulative Delta Volume (CDV)
Note : this list of available oscillators may be added to or altered at a later date.
The indicator includes the following features:
- Ability to select any of the above oscillators
- Optional divergence lines drawn directly onto the oscillator in realtime .
- Configurable alerts to notify you when divergences occur.
- Configurable pivot lookback periods to fine tune the divergences drawn in order to suit different trading styles and timeframes, including the ability to enable automatic adjustment of pivot period per chart timeframe.
- Background colouring option to indicate when the selected oscillator has crossed above or below its centerline.
- Alternate timeframe feature allows you to configure the oscillator to use data from a different timeframe than the chart it is loaded on.
- Oscillator name label, so you can clearly see which oscillator is selected, in the case you have multiple loaded onto a chart.
- Optional adjustable range bands.
- Automatic adjustment of line colours, centerlines and range band levels on a per oscillator basis by default.
- Ability to customise the colours of each of the oscillators.
What is the Ultimate Oscillator ( UO )?
“The Ultimate Oscillator indicator (UO) indicator is a technical analysis tool used to measure momentum across three varying timeframes. The problem with many momentum oscillators is that after a rapid advance or decline in price, they can form false divergence trading signals. For example, after a rapid rise in price, a bearish divergence signal may present itself, however price continues to rise. The ultimate Oscillator attempts to correct this by using multiple timeframes in its calculation as opposed to just one timeframe which is what is used in most other momentum oscillators.”
What is the True Strength Index ( TSI )?
"The true strength index (TSI) is a technical momentum oscillator used to identify trends and reversals. The indicator may be useful for determining overbought and oversold conditions, indicating potential trend direction changes via centerline or signal line crossovers, and warning of trend weakness through divergence."
What is the Money Flow Index ( MFI )?
“The Money Flow Index ( MFI ) is a technical oscillator that uses price and volume data for identifying overbought or oversold signals in an asset. It can also be used to spot divergences which warn of a trend change in price. The oscillator moves between 0 and 100. Unlike conventional oscillators such as the Relative Strength Index ( RSI ), the Money Flow Index incorporates both price and volume data, as opposed to just price. For this reason, some analysts call MFI the volume-weighted RSI .”
What is the Relative Strength Index ( RSI )?
"The relative strength index (RSI) is a momentum indicator used in technical analysis. RSI measures the speed and magnitude of a security's recent price changes to evaluate overvalued or undervalued conditions in the price of that security. The RSI can do more than point to overbought and oversold securities. It can also indicate securities that may be primed for a trend reversal or corrective pullback in price. It can signal when to buy and sell. Traditionally, an RSI reading of 70 or above indicates an overbought situation. A reading of 30 or below indicates an oversold condition. It is also commonly used to identify divergences."
What is the Stochastic RSI (StochRSI)?
"The Stochastic RSI (StochRSI) is an indicator used in technical analysis that ranges between zero and one (or zero and 100 on some charting platforms) and is created by applying the Stochastic oscillator formula to a set of relative strength index (RSI) values rather than to standard price data. Using RSI values within the Stochastic formula gives traders an idea of whether the current RSI value is overbought or oversold. The StochRSI oscillator was developed to take advantage of both momentum indicators in order to create a more sensitive indicator that is attuned to a specific security's historical performance rather than a generalized analysis of price change."
What Is Time Segmented Volume?
"Time segmented volume (TSV) is a technical analysis indicator developed by Worden Brothers Inc. that segments a stock's price and volume according to specific time intervals. The price and volume data is then compared to uncover periods of accumulation (buying) and distribution (selling)."
What is Cumulative Volume Delta ( CDV )?
"The CDV analyses the net buying at market price and net selling at market price. This means, that volume delta is measuring whether it is the buyers or sellers that are more aggressive in taking the current market price. It measures the degree of intent by buyers and sellers, which can be used to indicate who is more dominant. The CDV can be used to help identify possible trends and also divergences"
What are divergences?
Divergence is when the price of an asset is moving in the opposite direction of a technical indicator, such as an oscillator, or is moving contrary to other data. Divergence warns that the current price trend may be weakening, and in some cases may lead to the price changing direction.
There are 4 main types of divergence, which are split into 2 categories;
regular divergences and hidden divergences. Regular divergences indicate possible trend reversals, and hidden divergences indicate possible trend continuation.
Regular bullish divergence: An indication of a potential trend reversal, from the current downtrend, to an uptrend.
Regular bearish divergence: An indication of a potential trend reversal, from the current uptrend, to a downtrend.
Hidden bullish divergence: An indication of a potential uptrend continuation.
Hidden bearish divergence: An indication of a potential downtrend continuation.
Setting alerts.
With this indicator you can set alerts to notify you when any/all of the above types of divergences occur, on any chart timeframe you choose.
Configurable pivot periods.
You can adjust the default pivot periods to suit your prefered trading style and timeframe. If you like to trade a shorter time frame, lowering the default lookback values will make the divergences drawn more sensitive to short term price action.
How do traders use divergences in their trading?
A divergence is considered a leading indicator in technical analysis , meaning it has the ability to indicate a potential price move in the short term future.
Hidden bullish and hidden bearish divergences, which indicate a potential continuation of the current trend are sometimes considered a good place for traders to begin, since trend continuation occurs more frequently than reversals, or trend changes.
When trading regular bullish divergences and regular bearish divergences, which are indications of a trend reversal, the probability of it doing so may increase when these occur at a strong support or resistance level . A common mistake new traders make is to get into a regular divergence trade too early, assuming it will immediately reverse, but these can continue to form for some time before the trend eventually changes, by using forms of support or resistance as an added confluence, such as when price reaches a moving average, the success rate when trading these patterns may increase.
Typically, traders will manually draw lines across the swing highs and swing lows of both the price chart and the oscillator to see whether they appear to present a divergence, this indicator will draw them for you, quickly and clearly, and can notify you when they occur.
Disclaimer : This script includes code from several stock indicators by Tradingview as well as the Divergence for Many Indicators v4 by LonesomeTheBlue. With special thanks.

True Strength IndexThe True Strength Index (TSI) is a technical momentum oscillator that can help identify trends and spot reversals. This indicator was developed with about an hour of research, based on the original True Strength Index formula by William Blau. The research material used to create this indicator can be found in the script (released publicly).
Author Notes:
- The zero line is included in this script, since it's a standard feature of the True Strength Index momentum oscillator.
- I did not include support and resistance levels, as I'm still researching the best way to incorporate this, rather than using a simple horizontal line for each.
- The original True Strength Index momentum oscillator utilizes the Exponential Moving Average, but with this release, you have the option to use the Hull Moving Average (as an alternative). Feel free to experiment and adjust the settings to whatever suits your trading style.
- I plan on improving/updating this indicator, but for now, releasing this early version.
* This is being provided as is and the information provided by this script is meant for informational/entertainment purposes only.

TSI + DivergencesTrue Strength Indicator (TSI) + Divergences + Alerts + Lookback periods.
This version of the True Strength Indicator adds the following 3 additional features to the stock TSI by Tradingview:
- Optional divergence lines drawn directly onto the oscillator.
- Configurable alerts to notify you when divergences occur.
- Configurable lookback periods to fine tune the divergences drawn in order to suit different trading styles and timeframes.
This indicator adds additional features onto the stock TSI by Tradingview, whose core calculations remain unchanged. Namely the configurable option to automatically, quickly and clearly draw divergence lines onto the oscillator for you as they occur, with minimal delay. It also has the addition of unique alerts, so you can be notified when divergences occur without spending all day watching the charts. Furthermore, this version of the TSI comes with configurable lookback periods, which can be configured in order to adjust the sensitivity of the divergences, in order to suit shorter or higher timeframe trading approaches.
The True Strength Indicator
Tradingview describes the True Strength Indicator as follows:
“The True Strength Index (TSI) is a momentum oscillator that ranges between limits of -100 and +100 and has a base value of 0. Momentum is positive when the oscillator is positive (pointing to a bullish market bias) and vice versa. It was developed by William Blau and consists of 2 lines: the index line and an exponential moving average of the TSI, called the signal line. Traders may look for any of the following 5 types of conditions: overbought, oversold, centerline crossover, divergence and signal line crossover. The indicator is often used in combination with other signals..”
What are divergences?
Divergence is when the price of an asset is moving in the opposite direction of a technical indicator, such as an oscillator, or is moving contrary to other data. Divergence warns that the current price trend may be weakening, and in some cases may lead to the price changing direction.
There are 4 main types of divergence, which are split into 2 categories;
regular divergences and hidden divergences. Regular divergences indicate possible trend reversals, and hidden divergences indicate possible trend continuation.
Regular bullish divergence: An indication of a potential trend reversal, from the current downtrend, to an uptrend.
Regular bearish divergence: An indication of a potential trend reversal, from the current uptrend, to a downtrend.
Hidden bullish divergence: An indication of a potential uptrend continuation.
Hidden bearish divergence: An indication of a potential downtrend continuation.
Setting alerts.
With this indicator you can set alerts to notify you when any/all of the above types of divergences occur, on any chart timeframe you choose.
Configurable lookback values.
You can adjust the default lookback values to suit your prefered trading style and timeframe. If you like to trade a shorter time frame, lowering the default lookback values will make the divergences drawn more sensitive to short term price action.
How do traders use divergences in their trading?
A divergence is considered a leading indicator in technical analysis, meaning it has the ability to indicate a potential price move in the short term future.
Hidden bullish and hidden bearish divergences, which indicate a potential continuation of the current trend are sometimes considered a good place for traders to begin, since trend continuation occurs more frequently than reversals, or trend changes.
When trading regular bullish divergences and regular bearish divergences, which are indications of a trend reversal, the probability of it doing so may increase when these occur at a strong support or resistance level. A common mistake new traders make is to get into a regular divergence trade too early, assuming it will immediately reverse, but these can continue to form for some time before the trend eventually changes, by using forms of support or resistance as an added confluence, such as when price reaches a moving average, the success rate when trading these patterns may increase.
Typically, traders will manually draw lines across the swing highs and swing lows of both the price chart and the oscillator to see whether they appear to present a divergence, this indicator will draw them for you, quickly and clearly, and can notify you when they occur.
Disclaimer : This script includes code from the stock TSI by Tradingview as well as the RSI divergence indicator.

Follow The Ranging Hull - studyFollow the Ranging hull - Study is a scalping indicator based off momentum and trend
It indicates the current momentum, and shows the momentum and true strength of a higher timeframe through a status window.
Credits:
Hull Suite by InSilico www.tradingview.com
Range Filter Buy and Sell 5 min www.tradingview.com
Follow Line Indicator by Dreadblitz www.tradingview.com
TSI by Everget www.tradingview.com

Ultimate Custom ScreenerThis indicator will allow you to make your custom TradingView screener without coding. Add it to the chart, select up to 40 symbols and five indicators, and the screener will do the rest for you. The indicator will form a lovely table with all values and highlighted signals.
The screener is highly customizable, and you can choose its position on the chart, sorting, order of the columns, colors for the tables, and all signals separately. You can easily change parameters for all supported indicators and their signals.
Currently, there are 19 different custom indicators available. Current list of indicators:
Average Directional Index (ADX) - displaying the value of ADX and checking if it's higher than the threshold
Average True Range (ATR) - showing the value of ATR
Awesome Oscillator (AO) - displaying the value of AO and highlighting positive/negative values.
Bollinger Bands (BB) - showing if the price is above/below/in the channel.
Breakout Pivots - Displaying when the price is below/above the most recent pivot low/high.
Commodity Channel Index (CCI) - shows the last CCI value and highlights overbought/oversold values.
Directional Movement Index (DMI) - Up/Down signal (+DI above or below -DI)
Donchian Channel (DC) - showing if the price is above/below/in the channel.
Historical Volatility (HV) - Current value of Historical Volatility
Keltner Channel (KC) - showing if the price is above/below/in the channel.
Moving Average Convergence Divergence (MACD) - Up/Down signal (MACD above / below signal)
Moving Average Crossover (MA Cross) - Displaying MA crosses signals (SMA, EMA, WMA, HMA, VWMA, SMMA, DEMA, VWAP supported)
Moving Average Distance (MA DIST) - Displaying distance to the MA (SMA, EMA, WMA, HMA, VWMA, SMMA, DEMA, VWAP supported)
Price - Displaying the last price for the instrument
Relative Strength Index (RSI) - Displaying the last RSI value and highlighting overbought/oversold values.
Stochastic (STOCH) - Displaying the last Stochastic value and highlighting overbought/oversold values.
Stochastic RSI (STOCH RSI) - Displaying the last Stochastic RSI value and highlighting overbought/oversold values.
SuperTrend - Current state of the SuperTrend.
True Strength Index (TSI) - Displaying the last TSI value and highlighting overbought/oversold values.
We're already working on adding a few more supported indicators. If you have any ideas about the indicators you want to see in our screener, contact us, and we'll consider them.
Disclaimer
Please remember that past performance may not be indicative of future results.
Due to various factors, including changing market conditions, the strategy may no longer perform as well as in historical backtesting.
This post and the script don’t provide any financial advice.
Multiple Indicator 50EMA Cross AlertsHere’s a screener including Symbol, Price, TSI, and 50 ema cross in a table output.
The 50 Exponential Moving Average is a trend indicator
You can find bullish momentum when the 50 ema crossed over or a bearish momentum when the 50 ema crossed under we are looking to take advantage by trading the reversion of these trends.
True strength index (TSI) is a trend momentum indicator
Readings are bullish when the True Strength Index shows positive values
Readings are bearish when the indicator displays negative values.
When a value is above 20, we look for selling overbought opportunity and when the value is under 20, we look for buying oversold opportunity.
You can select the pair of your choice in the settings.
Make sure to create an alert and choose any alerts then an alert will trigger when a price cross under or cross over the 50 ema for every pair separately.
This allow the user to verify if there is a trade set up or not.
Disclaimer
This post and the script don’t provide any financial advice.

Bogdan Ciocoiu - MoonshotDescription
Moonshot is an indicator that encapsulates the value delivered by the TSI, MACD, Awesome Oscillator and CCI algorithms to produce signals to enable users to enter positions in ideal market conditions. Moonshot integrates the value delivered by the above four algorithms into one script.
This indicator is particularly useful when trading continuation/reversal divergence strategies.
Uniqueness
The Moonshot's uniqueness stands from integrating the above algorithms into the same visual area and leveraging preconfigured parameters suitable for 1-3 minute scalping techniques.
In addition, Moonshot allows swapping or furthermore configuring the above four algorithms in such a way to align signals by colour-coding or shape thickness to aid the users with identifying any emerging patterns quicker.
Furthermore, Moonshot's uniqueness is also reflected in the way it has standardised the outputs of each algorithm to look and feel the same (including the scale at which the shapes are shown) and, in doing so, enables users to plug them in/out as needed.
Open-source
The indicator leverages the following open-source scripts/algorithms:
www.tradingview.com
www.tradingview.com
www.tradingview.com
www.tradingview.com

Trend Trading with Currency Strength MeterThis is a trend trading strategy designed mainly for forex made of two big components:
First we have the currency meter, which is made of taking TSI of different INDEXes such as EUR, USD, GBP, JPY, NZD, AUD , CHF and CAD.
Once we establish which one is the weakest and most powerful, we pair them together and we go on that chart.
Lastly we check with the EMA 200 to confirm our direction.
We can see in this example for the USDJPY chart, that USD is the strongest, JPY is the weakest and ema confirm our bullish trend.
For timeframe in general I recommend big timeframes, 1-4h+ , and as a mentality a swing trading mentality, we can stay in trade for days/weeks.
For exit in general I recommend to exit when either one of the pairs losses/gain power or when the EMA is crossing with current candle
If you have any questions, let me know !

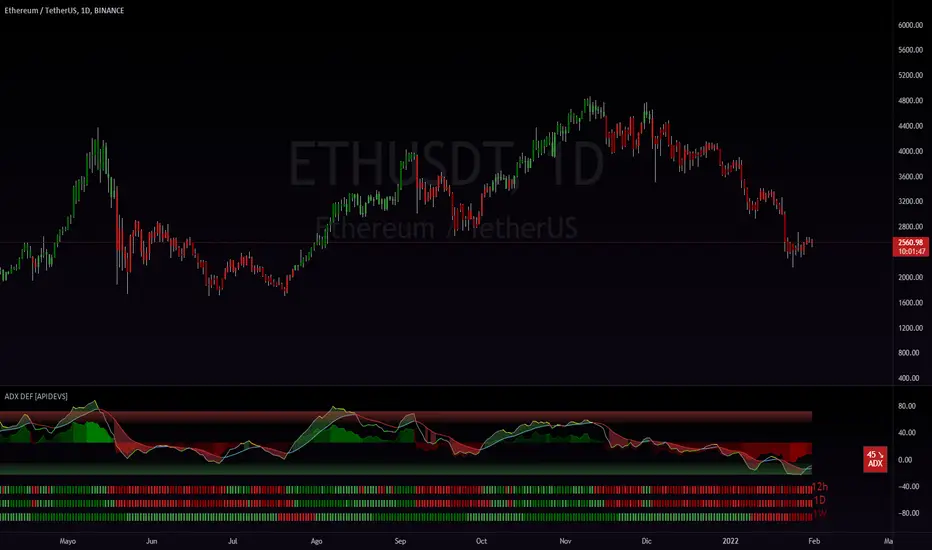
ADX DEF [APIDEVS]------------------------------------ ENGLISH -------------------------------------------------
In this version of the ADX we integrate several additional features to optimize its operation, for its construction we use the DI+ and DI- indicators and transform them into a histogram, this to mark the intensity of the steering force. We also incorporate another strength indicator called True Strengh Index or in Spanish real strength index (TSI) is a momentum oscillator that is used to identify trends and reversals. The indicator can be useful in determining overbought and oversold conditions, indicating possible trend direction changes via center line or signal line crossovers, and warning of trend weakness via divergence
With this incorporation we replace the traditional ADX with a new directional strength indicator which, in addition to marking the strength, allows to establish the reversal points, adding the possibility of showing divergences and observing the weakness of the movement in advance.
We also incorporate our ADX Multi Time-frames which we place at the bottom of the indicator to show the strength of the market in a multi-time frame. finally we add an informative panel where the value of the ADX is shown.
------------------------------------ ESPAÑOL -------------------------------------------------
En esta versión del ADX integramos varias características adicionales para optimizar su funcionamiento, para su construcción utilizamos los indicadores DI+ y DI- y los transformamos en histograma, esto para marcar la intensidad de la fuerza de la dirección. También incorporamos otro indicador de fuerza llamado True Strengh Index o en español índice de fuerza real (TSI) es un oscilador de impulso que se utiliza para identificar tendencias y reversiones. El indicador puede ser útil para determinar las condiciones de sobrecompra y sobreventa , indicando los posibles cambios de dirección de la tendencia a través de cruces de la línea central o de la línea de señal, y advirtiendo de la debilidad de la tendencia a través de la divergencia
Con esta incorporación remplazamos el tradicional ADX por un nuevo indicador de fuerza direccional el cual además de marcar la fuerza permite establecer los puntos de reversión, agregando la posibilidad de mostrar divergencias y observar la debilidad del movimiento con anticipación.
También incorporamos nuestro ADX Multi Time-frames el cual colocamos en la parte baja del indicador para mostrar la fuerza del mercado de modo multitemporal. finalmente añadimos un panel informativo donde se muestra el valor del ADX .
3 Seas - TSI Ergodic WavesThis is my own original approach at a True Strength Index, it uniquely filters out all inputs to remove the noise normally found in a more traditional TSI Oscillator.
My goal was to make my take on the TSI as similar to the original TSI as possible, while simply solving for its biggest weakness. A TSI is extremely noisy and overly reactive as is well documented in the finance industry which is why most now use RSI or MACD, What I did was apply a few conditional equations that when placed together form a filter that quells the re-activeness in the data that normally leads to the noise and this transfers across different time frames.
What Is the True Strength Index (TSI)?
The true strength index (TSI) is a momentum oscillator used to identify trends and reversals. The indicator may be useful for determining overbought and oversold conditions, indicating potential trend direction changes via centerline or signal line crossovers, and warning of trend weakness through divergences.
The TSI fluctuates between positive and negative territory. Positive territory means the bulls are more in control of the asset. Negative territory means the bears are more in control.
When the indicator divergences with price, the TSI may be signaling the price trend is weakening and may reverse.
A signal line can be applied to the TSI indicator. When the TSI crosses above the signal line it can be used as a buy signal, and when it crosses below, a sell signal. Such crossovers occur frequently, so use with caution.
Overbought and oversold levels will vary by the asset being traded.
The default settings are optimized for 20m, 3H, and 12H timeframes by default for BTC . Find your own settings for whatever security to gain your edge!
For any additional educational material please search for tutorials on TSI's, they will translate very well into this application but without the noisiness normally found within those same tutorial.
Additionally this indicator provides a dead band which allows users to pre-define what they wish to see as their cut-off for their entry and exit signal when trading.
In-depth tooltips have been included for additional help.

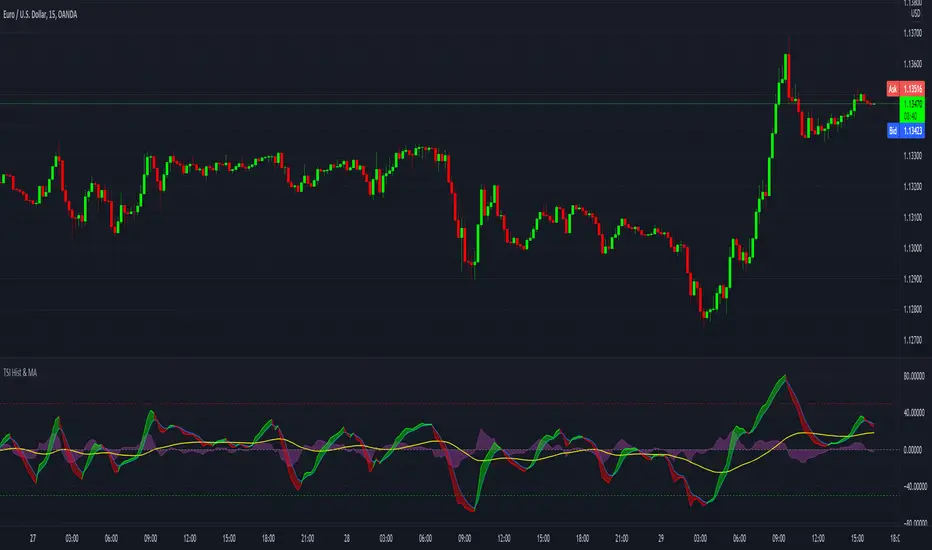
TSI with histogram and MA - SamXThis is an enhanced TSI. The others I've found on here have generally lacked sufficient settings context and/or alert definitions, so I made this version to address those gaps. In addition to that, I also added a way to plot a user-customizable moving average line of the TSI to better help identify trending conditions across TSI swings.
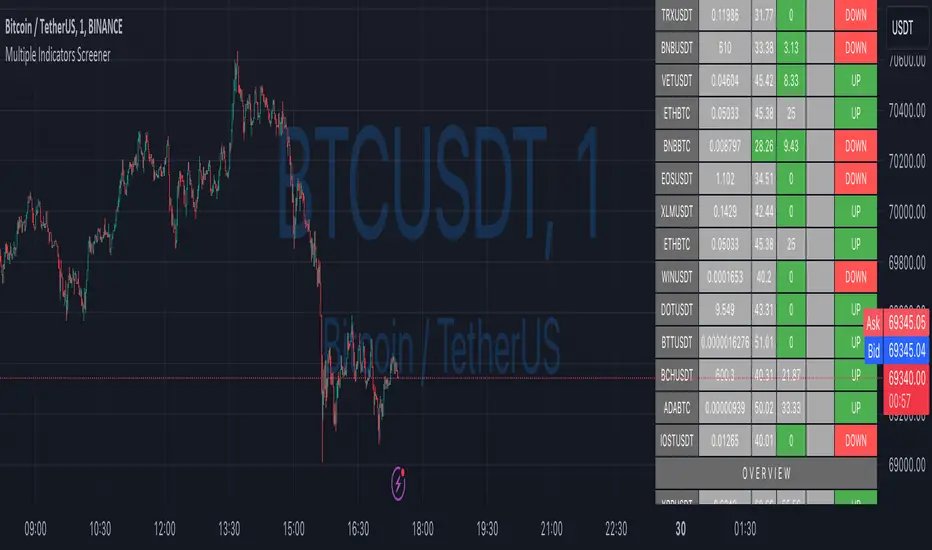
Multiple Indicators ScreenerA screener for multiple indicators with nice table output.
I was asked many times to update custom screener to display results in a table form. This way it looks much better.
You can play with background colors depend on values you're looking for.
In the screener, for example, I'm highlighting overbought/oversold RSI values, big ADX levels and trend of the Supertrend.
In parameters you can change settings for all indicators and change/disable tickers if 40 is too many for you.
There is only 1 function that calculates all these indicators. Potentially you can change and even add more indicators to this function.
Writing code for these kind of screener is a bit time consuming, so I even created a code generator in Python for these kind of indicators :) .
Disclaimer
Please remember that past performance may not be indicative of future results.
Due to various factors, including changing market conditions, the strategy may no longer perform as well as in historical backtesting.
This post and the script don’t provide any financial advice.

Market Strength ScannerHey traders, this is a table-based market relative strength and true strength scanner, designed to allow the users to get data from multiple pairs without having to go onto that pair for their strength's. This indicator uses functions to fetch data from other pairs so that the code is optimised and prevents slow loading. Furthermore, the indicator is easy to understand and use as there isn't a lot of settings for it, you can adjust the length of the true strength index or the relative strength index through one input box, you can change the data type from RSI to TSI without changing the code, and you can customise what pairs you want to display. Furthermore, the user can set alerts for the pairs that they want to have such as setting alerts for overbought and oversold zones. That's all to this indicator and I hope it is of use to some people :)

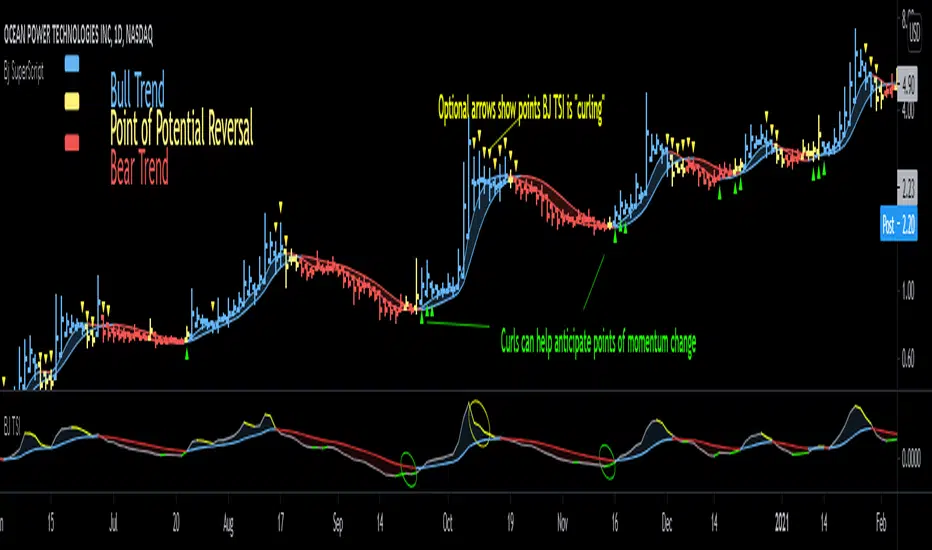
Bjorgum SuperScript
Bjorgum Reversal
Bj Reversal uses Tilson moving averages to identify trend changes
Bars change to yellow as bar close crosses the Tilson moving averages. Blue or red is confirmed as the two Tilson averages themselves cross.
Reversal is great for pinpointing trend change often giving the absolute best entry or exit
Its sensitive nature can mean more false signals on some assets
Be sure to use other indicators from the Bjorgum Collection to confirm signals, or use another strategy that fits the asset or time frame being viewed
Bjorgum HEMA Strategy
Hema uses HA smoothed EMAs to identify trend direction
Default EMA lengths are 5,9, and 21 period
Bar Color will change Malibu or Ruby on a cross of BOTH 5 and 9 EMA
The lengths are customizable to whatever lengths the user desires
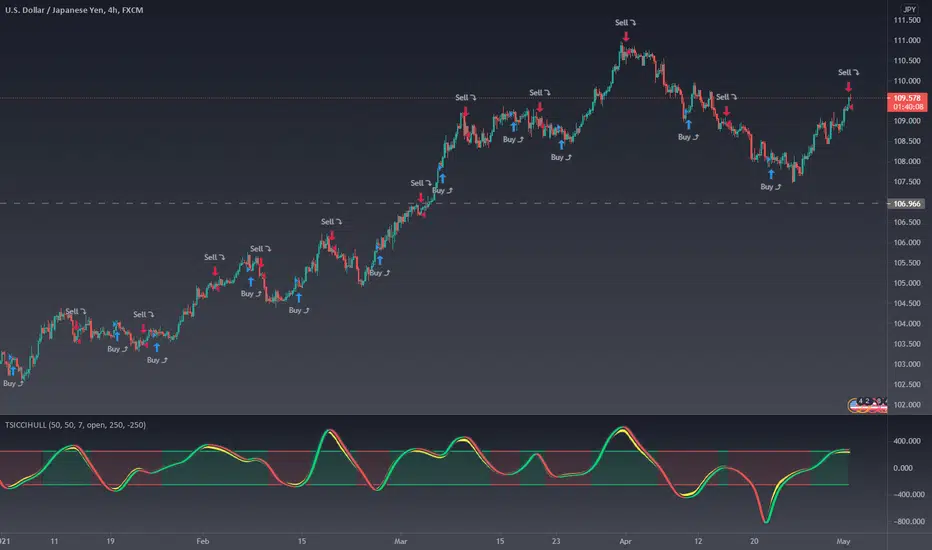
Rolando Santos True Relative Movement (TRM)
This underrated momentum strategy conceptualized by Rolando Santos uses 2 indicators to give a 3 color scheme
A leading indicator (RSI) is combined with a lagging indicator (TSI) to produce bar colors based on the condition of each indicator
Both indicators in positive territory produce blue bars
Both indicators in negative bias produce yellow bars
If signals are mixed (one up one down) bars become grey
Speed Selection
The Bjorgum speed selector optimizes the strategy based on the users desires or trading style at the touch of a button
Fast setting is better for swing trades - more timely signals, more whipsaw
Slow setting is better for longer holds or more volatile assets - slower signals, smooths out whipsaw
RSI Bar Color
RSI color changes bar color based on user defined RSI values
Buy/ sell signals are typically given on a cross of the 50 level
Speed selector (fast/Slow) automatically changes lengths between Bj RSI (5 period) and a standard RSI (14 period)
Additional capabilities can be mixed and matched from strategies in the "Strategy Override" section
Add-ons include:
Tilson - The moving average system from Bjorgum Reversal can be toggled to couple with another bar color strategy by clicking this button
PSAR - Parabolic Stop and Reverse indicator can help with trend direction, volatility, and stop losses
HEMA - The 3 moving average system from the HEMA strategy can be coupled with any of the other strategies by clicking "Show HEMA"
Bj Arrows - These arrows plot at the bar level to draw attention to when the BJ TSI is "curling" (See profile for Bjorgum TSI and download today)
-Optional "Plotbar Overlay" plots bars with Heikin-Ashi Inputs when toggled
-This allows for the benefits of price smoothing without sacrificing moving average and indicator performance as real close value is still used
-This can also help on short time frames and improve results with crypto! The user must "mute" the main series candles when in use to avoid candle overlap.
-Optional price line as muting main bars will disable the TradingView default price line. The horizontal plot will track the real closing price while in HA mode!
HULLTSIBOTDo you like TSI indicator?
Do you like HMA indicator?
The all new, HULLTSIBOT indicator!
About:
TSI indicator was on a space mission to mine other planets and then the crew stumbled upon a bunch of HMA indicator eggs. In the darkness of the slime room they found, There was a suddenly a bunch of failing and swearing and machinegun fire muzzle flashes, then all fell silent.
from the back shadow mist stepped forward a TSI indicator, but its eyes were bloodshot and it did not look the same...
The rescue ship found the TSI indicator motionless but still with a heartbeat....
a few days went past, the TSI indicator layed in the medic bay,
A medic noticed a bulge in the abdomen, that started to move!
The alien lifeform burst through the stomach of the TSI indicator and flew at the medic, covering the face and overpowering the new victim with ease...
Quickly it spread throughout the entire rescue ships crew, with many new alien lifeforms searching every corner for a new host.
The rescue ship flew on, able to land with autopilot as programmed for in emergencies, Thus the HULLTSIBOT was introduced to the humans world...
planet earth
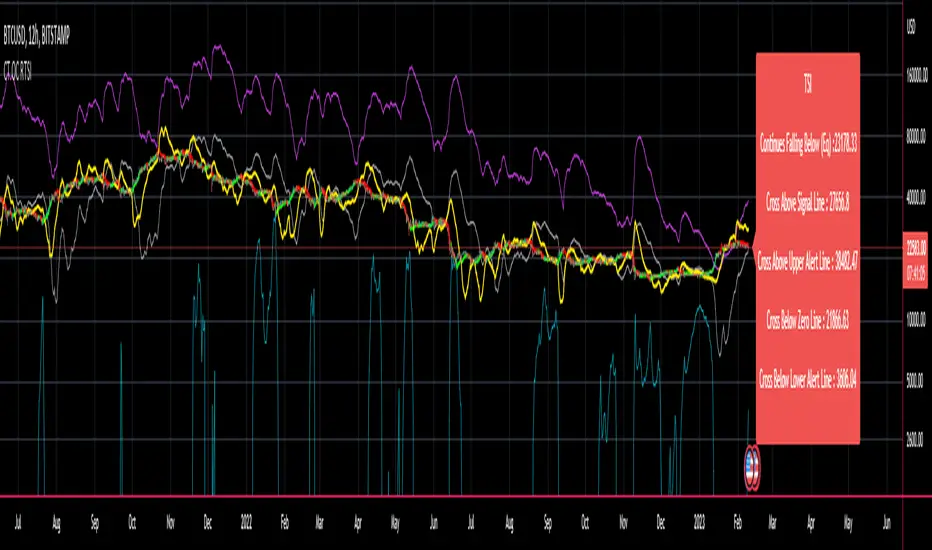
CT Reverse True Strength Indicator On ChartIntroducing the Caretakers “On Chart” Reverse True Strength Index.
According to Wikipedia….
“The True Strength Index (TSI) is a technical indicator used in the analysis of financial markets that attempts to show both trend direction and overbought/oversold conditions. It was first published William Blau in 1991.
The indicator uses moving averages of the underlying momentum of a financial instrument.
Momentum is considered a leading indicator of price movements, and a moving average characteristically lags behind price.
The TSI combines these characteristics to create an indication of price and direction more in sync with market turns than either momentum or moving average.”
The TSI has a normal range of values between +100 and -100.
Traditionally traders and analysts will consider:
Positives values above 25 to indicate an “overbought” condition
Negative values below -25 to indicate an “oversold” condition
I have reverse engineered the True Strength Index formula to derive 2 new functions.
1) The reverse TSI function is dual purpose which can be used to calculate….
The chart price at which the TSI will reach a particular TSI scale value.
The chart price at which the TSI will equal its previous value.
2) The reverse TSI signal cross function can be used to calculate the chart price at which the TSI will cross its signal line.
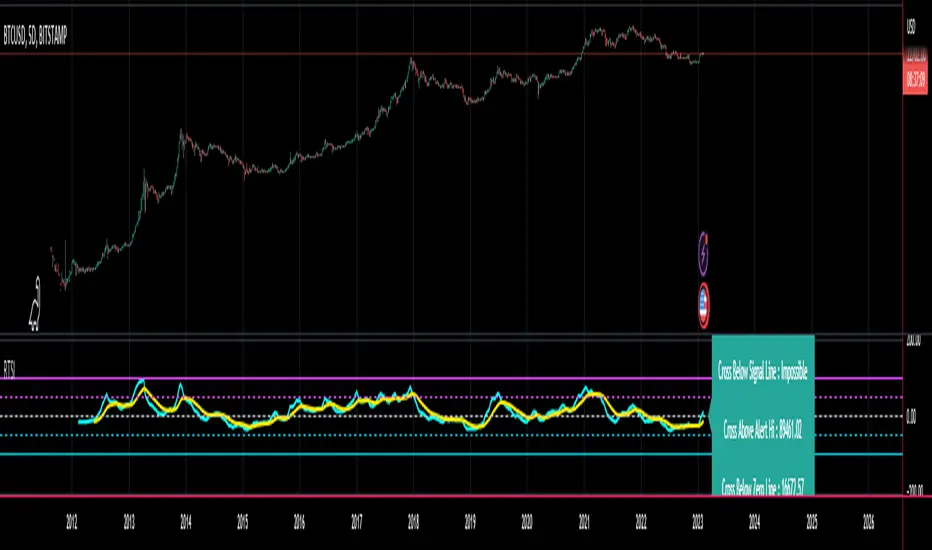
I have employed these functions here to return the price levels where the True Strength Index would equal :
Upper alert level ( default 25 )
Zero-Line
Lower alert level ( default -25 )
Previous TSI (eq) value
TSI signal line
In this “On Chart” version of the reverse True Strength Index the crossover levels are displayed both as lines on the chart and via an optional info-box with choice of user selected info.
Chart Line Colors
Upper alert level... ( Fuchsia )
Zero-Line............ ( White )
Lower alert level... ( Aqua )
TSI (eq)...............( TSI (eq) > close..Orange, TSI (eq) < close..Lime )
TSI signal line........( Signal Cross Line > Close..Aqua, Signal Cross Line < Close..Fuchsia )
How to interpret the displayed prices returned from the TSI scale zero line and upper and lower alert levels.
Closing exactly at the given price will cause the True Strength Index value to equal the scale value.
Closing above the given price will cause the True Strength Index to cross above the scale value.
Closing below the given price will cause the True Strength Index to cross below the scale value.
How to interpret the displayed price returned from the TSI (eq)
Closing exactly at the price will cause the True Strength Index value to equal the previous TSI value.
Closing above the price will cause the True Strength Index value to increase.
Closing below the price will cause the True Strength Index value to decrease.
How to interpret the displayed price returned from the TSI signal line crossover.
Closing exactly at the given price will cause the True Strength Index value to equal the signal line.
Closing above the given price will cause the True Strength Index to cross above the signal line.
Closing below the given price will cause the True Strength Index to cross below the signal line.
Common methods to derive signals from the TSI :
Zero-line crossovers
When the CMO crosses above the zero-line, a buy signal is generated.
When the CMO crosses below the zero-line, a sell signal is generated.
“Overbought” and “Oversold” crossovers
When the SMI crosses below -25 and then moves back above it, a buy signal is generated.
When the SMI crosses above +25 and then moves back below it, a sell signal is generated.
What Does the True Strength Index (TSI) Tell You?
The indicator is primarily used to identify overbought and oversold conditions in an asset's price, spot divergence, identify trend direction and changes via the zero-line, and highlight short-term price momentum with signal line crossovers.
Since the TSI is based on price movements, oversold and overbought levels will vary by the asset being traded. Some stocks may reach +30 and -30 before tending to see price reversals, while another stock may reverse near +20 and -20.
Mark extreme TSI levels, on the asset being traded, to see where overbought and oversold is. Being oversold doesn't necessarily mean it is time to buy, and when an asset is overbought it doesn't necessarily mean it is time to sell. Traders will typically watch for other signals to trigger a trade decision. For example, they may wait for the price or TSI to start dropping before selling in overbought territory. Alternatively, they may wait for a signal line crossover.
Signal Line Crossovers
The true strength index has a signal line, which is usually a seven- to 13-period EMA of the TSI line. A signal line crossover occurs when the TSI line crosses the signal line. When the TSI crosses above the signal line from below, that may warrant a long position. When the TSI crosses below the signal line from above, that may warrant selling or short selling.
Signal line crossovers occur frequently, so should be utilized only in conjunction with other signals from the TSI. For example, buy signals may be favoured when the TSI is above the zero-line. Or sell signals may be favoured when the TSI is in overbought territory.
Zero-line Crossovers
The zero-line crossover is another signal the TSI generates. Price momentum is positive when the indicator is above zero and negative when it is below zero. Some traders use the zero-line for a directional bias. For example, a trader may decide only to enter a long position if the indicator is above its zero-line. Conversely, the trader would be bearish and only consider short positions if the indicator's value is below zero.
Breakouts and Divergence
Traders can use support and resistance levels created by the true strength index to identify breakouts and price momentum shifts. For instance, if the indicator breaks below a trendline, the price may see continued selling.
Divergence is another tool the TSI provides. If the price of an asset is moving higher, while the TSI is dropping, that is called bearish divergence and could result in a downside price move. If the TSI is rising while the price is falling, that could signal higher prices to come. This is called bullish divergence.
Divergence is a poor timing signal, so it should only be used in conjunction with other signals generated by the TSI or other technical indicators.
The Difference Between the True Strength Index (TSI) and the Moving Average Convergence Divergence (MACD) Indicator.
The TSI is smoothing price changes to create a technical oscillator. The moving average convergence divergence (MACD) indicator is measuring the separation between two moving averages. Both indicators are used in similar ways for trading purposes, yet they are not calculated the same and will provide different signals at different times.
The Limitations of Using the True Strength Index (TSI)
Many of the signals provided by the TSI will be false signals. That means the price action will be different than expected following a trade signal. For example, during an uptrend, the TSI may cross below the zero-line several times, but then the price proceeds higher even though the TSI indicates momentum has shifted down.
Signal line crossovers also occur so frequently that they may not provide a lot of trading benefit. Such signals need to be heavily filtered based on other elements of the indicator or through other forms of analysis. The TSI will also sometimes change direction without price changing direction, resulting in trade signals that look good on the TSI but continue to lose money based on price.
Divergence also tends to unreliable on the indicator. Divergence can last so long that it provides little insight into when a reversal will actually occur. Also, divergence isn't always present when price reversals actually do occur.
The TSI should only be used in conjunction with other forms of analysis, such as price action analysis and other technical indicators.
This is not financial advice, use at your own risk.
CT Reverse True Strength IndicatorIntroducing the Caretakers Reverse True Strength Index.
According to Wikipedia….
“The True Strength Index (TSI) is a technical indicator used in the analysis of financial markets that attempts to show both trend direction and overbought/oversold conditions. It was first published William Blau in 1991.
The indicator uses moving averages of the underlying momentum of a financial instrument.
Momentum is considered a leading indicator of price movements, and a moving average characteristically lags behind price.
The TSI combines these characteristics to create an indication of price and direction more in sync with market turns than either momentum or moving average.”
The TSI has a normal range of values between +100 and -100.
Traditionally traders and analysts will consider:
Positives values above 25 to indicate an “overbought” condition
Negative values below -25 to indicate an “oversold” condition
I have reverse engineered the True Strength Index formula to derive 2 new functions.
The reverse TSI function is dual purpose which can be used to calculate….
The chart price at which the TSI will reach a particular TSI scale value.
The chart price at which the TSI will equal its previous value.
The reverse TSI signal cross function can be used to calculate the chart price at which the TSI will cross its signal line.
I have employed these functions here to return the price levels where the True Strength Index would equal :
Upper alert level ( default 25 )
Zero-Line
Lower alert level ( default -25 )
Previous TSI (eq) value.
TSI signal line
These crossover levels are displayed via an optional info-box with choice of user selected info.
How to interpret the displayed prices returned from the TSI scale zero line and upper and lower alert levels.
Closing exactly at the given price will cause the True Strength Index value to equal the scale value.
Closing above the given price will cause the True Strength Index to cross above the scale value.
Closing below the given price will cause the True Strength Index to cross below the scale value.
How to interpret the displayed price returned from the TSI (eq)
Closing exactly at the price will cause the True Strength Index value to equal the previous TSI value.
Closing above the price will cause the True Strength Index value to increase.
Closing below the price will cause the True Strength Index value to decrease.
How to interpret the displayed price returned from the TSI signal line crossover.
Closing exactly at the given price will cause the True Strength Index value to equal the signal line.
Closing above the given price will cause the True Strength Index to cross above the signal line.
Closing below the given price will cause the True Strength Index to cross below the signal line.
Common methods to derive signals from the TSI :
Zero-line crossovers
When the CMO crosses above the zero-line, a buy signal is generated.
When the CMO crosses below the zero-line, a sell signal is generated.
“Overbought” and “Oversold” crossover
When the SMI crosses below -25 and then moves back above it, a buy signal is generated.
When the SMI crosses above +25 and then moves back below it, a sell signal is generated.
What Does the True Strength Index (TSI) Tell You?
The indicator is primarily used to identify overbought and oversold conditions in an asset's price, spot divergence, identify trend direction and changes via the zero-line, and highlight short-term price momentum with signal line crossovers.
Since the TSI is based on price movements, oversold and overbought levels will vary by the asset being traded. Some stocks may reach +30 and -30 before tending to see price reversals, while another stock may reverse near +20 and -20.
Mark extreme TSI levels, on the asset being traded, to see where overbought and oversold is. Being oversold doesn't necessarily mean it is time to buy, and when an asset is overbought it doesn't necessarily mean it is time to sell. Traders will typically watch for other signals to trigger a trade decision. For example, they may wait for the price or TSI to start dropping before selling in overbought territory. Alternatively, they may wait for a signal line crossover.
Signal Line Crossovers
The true strength index has a signal line, which is usually a seven- to 13-period EMA of the TSI line. A signal line crossover occurs when the TSI line crosses the signal line. When the TSI crosses above the signal line from below, that may warrant a long position. When the TSI crosses below the signal line from above, that may warrant selling or short selling.
Signal line crossovers occur frequently, so should be utilized only in conjunction with other signals from the TSI. For example, buy signals may be favoured when the TSI is above the zero-line. Or sell signals may be favoured when the TSI is in overbought territory.
Zero-line Crossovers
The zero-line crossover is another signal the TSI generates. Price momentum is positive when the indicator is above zero and negative when it is below zero. Some traders use the zero-line for a directional bias. For example, a trader may decide only to enter a long position if the indicator is above its zero-line. Conversely, the trader would be bearish and only consider short positions if the indicator's value is below zero.
Breakouts and Divergence
Traders can use support and resistance levels created by the true strength index to identify breakouts and price momentum shifts. For instance, if the indicator breaks below a trendline, the price may see continued selling.
Divergence is another tool the TSI provides. If the price of an asset is moving higher, while the TSI is dropping, that is called bearish divergence and could result in a downside price move. If the TSI is rising while the price is falling, that could signal higher prices to come. This is called bullish divergence.
Divergence is a poor timing signal, so it should only be used in conjunction with other signals generated by the TSI or other technical indicators.
The Difference Between the True Strength Index (TSI) and the Moving Average Convergence Divergence (MACD) Indicator.
The TSI is smoothing price changes to create a technical oscillator. The moving average convergence divergence (MACD) indicator is measuring the separation between two moving averages. Both indicators are used in similar ways for trading purposes, yet they are not calculated the same and will provide different signals at different times.
The Limitations of Using the True Strength Index (TSI)
Many of the signals provided by the TSI will be false signals. That means the price action will be different than expected following a trade signal. For example, during an uptrend, the TSI may cross below the zero-line several times, but then the price proceeds higher even though the TSI indicates momentum has shifted down.
Signal line crossovers also occur so frequently that they may not provide a lot of trading benefit. Such signals need to be heavily filtered based on other elements of the indicator or through other forms of analysis. The TSI will also sometimes change direction without price changing direction, resulting in trade signals that look good on the TSI but continue to lose money based on price.
Divergence also tends to unreliable on the indicator. Divergence can last so long that it provides little insight into when a reversal will actually occur. Also, divergence isn't always present when price reversals actually do occur.
The TSI should only be used in conjunction with other forms of analysis, such as price action analysis and other technical indicators.
This is not financial advice, use at your own risk.