Donchian Trend RibbonHello Traders,
I think you all know Donchian Channels. so I am not going to write about it.
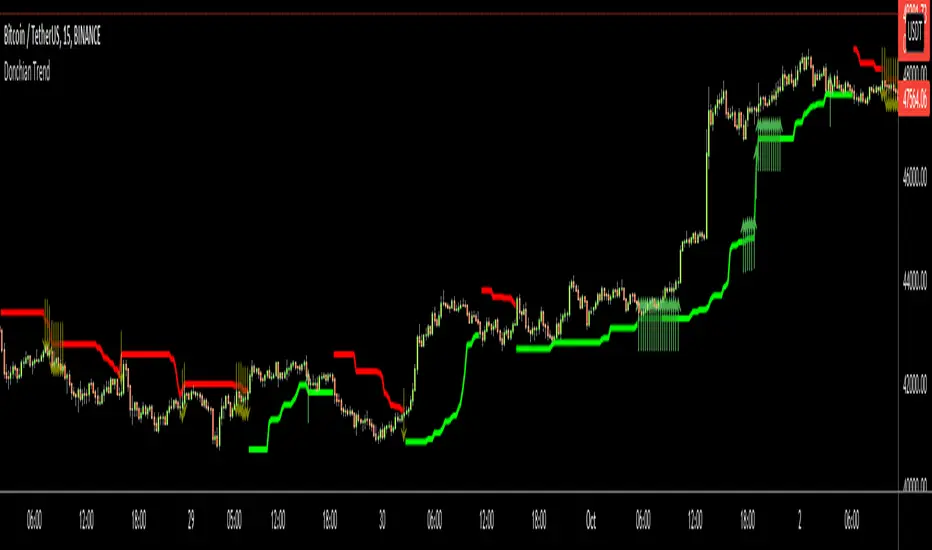
With this indicator I tried to create Donchian Trend Ribbon by using Donchian Channels.
How it works ?
- it calculates main trend direction by using the length that is user-defined. so you can change it as you wish
- then it calculates trend direction for each 9 lower lengths. if you set the length = 20 then the lengths are 19, 18,...11
- and it checks if the trend directions that came from lower lengths is same or not with main trend direction.
- it changes the trend color of the ribbon.
-
Warning: Entry points may also represents trend reversal. So you should use stoploss line if you decide to take buy/sell positions.
P.S. I didn't backtest it, it's non-repainting, it should be used educational purposes only.
Published by user request. You may want to see following one:
Enjoy!
Trendreversal

Donchian TrendHello All,
I think all of you knows Donchian Channels . so I am not going to write about it.
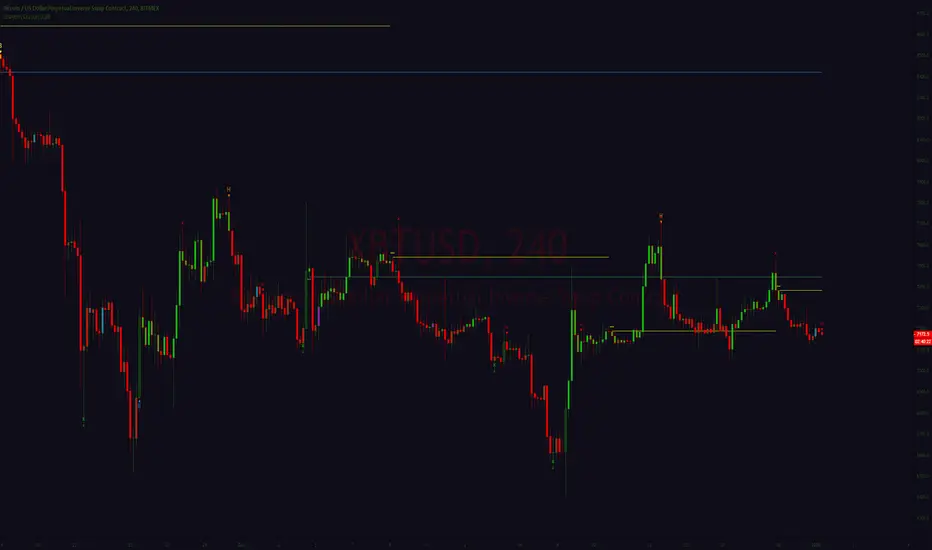
With this indicator I tried to create Trend Lines by using Donchian Channel upper/lower bands. I tried add possible entry levels as well.
How it works ?
- it calculates main trend direction by using the length that is user-defined. so you can change it as you wish
- then it calculates trend direction for 9 lower lengths. if you set the length = 20 then the lengths are 19, 18,...11
- and it checks if the trend directions that came from lower lengths is same or not with main trend direction.
- it changes the trendline color. lighter trend line means stonger trend, darker trend lines means entry points or possible trend reversal.
- it puts entry points by using trend directions that were created by using lower lengths. it gets entry points if high/low touches main trend line as well.
Warning: Arrows are entry points but it may also represents trend reversal. So you should use stoploss line if you decide to take buy/sell positions.
P.S. I didn't backtest it, it's non-repainting, it should be used educational purposes only . I believe it can be improved, so I am open for new ideas to improve it ;)
Enjoy!
Trend Exhaustion IndicatorThe Trend Exhaustion Indicator is a custom indicator of mine that is loosely based on the Trend Exhaustion Index created by Clifford L. Creel Ph.D. (Stocks & Commodities V. 9:1 (9-11))
This indicator will let you know the trend reversal points and when it falls below the signal line then the trend is ending vice versa. Buy when the indicator crosses above the signal line and sell when it falls below the signal line.
Let me know if you would like to see me write any other scripts!

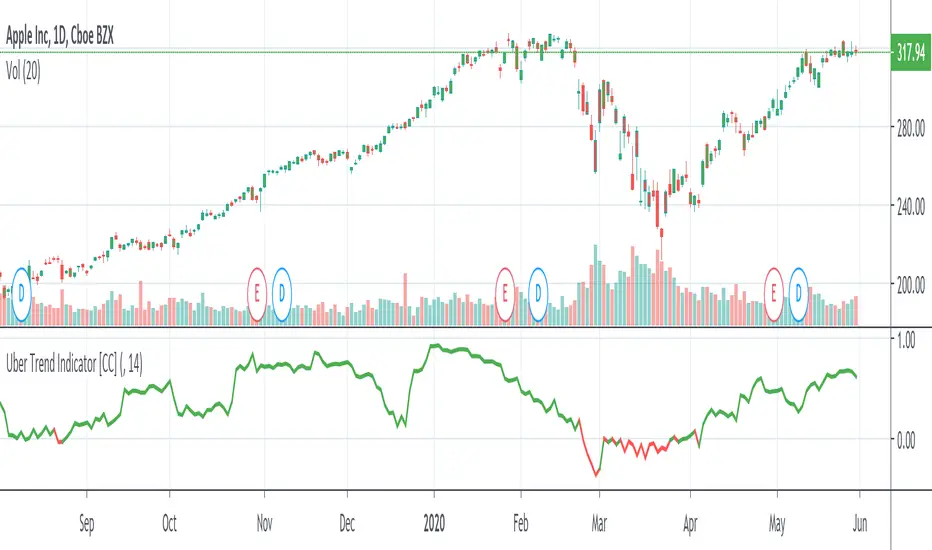
Uber Trend IndicatorThis is my first custom indicator that I created as a medium to long term trend indicator. Buy if it is above 0 and sell if it is below 0.
Since this is my first unique indicator, I would love to hear your feedback! Please let me know if you would like to see any other scripts!
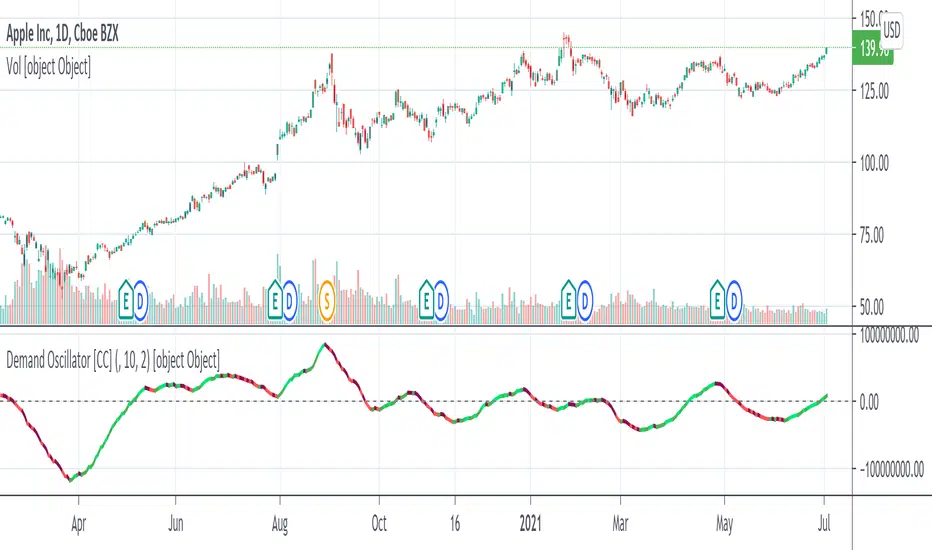
Demand OscillatorThe Demand Oscillator was created by James Sibbet (Stocks & Commodities June, 1986) and I changed his formula quite a bit to what you see on here. If it rises above the signal then buy or if not then sell. This is my custom version of his formula so let me know what you think.
Let me know if you would like to see me write any other scripts!
Pivot Point SupertrendHello All,
There are many types of SuperTrend around. Recently I thought about a Supertrend based on Pivot Points then I wrote "Pivot Point SuperTrend" script. It looks it has better performance on keeping you in the trend more.
The idea is behind this script is finding pivot point, calculating average of them and like in supertrend creating higher/lower bands by ATR. As you can see in the algorithm the script gives weigth to past pivot points, this is done for smoothing it a bit.
As I wrote above it may keep you in the trend more, lets see an example:
As an option the script can show main center line and I realized that when you are in a position, this line can be used as early exit points. (maybe half of the position size)
While using Pivot Points, I added support resistance lines by using Pivot Point, as an option the script can show S/R lines:
And also it can show Pivot Points:
When you changed Pivot Point Period you can see its reaction, in following example PP period is 4 (default value is 2). Smaller PP periods more sensitive trendlines.
Alerts added for Buy/Sell entries and Trend Reversals. (when you set alerts use the option " Once Per Bar Close ")
ENJOY!

Trend Following MAs 3DHello All,
This is Moving Averages Trend Following 3D indicator. The idea is based on direction of MAs and relation between 20 moving averages (5 to 100 period).
Option to show different type of MAs: EMA, SMA, RMA, WMA, VWMA.
As I haved tested it looks succesful at calculating trend direction and trend strength.
For a better look I tried to make it 3D, it looks good I think, waiting comments ;)
Some screenshots:
By using RMA type:
When it gets tiny it means there is no trend:
An example for down trend:
ENJOY!

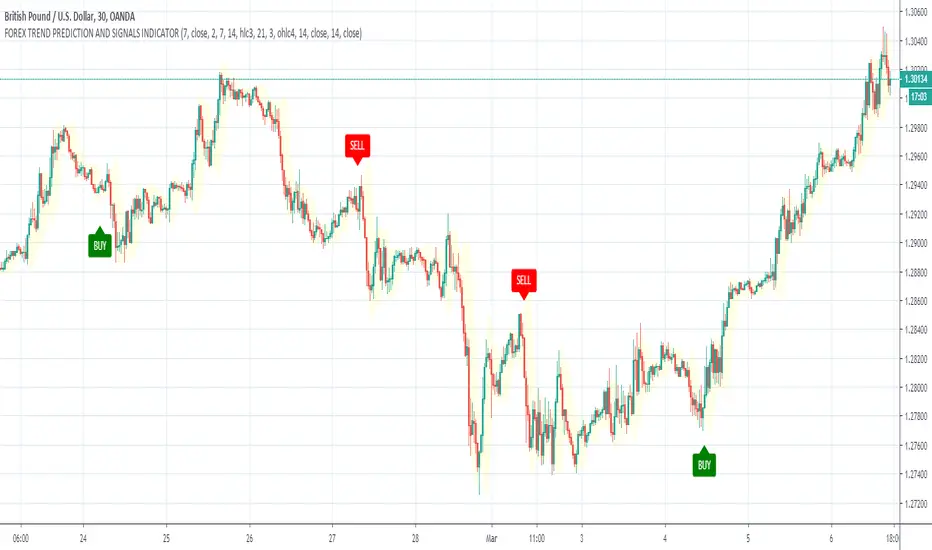
GBPUSD TREND DETECTION AND BUY/SELL ARROW SIGNALS INDICATORGBPUSD TREND DETECTION AND BUY/SELL ARROW SIGNALS INDICATOR
This script developed for active forex traders and based on Trend Analysis Indicators.
It used combination of Moving Averages, Volatility Indicator and Fractals and try to
detect reversal points of trends and generates buy/sell signals.
Works for all Forex currency pairs and time frames: 15MIN, 1H, 1DAY.
Can be used for swing trading and trend trading.
Advantage of this script indicator that all noise is filtered and signals detects long trends.
This make it useful as stand-alone trading strategy indicator or in combination with other indicators,
It is useful for day and intraday forex traders.
Main features of this indicator are:
✅ Forex Trend Reverse Points
✅ Forex breakout indicator
✅ Forex trend Signals
Haos Visual DivergencesThe Haos Visual is a trend indicator consisting of two WIlliams % indicators.
I have added divergences to spot trend reversals within assets, divergences have no repaint and require single candle confirmation.
www.prorealcode.com

Gann Trend OscillatorDeveloped by Robert Krausz, the Gann Trend Oscillator is a trend-following indicator used to determine the financial instruments long-term price direction.

Divergence for many indicator v3Hello Everyone. Almost one year later, with Pine version 4, I developed new version of the Divergence for many Indicator.
It analyses divergences for 10 predefined indicators and then draws line on the graph. Red for negatif divergence (means prices may go down or trend reversal), Lime for positive divergences (means prices may go up or trend reversal)
Divergences version 2 has latency because it waits higher time frame completion. in this new version the script uses Pivot Points and on every bar it checks divergence between last Pivot point and current bar and if it finds any then immediately draws line and removes old one. so there is no latency with this version.
There are predefined 10 indicators in the script, you have option to choose which indicators the script would analyse for divergence. (RSI , MACD , MACD Histogram, Stochastic , CCI , Momentum, OBV, Diosc, VWMACD and CMF)
In replay mode you can see how the script puts new divergence line and removes old one. you better see it for yourself by using replay mode.
Hope you Enjoy!

Trend Following or Mean RevertingThe strategy checks nature of the instruments. It Buys if the close is greater than yesterday's high, reverse the position if the close is lower than yesterday's low and repeat the process.
1. If it is trend following then the equity curve will be in uptrend
2. If it is mean reverting then the equity curve will be downtrend
Thanks to Rayner Teo.

NCTA Trend BiasTrend Bias
The NCTA Trend Bias indicator is designed to show traders the overall directional bias of the market. It is excellent in short 1, 3, and 5 minute timeframes for futures traders and short term options traders. Longer timeframes such as the 5, 10, and 30 minute timeframes work well for options traders.
This indicator is used by displaying it twice on the chart. For 1, 3, and 5 minute charts, one of the Trend Bias indicators is set at Fast and the other is set at Medium.
For 30 min or higher charts, one Trend Bias Indicator is set at Medium and the other one is set at Slow.
The indicator consists of three trend lines; a fast signal, a medium signal, and a slow signal. There is a possible trade entry when the fast signal crosses either the medium and/or slow signals.
HOW TO USE: The most effective way to use this indicator is to have it displayed twice, using the settings described above for the relevant chart timeframe.
When both indicators show the fast line (blue line) crossing above the medium (red) or the slow (green) line, it implies an opportunity to go long or buy a call. When both indicators show the fast line crossing below the medium and/or slow line, it implies an opportunity to go short or buy a put.
The Trend Bias Indicator also provides a powerful directional bias entry when used in alignment with the Awesome Oscillator. Green AO aligned with a long Trend Bias entry or red AO aligned with a short Trend Bias entry.
For information on gaining access to this indicator, please see the link below in our signature field.
RTYZ2019
NASDAQ:AMZN

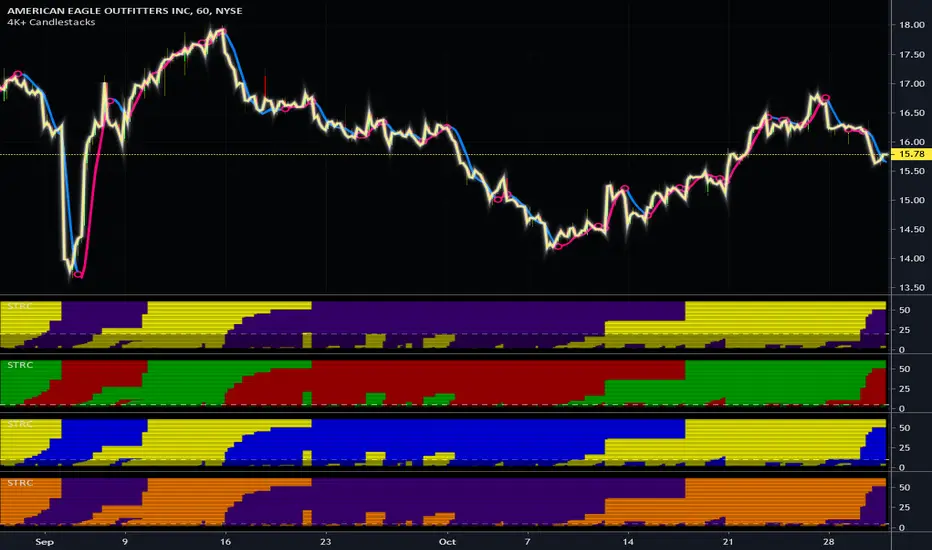
Simply Trendy RasterChartThis is my "Simply Trendy RasterChart" using PSv4.0 freely available to ALL! Simply Trendy, shown with the multiple color schemes on the bottom portion of the chart, is an indicator that differentiates with color between trending moments up and down, but is also effective at identifying trend reversals clearly. The bottom of the indicator is most reactive and indicates reversals, while the upper portion of the indicator commonly shows enduring trends. I included a horizontal rule to approximately gauge at what level you may wish to have before entering/exiting a trade upon identifying a trend change. This gizmo functions on all assets on time frames ranging from one second bars up to the "All" chart having monthly bars. Possible uses are quickly identifying assets that are not only opportunistic towards buying, but also selling/shorting when that time arrives later.
I decided to release this freely so members can become familiar with how my RasterCharts function. However, it may serve as another tool in the trend analysis tool belt you may want to have. It's the most basic of RasterCharts that I may have, and it gives the user an opportunity to witness/grasp RasterChart fundamental theory and operation in real time. Underneath the hood, the code is truly VERY SIMPLE also, hence the entitled name given. This was originally an experiment that turned out to be impressive, exceeding my expectations of attempting it. It's behavior is similarly close to my "TrendSetter RasterChart" and may serve as a trainer before acquiring that, any other RasterCharts I have currently, or shall create in the future. With that said, I hope you find this "simply" handy , and I'm also wishful for it to potentially garner a "trendy" reputation among the many members who may discover it.
I provided multiple color schemes for those of you who may have color blindness vision impairments. You may contact me in private if these color schemes are not suitable for your diagnosed visual impairment, and you would wish to contribute to seeing the color schemes improved along with other future indicators I shall release.
Features List Includes:
"Color Scheme" selection (all displayed above)
"RasterChart Transparency" control
"Source" selection
"Horizontal Rule" adjustment
The comments section below is solely just for commenting and other remarks, ideas, compliments, etc... regarding only this indicator, not others. When available time provides itself, I will consider your inquiries, thoughts, and concepts presented below in the comments section if you do have any questions or comments regarding this indicator. When my indicators achieve more prevalent use by TV members, I may implement more ideas when they present themselves as worthy additions. As always, "Like" it if you simply just like it with a proper thumbs up, and also return to my scripts list occasionally for additional postings. Have a profitable future everyone!
Pivot Reversal Strategy - FIGS & DATES 2.0Simple Pivot Reversal Strategy with some adding settings.
Date Range: To test over specific market conditions.
Initial Capitol: $10K - This is a more realistic representation of funds used this strategy (for me anyway). The default of $100K can give different results (usually better) than when using a smaller balance.
Order Size: 100% Equity - These trend following strategies typically used this way, going all in each direction.
Commission: .075% - It's always disheartening to think you've found a ridiculously good setting, and then realize you forgot to add the commission.
All of these settings can be changed, but it's easier for me (and more fool proof) to have them set as default.

NCTA Cycle FinderCycle Finder
The NCTA Cycle Finder is one of three technical indicators that are part of the Profit Flow Analytics.
New Cycle Trading and Analytics is a group of traders creating market analytics for traders. The objective is to take complex combinations of multiple technical pattern indicators and present to the trader a simple, single entry signal.
The NCTA Cycle Finder is designed to identify the beginning of new, trending cycles. It is excellent in short 1, 3, and 5 minute timeframes for futures traders and short term options traders. Longer timeframes such as the 5, 10, and 30 minute timeframes work well for options traders.
This indicator consists of a simple, single entry indicator designed to provide an entry very close to the shift on the intra-day cycle. It provides a warning that a cycle shift may be coming by printing a grey bar. Bars above the zero line imply a possible new long cycle developing. Grey bars below the zero line imply a possible new short cycle is developing.
Once the indicator has confirmed a new cycle is developing, a dark blue or red bar will print. Dark blue above the zero line is the trader’s signal to go long. A dark red signal below the zero line is the traders signal to go short. The indicator is designed to filter out false signals and provide the trader with an optimum timing of capturing an entry/exit very close to the beginning / ending of a cycle.
Using the NCTA Cycle Finder, the Profit Flow Oscillator, and Trend Consensus indicators together, offers traders an opportunity to lock in profits and enter the same trending cycle more than one time. This is an excellent opportunity to open trend continuation trades. The NCTA Cycle Finder is excellent when used across more than one timeframe to confirm alignment. For example, monitoring the 5 minute signals and confirming alignment with the 1 minute chart improves the probability of entering a profitable trade.
HOW TO USE: Use the grey bar prints to be ready for a signal and the possible direction. Go long when a blue bar appears and go short when a red bar appears. The print of these signals very closely identify the beginning of a new cycle
The NCTA Cycle Finder, which is part of the Profit Flow Analytics set of indicators, is traded in a live trading room every market day, hosted by our friends at Options Money Maker.
To learn more about the NCTA Cycle Finder and the other two indicators, which are part of Profit Flow Analytics, use the following link:
www.newcycletrading.com
NQZ2019
SP:SPX

Multi-Pair Trend Reversal WidgetThis is a multi-currency-pair trend reversal widget, which picks currency pairs by overbought/oversold level and can be used in pair trading strategy. It shows tradable currency pairs as well as anticipates corresponding trend direction. Currency pairs (CPs) are ordered by importance. The first 5 CPs are highlighted (with blue bars) as majors. The additional 5 CPs are minors (in gray bars) and may be omitted. Orange star indicates crossover of the middle line, the mean, with red and green stars being early warning signals of a forthcoming uptrend and downtrend, correspondingly.
Mind that this widget is computationally intensive, having to calculate 10 assets. Nonetheless, please look at it as my proposal for future developments of Pinescript, i.e. embedding widgets in the chart. ;)

Trading Range ExpansionThis script is trading for the false breakout of the trading range. Once the price makes a break out and get rejected back into the range. The signal triggered for the opposite direction.

BOSS EMA Trend Meter PRO With Alerts BOSS PRO TRADING SYSTEM INDICATORS
Bullish Uptrend
To determine bullish uptrend there must beat least 2 green squares on all three trend meters. This is a great predictor that a uptrend is imminent. You can set alerts for top two meters being green as well as all 3 meters being green
Bearish Downtrend
To determine bearish downtrend there must beat least 2 red squares on all three trend meters. This is a great predictor that a downtrend is imminent. You can set alerts for top two meters being red as well as all 3 meters being red.
Purchase Here: bosscripts.com

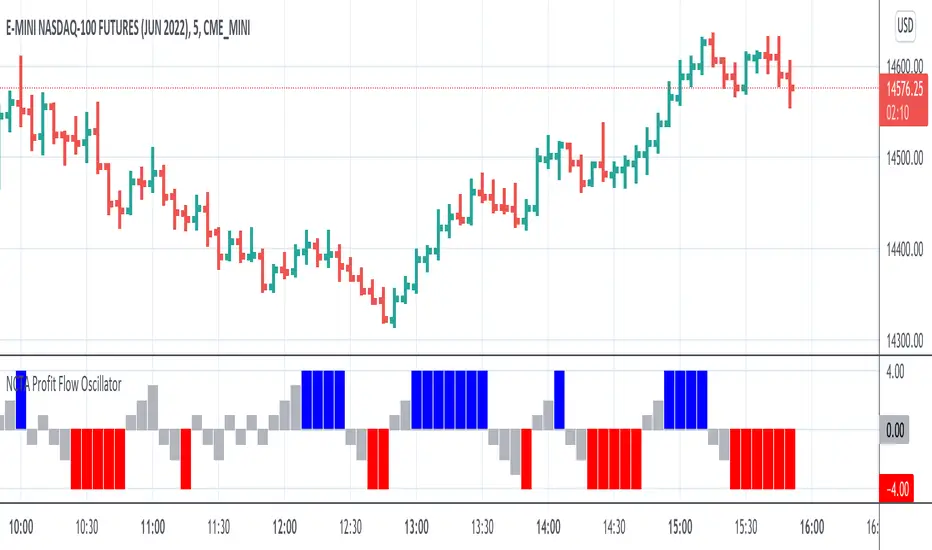
NCTA Profit Flow OscillatorProfit Flow Oscillator
The Profit Flow Oscillator is one of two technical pattern indicators that are part of the Profit Flow Analytics.
New Cycle Trading and Analytics is a group of traders creating market analytics for traders. The objective is to take complex combinations of multiple technical pattern indicators and present to the trader a simple, single signal entry.
The Profit Flow Oscillator is excellent in short 1, 3, and 5 minute timeframes for futures traders and short term options traders. Longer timeframes such as the 5, 10, and 30 minute timeframes work well for options traders.
The Profit Flow Oscillator consists of a simple, single entry indicator designed to provide an entry very close to the shift on the intra-day cycle. It is designed to filter out false signals and provide the trader with an optimum timing of an entry.
HOW TO USE: Go long when a blue bar appears and go short when a red bar appears. These prints very closely identify the beginning of a new cycle
The Profit Flow Oscillator, which is part of the Profit Flow Analytics set of indicators, is traded in a live trading room every market day, hosted by our friends at Options Money Maker.
To learn more and to get a free trial of the Profit Flow Oscillator, use the following link:
www.newcycletrading.com
NQU2019
SP:SPX
NCTA Trend ConsensusTrend Consensus Indicator
The Trend Consensus Indicator is one of two technical pattern indicators that are part of the Profit Flow Analytics.
New Cycle Trading and Analytics is a group of traders creating market analytics for traders. The objective is to take complex combinations of multiple technical pattern indicators and present to the trader a simple, single signal entry.
The Trend Consensus Indicator is excellent in short 1, 3, and 5 minute timeframes for futures traders and short term options traders. Longer timeframes such as the 5, 10, and 30 minute timeframes work well for options traders.
The Trend Consensus Indicator consists of a simple, single entry indicator designed to provide an entry very close to the shift on the intra-day cycle. It is designed to filter out false signals and provide the trader with an optimum timing of an entry. The signal consists of an early indication of a possible entry followed by a confirming/entry signal. It is very simple to monitor and recognize the entry.
HOW TO USE: Go long when a dark blue bar appears as long as there is at least one light or dark blue bar immediately preceding it. Go short when a dark red bar appears as long as there is at least one light or dark red bar immediately preceding it.
The Trend Consensus Indicator, which is part of the Profit Flow Analytics set of indicators, is traded in a live trading room every market day, hosted by our friends at Options Money Maker.
To learn more and to get a free trial of the Trend Consensus Indicator, as part of the Profit Flow Analytics use the following link:
www.newcycletrading.com
NQU2019
SP:SPX

VWMA Trend FilterHere's a simple tool for determining long term trend direction using two Volume Weighted Moving Averages (VWMA). The VWMA's emphasis on volume often makes it a better measurement for trend direction than the more popular Exponential Moving Average (EMA).
Trend direction is determined by comparing a fast and slow VWMA. The default length for the fast VWMA is 50 periods, while the slow uses a default length of 200. Both of these lengths can be modified in the input options menu. The default source for the VWMA's is HLC3((high + low + close) / 3).
If the fast VWMA is greater than the slow VWMA, then the trend is bullish and the background color is green. If the fast VWMA is less than the slow VWMA, then it is bearish and the background color is red.
We included an option to change the candle color based on whether the VWMA's indicate a bullish or bearish trend as well.
Overall, this is one of those utility tools that we like to use as an overlay over the main price chart and in conjunction with other signal generating indicators. Its purpose isn't to generate buy and sell signals, but it works well as a visual confirmation tool to help traders gauge trend direction.

Crayons GrayonsUpdate for
Crayons 0.2
Crayons is early onset hyper customizable trend reversal trading suite
There is some big changes for Signal and Pivot generation and its set as Default mode so in case of nostalgia for white noise there is an option to "rollback" placed at the top of input menu
As always- hyper customizable
Every singal core crayon signal group will be turned on by default so open input menu for personalizing signals to charts and personal character
Crayons 0.2-
Greatly improved Signal quality
Improved Pivot detection logic
Two Set's of Pivots "Cleaned" and "Vanilla"
Optional Polichrome candle painter mode to provide additional information on demand
Optional Labels for signals and pivots
Secondary risk filter filtering "riskier" signal sequences (Experimental)
Second MA is changed by ATR modified to work as trailing S/R (Source is ohlc4 for whip protection model is experimental ,filters used is not suitable for micro tf so atr calls for higher periods, its experimental and will be fixed or removed with later updates, added for testing purposes)