Faytterro Market Structerethis indicator creates the market structure with a little delay but perfectly. each zigzag is always drawn from highest to lowest. It also signals when the market structure is broken. signals fade over time.
The table above shows the percentage distance of the price from the last high and the last low.
zigzags are painted green when making higher peaks, while lower peaks are considered downtrends and are painted red. In fact, the indicator is quite simple to understand and use.
"length" is used to change the frequency of the signal.
"go to past" is used to see historical data.
Please review the examples:
Linhas de Tendência

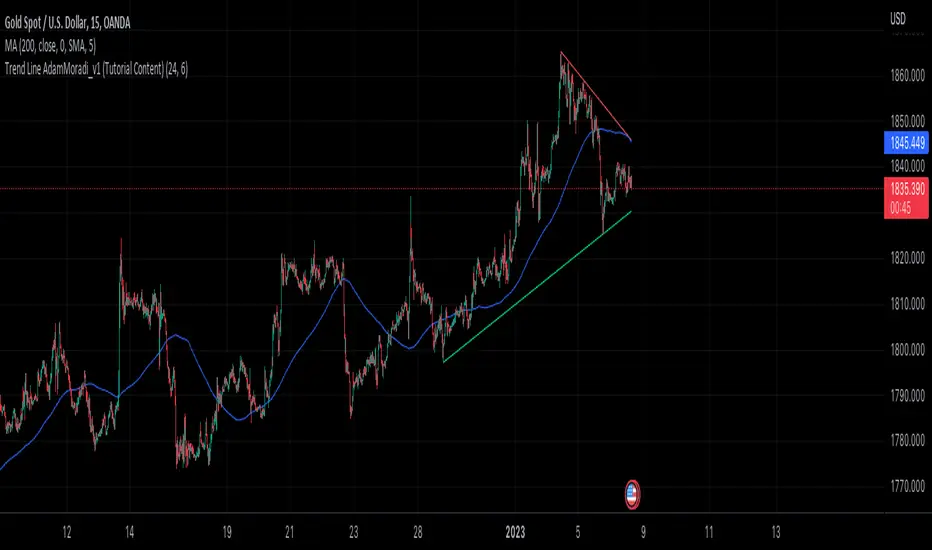
Trend Line Adam Moradi v1 (Tutorial Content)
The Pine Script strategy that plots pivot points and trend lines on a chart. The strategy allows the user to specify the period for calculating pivot points and the number of pivot points to be used for generating trend lines. The user can also specify different colors for the up and down trend lines.
The script starts by defining the input parameters for the strategy and then calculates the pivot high and pivot low values using the pivothigh() and pivotlow() functions. It then stores the pivot points in two arrays called trend_top_values and trend_bottom_values. The script also has two arrays called trend_top_position and trend_bottom_position which store the positions of the pivot points.
The script then defines a function called add_to_array() which takes in three arguments: apointer1, apointer2, and val. This function adds val to the beginning of the array pointed to by apointer1, and adds bar_index to the beginning of the array pointed to by apointer2. It then removes the last element from both arrays.
The script then checks if a pivot high or pivot low value has been calculated, and if so, it adds the value and its position to the appropriate arrays using the add_to_array() function.
Next, the script defines two arrays called bottom_lines and top_lines which will be used to store trend lines. It also defines a variable called starttime which is set to the current time.
The script then enters a loop to calculate and plot the trend lines. It first deletes any existing trend lines from the chart. It then enters two nested loops which iterate over the pivot points stored in the trend_bottom_values and trend_top_values arrays. For each pair of pivot points, the script calculates the slope of the line connecting them and checks if the line is a valid trend line by iterating over the price bars between the two pivot points and checking if the line is above or below the close price of each bar. If the line is found to be a valid trend line, it is plotted on the chart using the line.new() function.
Finally, the script colors the trend lines using the colors specified by the user.
Tutorial Content
'PivotPointNumber' is an input parameter for the script that specifies the number of pivot points to consider when calculating the trend lines. The value of 'PivotPointNumber' is set by the user when they configure the script. It is used to determine the size of the arrays that store the values and positions of the pivot points, as well as the number of pivot points to loop through when calculating the trend lines.
'up_trend_color' is an input parameter for the script that specifies the color to use for drawing the trend lines that are determined to be upward trends. The value of 'up_trend_color' is set by the user when they configure the script and is passed to the color parameter of the line.new() function when drawing the upward trend lines. It determines the visual appearance of the upward trend lines on the chart.
'down_trend_color' is an input parameter for the script that specifies the color to use for drawing the trend lines that are determined to be downward trends. The value of 'down_trend_color' is set by the user when they configure the script and is passed to the color parameter of the line.new() function when drawing the downward trend lines. It determines the visual appearance of the downward trend lines on the chart.
'pivothigh' is a variable in the script that stores the value of the pivot high point. It is calculated using the pivothigh() function, which returns the highest high over a specified number of bars. The value of 'pivothigh' is used in the calculation of the trend lines.
'pivotlow' is a variable in the script that stores the value of the pivot low point. It is calculated using the pivotlow() function, which returns the lowest low over a specified number of bars. The value of 'pivotlow' is used in the calculation of the trend lines.
'trend_top_values' is an array in the script that stores the values of the pivot points that are determined to be at the top of the trend. These are the pivot points that are used to calculate the upward trend lines.
'trend_top_position' is an array in the script that stores the positions (i.e., bar indices) of the pivot points that are stored in the 'trend_top_values' array. These positions correspond to the locations of the pivot points on the chart.
'trend_bottom_values' is an array in the script that stores the values of the pivot points that are determined to be at the bottom of the trend. These are the pivot points that are used to calculate the downward trend lines.
'trend_bottom_position' is an array in the script that stores the positions (i.e., bar indices) of the pivot points that are stored in the 'trend_bottom_values' array. These positions correspond to the locations of the pivot points on the chart.
apointer1 and apointer2 are variables used in the add_to_array() function, which is defined in the script. They are both pointers to arrays, meaning that they hold the memory addresses of the arrays rather than the arrays themselves. They are used to manipulate the arrays by adding new elements to the beginning of the arrays and removing elements from the end of the arrays.
apointer1 is a pointer to an array of floating-point values, while apointer2 is a pointer to an array of integers. The specific arrays that they point to depend on the arguments passed to the add_to_array() function when it is called. For example, if add_to_array(trend_top_values, trend_top_posisiton, pivothigh) is called, then apointer1 would point to the tval array and apointer2 would point to the tpos array.
'bottom_lines' (short for "Bottom Lines") is an array in the script that stores the line objects for the downward trend lines that are drawn on the chart. Each element of the array corresponds to a different trend line.
'top_lines' (short for "Top Lines") is an array in the script that stores the line objects for the upward trend lines that are drawn on the chart. Each element of the array corresponds to a different trend line.
Both 'bottom_lines' and 'top_lines' are arrays of type "line", which is a data type in PineScript that represents a line drawn on a chart. The line objects are created using the line.new() function and are used to draw the trend lines on the chart. The variables are used to store the line objects so that they can be manipulated and deleted later in the script.
Loops
maxline is a variable in the script that specifies the maximum number of trend lines that can be drawn on the chart. It is used to determine the size of the bottom_lines and top_lines arrays, which store the line objects for the trend lines.
The value of maxline is set to 3 at the beginning of the script, meaning that at most 3 trend lines can be drawn on the chart at a time. This value can be changed by the user if desired by modifying the assignment statement "maxline = 3".
'count_line_low' (short for "Count Line Low") is a variable in the script that keeps track of the number of downward trend lines that have been drawn on the chart. It is used to ensure that the maximum number of trend lines (as specified by the maxline variable) is not exceeded.
'count_line_high' (short for "Count Line High") is a variable in the script that keeps track of the number of upward trend lines that have been drawn on the chart. It is used to ensure that the maximum number of trend lines (as specified by the maxline variable) is not exceeded.
Both 'count_line_low' and 'count_line_high' are initialized to 0 at the beginning of the script and are incremented each time a new trend line is drawn. If either variable exceeds the value of maxline, then no more trend lines are drawn.
'pivot1', 'up_val1', 'up_val2', up1, and up2 are variables used in the loop that calculates the downward trend lines in the script. They are used to store intermediate values during the calculation process.
'pivot1' is a loop variable that is used to iterate through the pivot points (stored in the trend_bottom_values and trend_bottom_position arrays) that are being considered for use in the trend line calculation.
'up_val1' and 'up_val2' are variables that store the values of the pivot points that are used to calculate the downward trend line.
up1 and up2 are variables that store the positions (i.e., bar indices) of the pivot points that are stored in 'up_val1' and 'up_val2', respectively. These positions correspond to the locations of the pivot points on the chart.
'value1' and 'value2' are variables that are used to store the values of the pivot points that are being compared in the loop that calculates the trend lines in the script. They are used to determine whether a trend line can be drawn between the two pivot points.
For example, if 'value1' is the value of a pivot point at the top of the trend and 'value2' is the value of a pivot point at the bottom of the trend, then a trend line can be drawn between the two points if 'value1' is greater than 'value2'. The values of 'value1' and 'value2' are used in the calculation of the slope and intercept of the trend line.
'position1' and 'position2' are variables that are used to store the positions (i.e., bar indices) of the pivot points that are being compared in the loop that calculates the trend lines in the script. They are used to determine the distance between the pivot points, which is necessary for calculating the slope of the trend line.
For example, if 'position1' is the position of a pivot point at the top of the trend and 'position2' is the position of a pivot point at the bottom of the trend, then the distance between the two points is given by 'position1' - 'position2'. This distance is used in the calculation of the slope of the trend line.
'different', 'high_line', 'low_location', 'low_value', and 'valid' are variables that are used in the loop that calculates the downward trend lines in the script. They are used to store intermediate values during the calculation process.
'different' is a variable that stores the slope of the downward trend line being calculated. It is calculated as the difference in value between the two pivot points (stored in up_val1 and up_val2) divided by the distance between the pivot points (calculated using their positions, stored in up1 and up2).
'high_line' is a variable that stores the current value of the trend line being calculated at a given point in the loop. It is initialized to the value of the second pivot point (stored in up_val2) and is updated on each iteration of the loop using the value of different.
'low_location' is a variable that stores the position (i.e., bar_index) on the chart of the point where the trend line being calculated first touches the low price. It is initialized to the position of the second pivot point (stored in up2) and is updated on each iteration of the loop if the trend line touches a lower low.
'low_value' is a variable that stores the value of the trend line at the point where it first touches the low price. It is initialized to the value of the second pivot point (stored in up_val2) and is updated on each iteration of the loop if the trend line touches a lower low.
'valid' is a Boolean variable that is used to indicate whether the trend line being calculated is valid. It is initialized to true and is set to false if the trend line does not pass through all the lows between the pivot points. If valid is still true after the loop has completed, then the trend line is considered valid and is drawn on the chart.
d_value1, d_value2, d_position1, and d_position2 are variables that are used in the loop that calculates the upward trend lines in the script. They are used to store intermediate values during the calculation process.
d_value1 and d_value2 are variables that store the values of the pivot points that are used to calculate the upward trend line.
d_position1 and d_position2 are variables that store the positions (i.e., bar indices) of the pivot points that are stored in d_value1 and d_value2, respectively. These positions correspond to the locations of the pivot points on the chart.
The variables d_value1, d_value2, d_position1, and d_position2 have the same function as the variables uv1, uv2, up1, and up2, respectively, but for the calculation of the upward trend lines rather than the downward trend lines. They are used in a similar way to store intermediate values during the calculation process.
thank you.
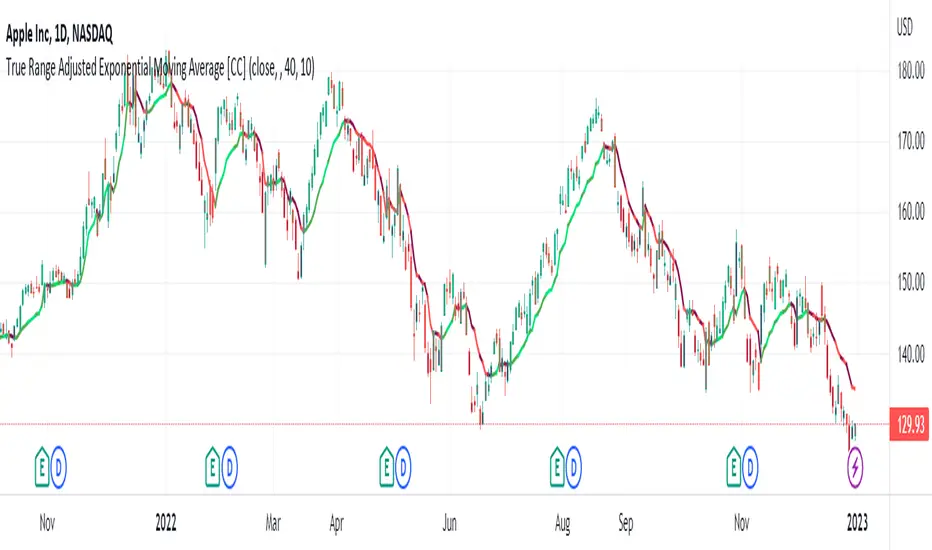
True Range Adjusted Exponential Moving Average [CC]The True Range Adjusted Exponential Moving Average was created by Vitali Apirine (Stocks and Commodities Jan 2023 pgs 22-27) and this is the latest indicator in his EMA variation series. He has been tweaking the traditional EMA formula using various methods and this indicator of course uses the True Range indicator. The way that this indicator works is that it uses a stochastic of the True Range vs its highest and lowest values over a fixed length to create a multiple which increases as the True Range rises to its highest level and decreases as the True Range falls. This in turn will adjust the Ema to rise or fall depending on the underlying True Range. As with all of my indicators, I have color coded it to turn green when it detects a buy signal or turn red when it detects a sell signal. Darker colors mean it is a very strong signal and let me know if you find any settings that work well overall vs the default settings.
Let me know if you would like me to publish any other scripts that you recommend!
Immediate Trend - VHXIMMEDIATE TREND - VULNERABLE_HUMAN_X
This indicator is used to identify the immediate trend in the market.
When a Short Term High (STH) is engulfed and closed above, we consider that as a bullish trend.
And Similarly, when a Short Term Low (STL) is engulfed and closed below, we consider that as a bullish trend.
STH - A candle that is higher than the one candle towards it's left and one candle towards it's right.
STL - A candle that is lower than the one candle towards it's left and one candle towards it's right.
HOW TO USE:
1. Do not take trades purely based on the immediate trend showcased by the indicator. Rather, use them as confluence with your trading strategy.
2. When you are expecting price to reverse at your point of interest (Denamd/Supply zone), this indicator can help you predict the reversal by showcasing the current trend.
3. Using this indicator you can travel the trend as long as there is a change of trend predicted by this indicator.

ATR Trend Bands [Misu]█ This indicator shows an upper and lower band based on price action and ATR (Average True Range)
The average true range (ATR) is a market volatility indicator used in technical analysis.
█ Usages:
The purpose of this indicator is to identify changes in trends and price action.
It is mainly used to identify breaking points and trend reversals.
But it can also be used to show resistance or support levels.
█ Features:
> Buy & Sell Alerts
> Buy & Sell Labels
> Color Bars
> Show Bands
█ Parameters:
Length: Length is used to calculate ATR.
Atr Multiplier: A factor used to balance the impact of the ATR on the Trend Bands calculation.

Support Resistance Channels/Zones Multi Time FrameHello All,
For long time I have been getting a lot of requests for Support/Resistance Multi Time Frame script. Here ' Support Resistance Channels/Zones Multi Time Frame ' is in your service.
This script works if the Higher Time Frame you set is higher than the chart time frame. so the time frame in the options should be higher than the chart time frame.
The script checks total bars and highest/lowest in visible part of the chart and shows all S/R zones that fits according the highest/lowest in visible part. you can see screenshots below if it didn't make sense or if you didn't understand
Let see the options:
Higher Time Frame : the time frame that will be used to get Support/Resistance zones, should be higher than chart time frame
Pivot Period : is the number to find the Pivot Points on Higher time frame, these pivot points are used while calculating the S/R zones
Loopback Period : is the number of total bars on higher time frame which is used while finding pivot points
Maximum Channel Width % : is the percent for maximum width for each channel
Minimum Strength : each zone should contain at least a 1 or more pivot points, you set it here. (Open/High/Low/Close also are considered while calculating the strength)
Maximum Number of S/R : the number of maximum Support/Resistance zones. there can be less S/Rs than this number if it can not find enough S/Rs
Show S/R that fits the Chart : because of we use higher time frame, you should enable this option then the script shows only S/Rs that fits the current chart. if you disable this option, all S/R zones are shown and it may shrink the chart. also you may not see any S/R zone if you don't choose the higher time frame wisely ;)
Show S/R channels in a table : if you enable this option (by default it's enabled) then lower/upper bands of all S/R zones shown in a table ( even if it doesn't fit the chart ). you can change its location. zones are sorted according to their strengths. first one is the strongest.
and the other options is about colors and transparency.
Screenshots before and after zoom-out:
after zoom-out number of visible bars and highest/lowest change and it shows more S/R zones that fits the current chart!
if you see Support Resistance zone like below then you should decrease ' Maximum Channel Width ' or you should set higher time frame better:
You can change colors and transparency:
You can change Table location:
Alerts added :)
P.S. I haven't tested it so much, if you see any issue please drop a comment or send me message
Enjoy!

Auto Fibonacci Levels + Auto Trend Line generatorAnother indicator for you guys!!!
This indicator consists of the 5 key Fibonacci retracement levels, plotted automatically to user input settings. I also have included an auto support/resistance trend line generator.
What is a Fibonacci retracement?
'Fibonacci retracement is a method of technical analysis for determining support and resistance levels. It is named after the Fibonacci sequence of numbers, whose ratios provide price levels to which markets tend to retrace a portion of a move before a trend continues in the original direction.' - Wikipedia
How to use the Fibonacci retracement?
- The Fibonacci levels are default. These percentiles from price to the average of the high in a sample and low in a sample give you a guideline of where a bottom may be, where a top may be, and where a range is being created.
- Look for the price to reject from 61.8% and 76.4%, and also look for price to bounce from 38.2% and 23.6%. If a lower low/higher high is made, the fib levels will follow and the percentiles within will be recalculated after a 5 candle offset period.
- If you see price trending towards the lower percentiles (38&23) and using the 50% as resistance, look for a break downwards and vice versa.
-This Fibonacci set as all others is subject to fake-out, always use this with another series indicator, or don't use it as a signal for entry at all (unless you have a backdated strategy)
How to use the trend line generator?
-The trend line generator will only plot when a lower low/higher high has taken place within the input amount of candles. It is also offset by a user amount.
-The check box will give the option to have the trend line's plot or not.
- If you see a green/red dot it means that that will be your first coordinate for the trend line, and until the computations are complete it will give you an idea of which direction it will be in (resistance or support)
-When opening this indicator zoom out all the way to connect any trend lines that do not load automatically.
Let me know if you have any questions, suggestions or issues! Thank you everyone!
-Cheatcode1 :)
SP:SPX TVC:DXY BMFBOVESPA:EUR1! CME:BTC1! BINANCE:BTCUSDT

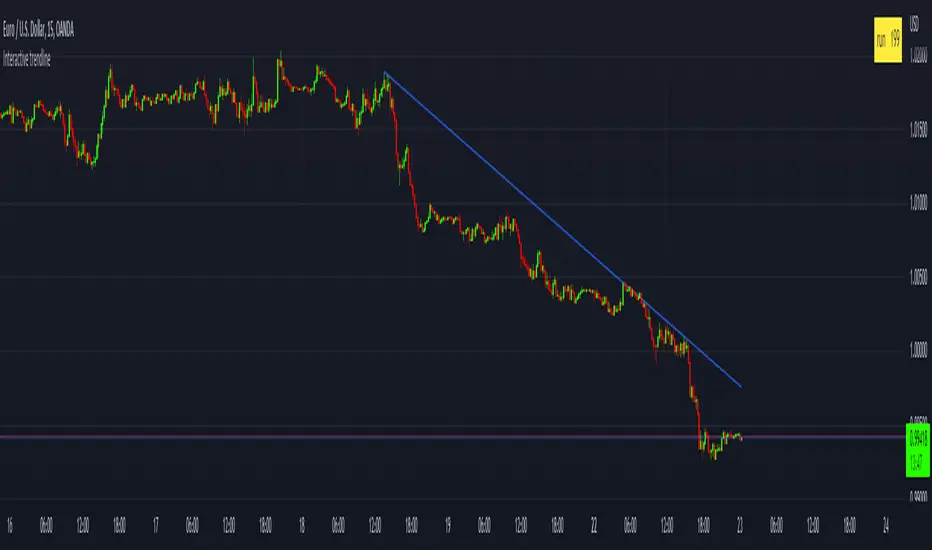
Interactive trendlineThis is a concept that I have been playing with
to make a manual trend line that has more then just two connecting dots
but that has sequential data connected on every bar between the
beginning an the end point that can then be used to determine a break of trend or
a bounce.
This is added in a few simple steps
1) add the indicator to your chart
2) set the x_1 time bar
3) set the y_1 price
4) set the x_2 time bar
5) set the y_2 price
6) check the table that calculated the run value and enter that value in the settings box in the "Run" input box
Smarter SNR (Support and Ressistance, Trendline, MTF OSC)Built with love "Smarter SNR (Support and Ressistance, Trendline, MTF OSC) "
This indiator will show you Support & Ressistance, Good Trendline, and Multi-timeframe analyzing of Oscillator (Stochastic and RSI)
You can combine with your own strategy, or use this purely
DISCLAIMER :
Measure the risk first before use it in real market
Backtest The Strategy was very important, so you know the probability
Fundamentally Logical :
SNR -> Last 3 Zigzag Pivot
Trendline -> Using two last pivot for calculating the slope
Features :
1. SNR
2. Trendline
3. MTF Oscillator Analyzing
How to use it :
1. All Label, Table & Line can be turned on/off in settings
2. Pivot Period can be Adjusted in settings
3. All Label, Table & Line style can be adjusted in settings
Regards,
Hanabil

TrendLineScalping-BasicDear Traders,
Here is the thought which came to my mind on the trendline break scalping. sometimes during the trade we do plot trendlines and we do anticipate for the line to break and take a trade. with the same thing in mind I had created this basic script to help you and other to create based on the logic used in the script.
This is just a logic based script and doesn't do any kind of wonders. Hence you may use it as necessary.
Regards....

Gann FanHello All,
For long time I have been getting many requests about Gann Fan indicator. now we have linefill() function in Pine Language and I think it's right time to make Gann Fan Indicator. Many Thanks to Pine Team for adding many new features to the Pine Language!
How this indicator works:
- It calculates midline (1/1)
- By using midline it calculates other lines (1/2, 1/3, 1/4...etc)
- It calculates highest/lowest Pivot Points in last 280 bars.( by default it's 280 bars, you can change it and pivot period )
- It checks the location of highest/lowest Pivot Points
- After the calculation of the Gann Fan lines, it draws lines, puts Labels and paints the zones between the lines according to the colors set by the user
Long time ago I created a special algorithm for calculating the line with 45 degree and I used it for "1/1" line. Anybody who needs it can use this algorithm freely ;)
Options:
You can change following items;
- The colors
- Transparency. Possible values for transparency are from 0 (not transparent) to 100 (invisible)
- Line styles
- Loopback Period (by default it's 280)
- Pivot Period (by default it's 5)
- Enable/disable Labels
- Label location (by default it's 50
Tradingview Gann Fan page : The Gann Fan is a technical analysis tool created by WD Gann. The tool is comprised of 9 diagonal lines (extending indefinitely) designed to show different support and resistance levels on a chart. These angles -drawn from main tops and bottoms- divide time and price into proportionate parts and are often used to predict areas of support and resistance, key tops and bottoms and future price moves. Please note that the chart needs to be scaled properly to ensure the market has a square relationship....
Enjoy!

Support Resistance InteractiveHello All,
Using this "Support Resistance Interactive" script you can set the Support/Resistance levels interactively by clicking on the chart. Using the SR levels you set, the indicator creates Support Resistance zones. The width of the zones are calculated by using Threshold option and Threshold is the percent of the distance between Highest/Lowest levels in last 300 bars. if you set Threshold = 1 then it means 1% of the distance between Highest/Lowest levels. You can change SR levels by moving the level up/down by using your mouse anytime you want.
Now lets see it step by step;
After you added the indicator it will ask 5 Support/Resistance Levels and when you click any point then it's kept as S/R level and it asks another SR levels. if you want to use only 3 SR levels then last 2 SR levels are not important and you can click anywhere on the chart;
After you set all SR levels, it will ask "Number of Support/Resistance" . if you want to activate first 3 SR lines then set it 3. by default it's 5. when you set it click "Apply" and see the SR zones. that's it.
You can enable/disable alerts and set frequency, then create alerts. as it's interactive tool, the SR levels you set are specific for the current/active symbol. if you open another symbol then you better delete the indicator and add it again
Three Alerts exist in the script: Support Broken, Resistance Broken and Price in SR zone . you can enable/disable the alerts as you wish and you can set frequency for each one as "Once Per Bar" or "Once Per Bar Close"
by default Green/Red/Gray colors are used but You can change the colors using the options. according to the Price moves, SR zone colors are changed automatically.
when we have "Reset" feature to run the script interactively (like we added it for first time) I can update the script, then you will not need to delete/re-add each time you changed the symbol :)
In this example "Threshold" is 2 and "Number of Support/Resistance" is 4.
in this example "Threshold" is 0 and "Number of Support/Resistance" is 5.
Last example; Labels are shown for each zone, you can set location of the labels. SR order and Upper/lower band of each zone are shown in each label.
Enjoy!

Indicators OverlayHello All,
This script shows the indicators in separate windows on the main chart. Included indicators are RSI, CCI, OBV, Stochastic, Money Flow Index, Average True Range and Chande Momentum Oscillator. indicator windows are located at the top or bottom of the chart according to last moves of the Closing price. Different colors are used for each indicator. Horizontal levels are shown as dashed line and label as well.
Using the options;
You can enable/disable the indicators you want to see or not
You can change source and length for each indicator
You can set window length. using this length indicator windows are located on the chart
After you added this indicator to your chart I recommend: right click on any of the indicator windows => "Visual Order" => "Bring to front" as seen screenshot below:
in this example only 3 indicators enabled and period is set as 80:
indicator windows moves to the top or bottom of the chart according to the close price:
P.S. if you want to see any other indicator in the options then leave a comment under the indicator ;)
Enjoy!

3rd WaveHello All,
In Elliott Wave Theory, 3rd wave is not the shortest one in the waves 1/3/5 and it's usually longest one. so if we can catch it then we may get good opportunities to trade. This script finds 3rd wave experimentally. it can be also the 3rd waves in the waves 1, 3, 5, A and C. the 3rd wave should have greater volume than other waves, the script can check its volume and compare with the volumes of the waves 1 and 2 optionally.
Pine Team released Pine version 5! This script was developed in v5 and it uses Library feature of Pine v5 for the zigzag functions. This script is also an example for the Pine developers who learn Pine v5 and Libraries.
Options:
Zigzag Period: is the length that is used to calculate highest/lowest and the zigzag waves
Min/Max Retracements: is the retracement rates to check the wave 2 according to wave 1. for example; if min/max values are 0.500-0.618 then wave 2 must be minimum 0.500 of wave 1 and maximum 0.618 of wave 1.
Check Volume Support: is an option to compare the volumes of1. 2. and . waves. if you enable this option then the script checks their volume and 3rd wave volume must be greater then 1 and 2
there are 4 options for the targets. you can enable/disable and change their levels. targets are calculated using length of wave 1.
Options to show breakout zone, zigzag, wave 1 and 2.
and some options for the colors.
The Library that is used in this script:
P.S. This is an experimental work and can be improved. So do not hesitate to drop your comments under the script ;)
Enjoy!

LTB Zigzag CirclesHello All,
Today I am here with a new idea and script, " LTB Zigzag Circles ". The idea is to create Circles using last 2 zigzag waves and to catch the breakouts earlier than horizontal lines. if a circle is broken then the script shows entry for Long/Short positions. and if broken circle reappears again then the position is closed. You can change Zigzag period as you wish and see the different results.
Here you can see how the script calculates and draws the Circles:
Below you can see how the script draws part of the circle on each bar:
Optionally the script can show levels:
P.S. I haven't tested it as a strategy, Result and Performance may change by Zigzag period, you need to find best Zigzag period according to your strategy. By the way, my Zigzag Circles idea can be improved, if you have any recommendation let me know please ;)
Enjoy!

Point and Figure Chart - LiveHello Traders,
This is "Point and Figure Chart (PnF)" script that run in separated window in real time. The separated PnF chart window is timeless, so no relation with the time on the chart. PnF chart consist of "X" and "O" columns. While "X" columns represents rising prices, "O" column represents a falling price. If you have no idea about what PnF charting is then you should search for "Point and Figure Charting" on the net and get some info before using this script.
Now lets talk about details. PnF Chart requires at least two variables to be set => Box size and Reversal. Box size represents the size of each X/O in PnF chart and the reversal is used to calculate new X/O or reversal. for example if currrent column is X column then for new "X", "box size * 1" move is needed and for new "O" column or reversal, "box size * revelsal" move is needed. in the script I use lines as X/O columns.
In the options you can set "Box Size Assingment Method". you have 3 options Traditional, ATR, Percentage . what are they?
Traditional: user-defined box size, means you can set the box size as you wish, using the option . if you use this option then you should set it accordingly.
ATR : that's dynamic box size scaling and on each columns it's calculated once, you can set length for ATR
Percentage: that's also dynamic box size scaling according to closing price when new column appeared. if you use this option then you should set it accordingly.
Reversal: The reversal is typically 3 but you can change it as you wish
"Change Bar Color by PnF Trend": if you enable this option then bar color changes by PnF columns, by default it's not enabled
"Change Column Color When Breakout Occurs": PnF color changes if Double Top/Bottom breakout accours. enabled by default and you can set the colors as you wish using the options
"Change Bar Color When Breakout Occurs": bar colors changed if Double Top/Bottom breakout accours. enabled by default and you can set the colors as you wish using the options
the script checks only Double Top/Bottom breakouts at the moment. there are many other breakouts such Triple/Quadruple, Ascending/Descending Triple Top/Bottom breakouts, Catapult etc.
Also the script shows new X/O level and reversal Levels in PnF window. An example:
If you enable "Change Bar Color by PnF Trend" option:
An example if you disable the option "Change Column Color When Breakout Occurs
You may want to see my another/older "Point and Point Chart" script as well. you can find it in my profile/published scripts and in the Public Library. I use same PnF calculation algorithm in both scripts.
Enjoy!

Divergence for Many Indicators v4Hello Traders,
Here is my new year gift for the community, Digergence for Many Indicators v4 . I tried to make it modular and readable as much as I can. Thanks to Pine Team for improving Pine Platform all the time!
How it works?
- On each candle it checks divergences between current and any of last 16 Pivot Points for the indicators.
- it search divergence on choisen indicators => RSI , MACD , MACD Histogram, Stochastic , CCI , Momentum, OBV, VWMACD, CMF and any External Indicator !
- it checks following divergences for 16 pivot points that is in last 100 bars for each Indicator.
--> Regular Positive Digergences
--> Regular Negative Digergences
--> Hidden Positive Digergences
--> Hidden Negative Digergences
- for positive divergences first it checks if closing price is higher than last closing price and indicator value is higher than perious value, then start searching divergence
- for negative divergences first it checks if closing price is lower than last closing price and indicator value is lower than perious value, then start searching divergence
Some Options:
Pivot Period: you set Pivot Period as you wish. you can see Pivot Points using "Show Pivot Points" option
Source for Pivot Points: you can use Close or High/Low as source
Divergence Type: you can choose Divergence type to be shown => "Regular", "Hidden", "Regular/Hidden"
Show Indicator Names: you have different options to show indicator names => "Full", "First Letter", "Don't Show"
Show Divergence Number: option to see number of indicators which has Divergence
Show Only Last Divergence : if you enable this option then it shows only last Positive and Negative Divergences
you can include any External Indicator to see if there is divergence
- enable "Check External Indicator"
- and then choose External indicator name in the list, "External Indicator"
- External indicator name is shown as Extrn
- related external indicator must be added before enabling this option
Coloring, line width and line style options for different type of divergences.
Following Alerts added:
- Positive Regular Divergence Detected
- Negative Regular Divergence Detected
- Positive Hidden Divergence Detected
- Negative Hidden Divergence Detected
Now lets see some examples:
Hidden Divergences:
Regular and Hidden Divergences together:
Showing first letters of indicators:
You can see only the number of indicators which has divergence:
You can see only divergence lines without indicators names and numbers:
option to used different label/line/text colors:
You have option to see only last divergences:
You can change Pivot Period, in following example Pivot Period = 15:
You can use Close or High/Low as Source for Divergence
You can include external indicators and get divergences on it:
Wish you all a happy new year!
Enjoy!

TrendLine ChannelsAbstract
This script provides a set of Trendline Channels which can be tighter than Donchian Channels.
This script computes the most suitable active upper and lower trendlines and updates them as soon as possible.
We can use it for breakout signals earlier than Donchian Channels.
Introduction
Channels are tools which can mark area of values of ranging markets.
Once the price leaves the original region, range traders may start admitting they are wrong and trigger trend.
Donchian Channels (misheard as Dungeon Channels) use the highest and the lowest price to define area of values.
When the price breakouts, it just like it got released from a dungeon.
However, waiting for the price making even higher or lower may be too late and risk reward ratio may be lower.
Trendlines can make the channels tighter and we can find earlier breakout signals.
Computing Trendline Channels
(1) Find the most active trendlines
In this script, a valid trendline connects two high values or two low values.
A high value means the highest value in a trading day.
A low value means the lowest value in a trading day.
In this script, every trendline does not crossover any bar but can exactly touch them.
The most flat trendline is taken. (one for upper and one for lower)
(2) Continue to use or Change a trendline
If there is a tighter trendline available, this script changes to use it.
If the previous active trendline is broken, this script re-computes the trendline available.
When this case happens, this script display with an another color.
Otherwise, this script continues using the previous trendline.
(3) Middle line
The middle line indicates the middle value between the upper and the lower.
Parameters
Length : how many days are used for computation. The default value is 16 just because 16=4*4, using binary characteristic.
x_go_on : If the previous trendline is not breakout and there are no tighter trendlines available, we continue use it.
Color Options
(1) Upper trendline (no update or tighter)
(2) Upper trendline (changed due to breakout)
(3) Middle line
(4) Lower trendline (no update or tighter)
(5) Lower trendline (changed due to breakout)
Conclusion
Trendline Channels can be tighter than Donchian Channels and evaluate earlier breakout signals.
Comparing to known auto trendline scripts, Trendline Channels is continuous.
Once a trendline is broken, Trendline Channels can instantly point out the next available one.
If you think the price movement is boring or you cannot have good risk reward ratio, you can go to an another timeframe.
Reference
How to trade with Donchian Channels
How to trade with Trendlines

Linear Regression ChannelHello Traders,
There are several nice Linear Regression Channel scripts in the Public Library. and I tried to make one with some extra features too. This one can check if the Price breaks the channel and it shows where is was broken. Also it checks the momentum of the channel and shows it's increasing/decreasing/equal in a label, shape of the label also changes. The line colors change according to direction.
using the options, you can;
- Set the Source (Close, HL2 etc)
- Set the Channel length
- Set Deviation
- Change Up/Down Line colors
- Show/hide broken channels
- Change line width
meaning of arrows:
⇑ : Uptrend and moment incresing
⇗ : Uptrend and moment decreasing
⇓ : Downtrend and moment incresing
⇘ : Downtrend and moment decreasing
⇒ : No trend
An example for how color of lines, arrow direction and shape of label change.
Enjoy!

RSI Multi Time FrameHello Traders,
Recently we got new features in Pine such Arrays of Lines, Labels and Strings. Thanks to the Pine Team! ( here )
So I decided to make new style of Multi Time Frame indicator and I used Array of Lines in this script. here it is, RSI Multi Time Frame script. it shows RSI for current time frame as it is and also it gets RSI for the Higher Time Frame and converts it and shows it as in time frame. as you can see, RSI for HTF moves to the right on each candle until higher time frame was completed.
You have color and line width options for both RSI, also if you want you can limit the number of bars to show higher time frame RSI by the option " Number of Bars for RSI HTF ", following example show RSI HTF for 100 bars.
Most of you know that old style Multi Time Frames indicators was like:
Hope you like this new Multi time frame style ;)
Enjoy!

Market ProfileHello All,
This is Market Profile script. "Market Profile is an intra-day charting technique (price vertical, time/activity horizontal) devised by J. Peter Steidlmayer. Steidlmayer was seeking a way to determine and to evaluate market value as it developed in the day time frame. The concept was to display price on a vertical axis against time on the horizontal, and the ensuing graphic generally is a bell shape--fatter at the middle prices, with activity trailing off and volume diminished at the extreme higher and lower prices." You better search it on the net for more information, you can find a lot of articles and books about the Market Profile.
You have option to see Value Area, All Channels or only POC line, you can set the colors as you wish.
Also you can choose the Higher Time Frame from the list or the script can choose the HTF for you automatically.
Enjoy!

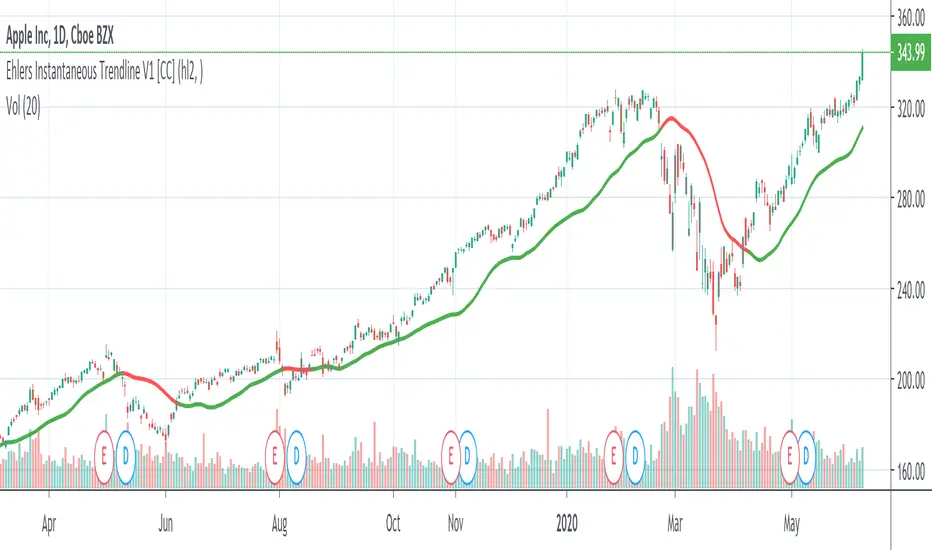
Ehlers Instantaneous Trendline V1 [CC]The Instantaneous Trendline was created by John Ehlers (Rocket Science For Traders pgs 109-110) and this indicator is perfect for determining the medium to long term trend. Buy when the indicator line is green and sell when it is red. I will be introducing a different version of this indicator which is perfect for short term trends so these will pair great together.
Let me know if there are other scripts you would like to see me publish or if you want something custom done!
Consolidation Zones - LiveHello Traders!
This is the script that finds Consolidation Zones in Realtime.
How it works?
- The script finds highest/lowest bars by using "Loopback Period"
- Then it calculates direction
- By using the direction and highest/lowest bar info it calculates consolidation zones in realtime
- If the length of consolidation area is equal/greater than user-defined min length then this area is shown as consolidation zone
- Then Consolidation Zone extends automatically if there is no breakout
if you increase the Loopback Length then you get bigger consolidation zones:
You have option to "Paint Consolidation Area" or not:
Enjoy!
