Sniper Perfect: Institutional Flow & Adaptive Risk ProtocolOverview Sniper Perfect is an advanced trend-following system designed to filter out "fakeouts" and institutional traps using a multi-layered verification protocol. It combines Volume Flow (VFI), Volatility (CHOP), and Momentum (RSI) to ensure entry only occurs in high-probability setups.
Key Features
🛡️ The Triple Filter Protocol
Strict Choppiness Filter: Uses a strict CHOP threshold (40). If the market is moving sideways, the algorithm locks all new entries to prevent whipsaws.
RSI Extremes Protection: Prevents FOMO buying at tops (Overbought > 70) and panic selling at bottoms (Oversold < 30).
Conflict Zone Detection: Identifies divergence between Price action and Money Flow. If price rises but institutional money exits, the background turns Gray and trading is disabled.
🔒 Adaptive Risk Management
Heat-Breathing Stop Loss: The SL distance adjusts dynamically based on market Volume and Volatility ("Heat").
Ratchet Mechanism: A mechanical lock ensures the Stop Loss can ONLY move in the direction of profit. It never loosens, guaranteeing that paper profits are protected.
📊 Live Dashboard A real-time panel in the bottom-right corner displays:
VFI Flow: Positive/Negative money flow.
Market Status: Active vs. Locked (Choppy).
RSI Status: Neutral, Overbought, or Oversold.
Visual Guide
🟢 Lime Zone: Clean Bullish Trend.
🔴 Red Zone: Clean Bearish Trend.
🟠 Orange Zone: High Choppiness (Stay Out).
🟣 'X' Marker: Exact price where the Stop Loss was triggered.
Disclaimer: For educational and research purposes only. Always manage your risk.
Análise de Tendência

Sniper PerfectOverview Sniper Perfect is an advanced trend-following system designed to filter out "fakeouts" and institutional traps using a multi-layered verification protocol. It combines Volume Flow (VFI), Volatility (CHOP), and Momentum (RSI) to ensure entry only occurs in high-probability setups.
Key Features
🛡️ The Triple Filter Protocol
Strict Choppiness Filter: Uses a strict CHOP threshold (40). If the market is moving sideways, the algorithm locks all new entries to prevent whipsaws.
RSI Extremes Protection: Prevents FOMO buying at tops (Overbought > 70) and panic selling at bottoms (Oversold < 30).
Conflict Zone Detection: Identifies divergence between Price action and Money Flow. If price rises but institutional money exits, the background turns Gray and trading is disabled.
🔒 Adaptive Risk Management
Heat-Breathing Stop Loss: The SL distance adjusts dynamically based on market Volume and Volatility ("Heat").
Ratchet Mechanism: A mechanical lock ensures the Stop Loss can ONLY move in the direction of profit. It never loosens, guaranteeing that paper profits are protected.
📊 Live Dashboard A real-time panel in the bottom-right corner displays:
VFI Flow: Positive/Negative money flow.
Market Status: Active vs. Locked (Choppy).
RSI Status: Neutral, Overbought, or Oversold.
Visual Guide
🟢 Lime Zone: Clean Bullish Trend.
🔴 Red Zone: Clean Bearish Trend.
🟠 Orange Zone: High Choppiness (Stay Out).
🟣 'X' Marker: Exact price where the Stop Loss was triggered.
Disclaimer: For educational and research purposes only. Always manage your risk.

The Truth Sniper: Breathing Edition**Overview**
This is a highly advanced trend-following strategy designed to filter out market noise ("Fakeouts") and manage risk using a dynamic "Breathing Ratchet" mechanism. It combines traditional trend analysis with institutional money flow logic to identify the true market direction.
**Key Features**
**1. The Conflict Zone (Gray Zone Filter)**
Most strategies fail during low-volume accumulation or distribution phases. This algorithm introduces a "Conflict Zone" logic:
* **True Rally (Green):** Price is above EMA50 AND Money Flow (VFI) is positive.
* **True Drop (Red):** Price is below EMA50 AND Money Flow (VFI) is negative.
* **Conflict (Gray Background):** When Price and Money Flow disagree (e.g., Price rising on negative volume), the background turns Gray. **Trading is disabled** in these zones to avoid bull/bear traps.
**2. Breathing Stop-Loss Mechanism (Volatility Adjusted)**
The Stop Loss isn't static. It "breathes" based on market heat (Volume/RSI):
* **High Heat (High Volatility):** The SL loosens its grip, moving towards the bottom of the Fibonacci zone to allow price fluctuation without premature exits.
* **Low Heat (Low Volatility):** The SL tightens aggressively towards the price to lock in profits during slow momentum.
**3. The Ratchet Lock (Slippage Prevention)**
To ensure maximum profit retention, the "Breathing" mechanism is governed by a **Ratchet Logic**:
* **For Longs:** The Stop Loss can ONLY move UP. If the "Breathing" calculation suggests lowering the stop (due to increased volatility), the Ratchet blocks it, keeping the SL at the highest historical level.
* **For Shorts:** The Stop Loss can ONLY move DOWN.
**4. Fibonacci Exit Zones**
Exits are calculated based on a 60-day dynamic High/Low lookback, creating "Zones" (0-23.6%, 23.6-38.2%, etc.) that the price must conquer. The SL trails these zones mechanically.
**Visual Guide**
* **Lime/Red Background:** Active Trade Zone (Confirmed Trend).
* **Gray Background:** Conflict Zone (Stay Out / Hold).
* **Purple 'X':** The exact price level where the Stop Loss was hit (Fixed marker).
* **Stepline:** The active Stop Loss level (Visible only during open trades).
**Disclaimer**
This script is for educational and research purposes only. Always manage your risk.

12M Return Strategy This strategy is based on the original Dual Momentum concept presented by Gary Antonacci in his book “Dual Momentum Investing.”
It implements the absolute momentum portion of the framework using a 12-month rate of change, combined with a moving-average filter for trend confirmation.
The script automatically adapts the lookback period depending on chart timeframe, ensuring the return calculation always represents approximately one year, whether you are on daily, weekly, or monthly charts.
How the Strategy Works
1. 12-Month Return Calculation
The core signal is the 12-month price return, computed as:
(Current Price ÷ Price from ~1 year ago) − 1
This return:
Plots as a histogram
Turns green when positive
Turns red when negative
The lookback adjusts automatically:
1D chart → 252 bars
1W chart → 52 bars
1M chart → 12 bars
Other timeframes → estimated to approximate 1 calendar year
2. Trend Filter (Moving Average of Return)
To smooth volatility and avoid noise, the strategy applies a moving average to the 12M return:
Default length: 12 periods
Plotted as a white line on the indicator panel
This becomes the benchmark used for crossovers.
3. Trade Signals (Long / Short / Cash)
Trades are generated using a simple crossover mechanism:
Bullish Signal (Go Long)
When:
12M Return crosses ABOVE its MA
Action:
Close short (if any)
Enter long
Bearish Signal (Go Short or Go Flat)
When:
12M Return crosses BELOW its MA
Action:
If shorting is enabled → Enter short
If shorting is disabled → Exit position and go to cash
Shorting can be enabled or disabled with a single input switch.
4. Position Sizing
The strategy uses:
Percent of Equity position sizing
You can specify the percentage of your portfolio to allocate (default 100%).
No leverage is required, but the strategy supports it if your account settings allow.
5. Visual Signals
To improve clarity, the strategy marks signals directly on the indicator panel:
Green Up Arrows: return > MA
Red Down Arrows: return < MA
A status label shows the current mode:
LONG
SHORT
CASH
6. Backtest-Ready
This script is built as a full TradingView strategy, not just an indicator.
This means you can:
Run complete backtests
View performance metrics
Compare long-only vs long/short behavior
Adjust inputs to tune the system
It provides a clean, rule-driven interpretation of the classic absolute momentum approach.
Inspired By: Gary Antonacci – Dual Momentum Investing
This script reflects the absolute momentum side of Antonacci’s original research:
Uses 12-month momentum (the most statistically validated lookback)
Applies a trend-following overlay to control downside risk
Recreates the classic signal structure used in academic studies
It is a simplified, transparent version intended for practical use and educational clarity.
Disclaimer
This script is for educational and research purposes only.
Historical performance does not guarantee future results.
Always use proper risk management.

Robrechtian Long-Medium Breakout Trend SystemRobrechtian Long–Medium-Term Breakout Trend System
A professional, rule-based trend-following strategy designed to capture large, sustained price movements using pure price action and breakouts.
This system follows long-established trend-following philosophy: no prediction, no volatility targeting, and no profit targets. Only disciplined entries, position additions, and exits driven entirely by trend structure.
Core Principles
Breakout-driven entries: Initial positions are taken only when price breaks above/below the 80-day Donchian channel, confirming a long–medium-term trend shift.
Short-term confirmation: Breakouts must also exceed the 20-day channel, reducing false positives.
Trend-direction filter: A 50-day moving average slope filter ensures alignment with the broader trend.
Explosive bar filter: Entries avoid excessively large, single-candle expansions (>2.5× ATR(20)) to prevent chasing exhaustion spikes.
Pyramiding into strength: Additional units are added only when price makes fresh 20-day breakouts in the direction of the trend. No scaling out. No adding on dips.
Exit only on trend violation: Positions are closed exclusively when price breaks the opposite 80-day channel. This preserves unlimited upside while enforcing disciplined exits.
Pure trend philosophy: No volatility targeting, no smoothing, no discretionary overrides, no optimization for short-term performance.
Intended Use
This system is designed primarily for diversified futures portfolios, where diversification across dozens of globally liquid markets creates robustness and stability. However, it may also be used on individual assets for educational and analytical purposes.
The system embraces the core trend-following logic:
Small losses, big winners, and unlimited upside when trends persist.
⚠️ WARNINGS / DISCLAIMERS
⚠️ Warning 1 — This strategy is not optimized for single stocks
The Robrechtian Trend System is designed for multi-asset futures portfolios, not single equities.
Performance on individual tickers may vary greatly due to lack of diversification.
⚠️ Warning 2 — Trend following includes substantial drawdowns
Deep drawdowns are a normal and expected feature of all long-term trend-following systems.
The strategy does not attempt to smooth returns or manage volatility.
If you seek steady, low-volatility equity curves, this system is not suitable.
⚠️ Warning 3 — No volatility targeting or risk smoothing
This system intentionally avoids volatility-based position sizing.
Trades may experience larger fluctuations than systems using risk parity or vol targeting.
⚠️ Warning 4 — Not financial advice
This script is for educational and research purposes only.
Past performance does not guarantee future results.
Use at your own risk.
⚠️ Warning 5 — TradingView backtests have known limitations
TradingView does not simulate:
futures contract roll logic
slippage
real bid/ask spreads
liquidity conditions
limit-up/limit-down behavior
Results may vary from live market execution.


Triple EMA + RSI + ATRThis comprehensive trading system combines triple EMA alignment, RSI momentum filtering, and dynamic ATR-based risk management. The strategy enters positions only when fast, medium, and slow EMAs align in proper order (bullish or bearish), confirmed by RSI remaining within defined thresholds (not overbought/oversold) and a volume spike above its moving average. Exits are managed intelligently using a multi-tier approach: a fixed stop-loss based on ATR, a first profit target at a predefined risk-reward ratio, and a trailing stop that activates after reaching a second, higher profit tier. Designed for trend-following with built-in momentum and volume confirmation, it features professional order execution with configurable commission and slippage for realistic backtesting. Visual cues including colored backgrounds and signal shapes enhance chart clarity.

Trend Signal MomentumOVERVIEW
Signal Trend Momentum is a hybrid strategy that combines multiple confirmations and filters to obtain better potential trading signals. Each confirmation and filter in Signal Trend Momentum aims to avoid possible false and trap signals.
HYBRID CONCEPTS
Smart Money Concept – This indicator forms market structure and Bullish & Bearish Order Block areas to make it easier to identify market trends and strong areas where price reversals often occur. Its purpose is to simplify recognizing market direction and serve as the first confirmation.
MSS + BOS (Market Structure Shift + Break of Structure) – This indicator serves as additional confirmation for the Smart Money Concept. With the presence of two types of market structure, the market trend direction becomes clearer and more convincing.
RSI Momentum Signal – This indicator becomes the third confirmation. When the Market Trend is clear and convincing, supported by the formation of Bearish and Bullish Order Blocks, the role of the Momentum Signal here becomes crucial as it provides trend momentum based on overbought and oversold areas.
Momentum Position – This indicator becomes the next confirmation based on buyer and seller VOLUME in the market. If buyer volume is higher, the momentum position will be depicted on the chart with an upward arrow, and conversely, if seller volume is higher, it will be depicted with a downward arrow.
SnR (Support and Resistance) – This final indicator is Support and Resistance, which will serve as the last and more convincing confirmation. Support and Resistance will strengthen the Order Block areas formed by the Smart Money Concept indicator. A Bullish Order Block + Support creates a higher possibility for an upward trend in the market, conversely, a Bearish Order Block + Resistance creates a higher possibility for a downward trend in the market.
The combination of these several indicators will provide a strong market direction + persistent buyer and seller areas, as well as depict momentum based on volume + RSI which serve as additional confirmations.
These additional confirmations will produce stronger signals and help avoid false and trap signals in the market.
HOW TO USE
A SHORT SIGNAL will be strong if there is a Downtrend Market Structure + Bearish Order Block + Resistance + Oversold RSI Momentum + Strong Seller Volume Momentum.
A LONG SIGNAL will be strong if there is an Uptrend Market Structure + Bullish Order Block + Support + Overbought RSI Momentum + Strong Buyer Volume Momentum.
CONCLUSION
Signal Trend Momentum is a combination of several powerful indicators designed to produce stronger, clearer, and easier-to-read signals.
This strategy is highly suitable for traders seeking more convincing trade signals based on multiple confirmations from the combined indicators, thereby creating a strong signal with a higher probability.

A13: Micro MAP Scalping StrategyA13: Micro MAP Scalping Strategy — Institutional Breakout Scalper (Pine Script v6 – Protected Source)
A completely original, professional scalping strategy developed from scratch over several months of research and live-market testing. The system is built around institutional breakout zones with a unique multi-stage validation process, strict confirmation requirements, and sophisticated risk management — all designed specifically for 1–15 minute timeframes.
Why this implementation is original and the source code is protected
The entire logic — from breakout detection to entry confirmation, multi-filter stop-loss engines, and dynamic position sizing — was built independently without relying on any existing public libraries, built-ins, or open-source code beyond standard Pine functions. The proprietary validation rules, ATR-scaled gap filtering, and layered confirmation system required extensive original development to achieve consistent performance in real-market conditions. Protecting the source code is necessary to preserve the unique edge that distinguishes this system from standard or publicly available implementations.
Core concepts and methodology (fully transparent — no code revealed)
1. Institutional Breakout Zone Detection
• Real-time identification of high-probability zones using a custom ATR-based minimum gap filter
• Zones are only considered valid when accompanied by clear price displacement and volume confirmation
• No reliance on standard Fair Value Gap or order block libraries — completely custom validation
2. Strict Dual Confirmation Entry Logic
• Entry requires one of two precise conditions:
— Confirmed pullback retest of the validated breakout zone, or
— Clean inside-bar formation fully contained within the zone
• Both conditions must align with the directional bias of the breakout
3. Five Independent Stop-Loss Engines
• ATR-based (default and recommended)
• Swing Low/High levels
• Pivot Point structure
• Trailing Stop with ATR offset
• Fixed percentage
• Every engine includes minimum and maximum stop-loss filters to prevent unrealistic risk during extreme volatility
4. Professional Risk & Position Sizing Engine
• Fixed percentage risk per trade (default 1%)
• Optional compounding mode for growing accounts
• Real-time calculation based on exact stop distance and current equity
• Full integration with leverage settings
5. Multi-Layer Filtering System
• Multi-timeframe EMA filter (default 60-period, fully customizable timeframe)
• Complete trading session control with UTC offset support
• Date range filtering for strategy deployment control
• Consecutive loss protection (optional multi-stop filter)
• Minimum/maximum stop-loss filters to eliminate low-probability setups
6. Real-Time Performance Dashboard
• Live display of win rate, net profit, maximum drawdown, total trades
• Consecutive win/loss streak tracking
• Current position size and average entry price
• All statistics visible directly on chart
Backtesting settings used in the published chart
• Symbol: BTC/USD
• Timeframe: 15-minute
• Initial capital: $10,000
• Risk per trade: 1%
• Commission: 0.04% (realistic for major brokers)
• Slippage: enabled
• Sample size: 200+ trades
These are the exact default Properties settings of the strategy.
The strategy is completely free to add and use on your charts.
#Scalping #Breakout #Intraday #Institutional #RiskManagement #ProfessionalStrategy

Supertrend + MAXTRA inputsThe Supertrend strategy is a trend-following trading method that uses the Supertrend indicator, which is calculated based on the ATR (Average True Range). When the price closes above the Supertrend line, it generates a buy signal, and when the price closes below the Supertrend line, it generates a sell signal. The indicator continuously trails the price, helping traders identify trend direction, ride trends, and manage stop-loss levels.

EMA + Sessions + RSI Strategy v1.0A professional trading strategy that combines multiple technical indicators for high-probability entries. This system uses EMA crossovers, RSI zone filtering, and trend confirmation to identify optimal trading opportunities while managing risk with advanced position management tools.
Key Features:
✅ Dual Entry Signals (EMA21 + EMA100 crossover conditions)
✅ Trend Filter EMA750 (trade only with the major trend)
✅ Complete Risk Management (SL 1%, TP 3% default)
✅ Trailing Stop & Breakeven (maximize profits, protect capital)
✅ Compact Statistics Table (real-time performance metrics)
✅ RSI & Session Filters (avoid low-probability setups)
✅ Optional Pyramiding (scale into winning positions)
Perfect for swing trading and trend-following on any timeframe. Fully customizable to match your trading style.

Supertrend Cloud ProSupertrend Cloud Pro is a next-generation trend + breakout system designed for traders who want clean structure, early breakout confirmation, and disciplined exits.
The strategy combines Fast + Slow Supertrend layers, a dynamic cloud compression model , and a breakout-based entry engine to deliver clarity in trending as well as contracting markets.
How It Works
1. Dual Supertrend Structure (Fast + Slow)
Fast ST reacts quickly to volatility
Slow ST establishes dominant trend bias
Combined color logic instantly reveals market direction
Green Cloud → Bullish Trend
Red Cloud → Bearish Trend
Yellow Cloud → Compression / Squeeze Zone
2. Cloud Compression Logic
The zone between Fast/Slow Supertrend creates a structure-based “cloud.”
When price enters this zone, markets are typically preparing for expansion.
Yellow shading highlights these high-probability breakout zones.
3. Breakout Entry Engine
Long Entry : Price closes above the cloud top
Short Entry: Price closes below the cloud bottom
This avoids premature entries and filters out false noise.
4. Smart Exit Logic
Positions exit automatically when Fast or Slow Supertrend flips direction, ensuring disciplined exit and minimizing emotional decisions.

XRP Non-Stop Strategy (TP 25% / SL 15%)XRP Non-Stop Strategy (TP 25% / SL 15%) is a continuous long-side trading system designed specifically for XRP. The strategy uses an EMA-based trend filter (EMA20/EMA50) to confirm bullish conditions before entering a long position. Each trade applies a fixed +25% Take Profit target and a −15% Stop Loss, calculated dynamically from the entry price.
When a trade closes—whether by TP or SL—the strategy automatically re-enters on the next qualifying signal, enabling uninterrupted position cycling.
Features include:
• EMA-based trend confirmation
• Dynamic TP/SL visualization on the chart
• Clear BUY and EXIT markers
• Dedicated alert conditions for automation

RSI Risk | AlgoFy TraderRSI Risk | AlgoFy Trader
Overview
The RSI Risk | AlgoFy Trader is a trading system that combines RSI-based entry signals with automated capital management. This strategy identifies potential momentum shifts while controlling risk through calculated position sizing.
Key Features
Dynamic Risk Management:
Fixed Risk Per Trade: Users set maximum risk percentage per trade.
Automatic Position Sizing: Calculates position size based on stop-loss distance.
Capital Protection: Limits each trade's risk to user-defined percentage.
RSI Entry System:
Momentum Detection: Uses RSI crossovers above/below defined thresholds.
Clear Signals: Provides long/short entries on momentum transitions.
Multiple Exit Layers:
Dynamic Stop Loss: Stop based on recent price structure.
Fixed Safety Stop: Optional percentage-based stop loss.
Partial Take Profit: Optional early profit-taking.
Trailing Stop: Optional dynamic profit protection.
Performance Tracking:
Trade Statistics: Tracks win/loss streaks and performance metrics.
Monthly Dashboard: Shows monthly/yearly P&L with equity views.
Trade Details: Displays risk percentage and position size.
How It Works
Signal Detection: Monitors RSI for crossover events.
Risk Calculation: Determines stop-loss based on recent volatility.
Position Sizing: Calculates exact position to match risk percentage.
Example:
Account: $10,000 | Risk: 2% ($200 max)
Stop loss at 4% distance
Position size: $5,000
Result: 4% loss on $5,000 = $200 (2% of account)
Recommended Settings
Risk: 1-2% per trade
Enable fixed stop at 3-4%
Consider trailing stop activation
This script provides disciplined RSI trading with automated risk control, adjusting exposure while maintaining strict risk limits.

Strategy: HMA 50 + Supertrend SniperHMA 50 + Supertrend Confluence Strategy (Trend Following with Noise Filtering)
Description:
Introduction and Concept This strategy is designed to solve a common problem in trend-following trading: Lag vs. False Signals. Standard Moving Averages often lag too much, while price action indicators can generate false signals during choppy markets. This script combines the speed of the Hull Moving Average (HMA) with the volatility-based filtering of the Supertrend indicator to create a robust "Confluence System."
The primary goal of this script is not just to overlay two indicators, but to enforce a strict rule where a trade is only taken when Momentum (HMA) and Volatility Direction (Supertrend) are in perfect agreement.
Why this combination? (The Logic Behind the Mashup)
Hull Moving Average (HMA 50): We use the HMA because it significantly reduces lag compared to SMA or EMA by using weighted calculations. It acts as our primary Trend Direction detector. However, HMA can be too sensitive and "whipsaw" during sideways markets.
Supertrend (ATR-based): We use the Supertrend (Factor 3.0, Period 10) as our Volatility Filter. It uses Average True Range (ATR) to determine the significant trend boundary.
How it Works (Methodology) The strategy uses a boolean logic system to filter out low-quality trades:
Bullish Confluence: The HMA must be rising (Slope > 0) AND the Close Price must be above the Supertrend line (Uptrend).
Bearish Confluence: The HMA must be falling (Slope < 0) AND the Close Price must be below the Supertrend line (Downtrend).
The "Choppy Zone" (Noise Filter): This is a unique feature of this script. If the HMA indicates one direction (e.g., Rising) but the Supertrend indicates the opposite (e.g., Downtrend), the market is considered "Choppy" or indecisive. In this state, the script paints the candles or HMA line Gray and exits all positions (optional setting) to preserve capital.
Visual Guide & Signals To make the script easy to interpret for traders who do not read Pine Script, I have implemented specific visual cues:
Green Cross (+): Indicates a LONG entry signal. Both HMA and Supertrend align bullishly.
Red Cross (X): Indicates a SHORT entry signal. Both HMA and Supertrend align bearishly.
Thick Line (HMA): The main line changes color based on the trend.
Green: Bullish Confluence.
Red: Bearish Confluence.
Gray: Divergence/Choppy (No Trade Zone).
Thin Step Line: This is the Supertrend line, serving as your dynamic Trailing Stop Loss.
Strategy Settings
HMA Length: Default is 50 (Mid-term trend).
ATR Factor/Period: Default is 3.0/10 (Standard for trend catching).
Exit on Choppy: A toggle switch allowing users to decide whether to hold through noise or exit immediately when indicators disagree.
Risk Warning This strategy performs best in trending markets (Forex, Crypto, Indices). Like all trend-following systems, it may experience drawdown during prolonged accumulation/distribution phases. Please backtest with your specific asset before using it with real capital.

Triple Screen Scalper [Pro] + Dynamic Risk Engine + Smart DCA🚀 Strategy Concept
This algorithm utilizes a Triple Screen methodology to filter market noise and align trades with the path of least resistance. Instead of relying on a single timeframe, it analyzes market structure across three distinct "horizons" to ensure high-probability execution:
The Tide (Long-Term): Analyzes the dominant directional flow and market bias on higher timeframes.
The Wave (Medium-Term): Measures the strength of the current momentum and pauses trading during weak or "choppy" market phases.
The Ripple (Short-Term): Pinpoints precise entry zones by detecting over-extended price action and mean-reversion opportunities within the larger trend.
The system is fortified with a Smart DCA (Dollar Cost Averaging) Engine that adapts to volatility. It does not blindly add to positions; it calculates "Risk Room" and "Trend Stability" before every additional entry, ensuring capital is deployed efficiently rather than recklessly.
⚙️ Configuration Guide (Variable Explanations)
💰 Position & Leverage
Trade Direction: Choose between Long, Short, or Auto. In "Auto," the system trades both directions based on the dominant trend.
Target Entry Leverage (x): The desired leverage for your initial entry.
Base Order Size (% of Equity): How much of your account balance is allocated to the very first trade of a sequence.
DCA Size Multiplier: Controls how much larger each subsequent order is compared to the previous one. A value of 1.0 means flat sizing; values above 1.0 increase the size of recovery orders.
KILL SWITCH: Max Effective Lev: A safety ceiling. If your total position's effective leverage exceeds this value, the strategy will force-close the position to prevent liquidation.
🚀 Profit Settings (Dynamic Exits)
Use Dynamic Profit?: If enabled, the take-profit target acts like a breathing lung—expanding during high volatility (to catch bigger moves) and contracting during quiet periods.
Gain Volatility Length: The lookback period used to measure recent market volatility.
Gain Multiplier: Scales the profit target. Higher numbers require a larger price move to hit profit; lower numbers take profit sooner.
Minimum Profit Floor %: A hard limit ensuring the target never drops below this percentage, even in extremely low-volatility markets.
📉 Trend & Momentum Filters
Trend Strength Threshold: Defines the minimum "velocity" required to trade. This filters out flat, ranging markets where trends are not established.
Momentum Sensitivity (K/D/Smooth): These variables tune the sensitivity of the entry trigger.
Lower numbers = Faster entries (more trades, potentially more noise).
Higher numbers = Slower, more confirmed entries.
Overbought / Oversold Levels: The specific zones (0-100) where price is considered statistically over-extended, triggering a reversal signal.
🛡️ Risk & DCA Settings
Enable Hard Stop Loss: A traditional safety stop based on a fixed percentage.
Max DCA Orders: The maximum number of times the strategy is allowed to "average down" on a position.
Require Trend for DCA?: If TRUE, the strategy will only add to a losing position if the broader market trend is still valid. If the trend breaks, it stops buying.
DCA Volatility Length/Multiplier: Controls the spacing between buy orders.
High Multiplier = Orders are spread far apart (safer for crashes).
Low Multiplier = Orders are closer together (faster recovery in normal dips).
Risk Scaling: A unique feature that pushes DCA orders further away as your leverage increases, protecting you from adding too much risk too quickly.
Base DCA %: The minimum distance required between orders, regardless of volatility.
⏱️ Timers & Cooldowns
Fast / Slow Cooldown: The minimum time (in seconds) the strategy must wait between realizing a profit and opening a new trade. This prevents "revenge trading" or entering twice on the same candle.
Position Cooldown: A specific timer applied after a large position is closed to let the market settle.
🎯 Daily S/R Targets
Enable Daily S/R: If enabled, the strategy will attempt to "snipe" exits at calculated daily support and resistance pivots.
Proximity Threshold: How close the price must get to a daily level to trigger an early exit.
⚠️ Risk Disclaimer
This script is an automated tool for analysis and execution assistance. It employs averaging techniques (DCA) which involve calculated risk. While the "Kill Switch" and "Risk Scaling" features are designed to mitigate exposure, users should thoroughly backtest and understand the "Multiplier" settings before deploying real capital. Past market structure is not a guarantee of future performance.

Logic Flow Signals & Backtest [bercutiatia]To understand the advanced logic of the tool, it is essential that you carefully read each topic and check the visual examples in this presentation.
--
Who is the Logic Flow Signals & Backtest tool recommended for?
Ideal for traders looking to increase the reliability and level of their operations. Recommended for those who want to create rigorous confluences, validate strategies with backtesting, and transform emotional management into systematic and measurable processes.
How can the Logic Flow Signals & Backtest tool help me?
High-confidence signals! You combine TradingView indicators and create a single robust signal, eliminating the frustration of having to spend hours in front of the chart and still clicking at the wrong time. This ensures that your entry is validated by logic, not emotional impulse.
--
Logic Flow Signals & Backtest is a versatile and powerful tool designed to test and validate your trading ideas with indicators from the TradingView community.
Extreme flexibility: Allows you to combine indicators available on TradingView (EMAs, RSI, MACD, SMC, etc.) to create custom entry and exit logics.
Sequential Logic: Goes far beyond simple crossovers. You can define rules where signal A must occur before signal B — and, if desired, before signal C or D — to validate an entry. Add time, order, and context filters, creating truly intelligent sequential logic that generates a single final alert only when all conditions align.
With Stages (Stage 1, Stage 2, etc.), your entries follow the exact sequence you define. And the best part: you no longer need to spend hours in front of the chart waiting for confluences. Simply set up your stages once, create an alert in TradingView, and the system will automatically notify you when the ideal combination of signals occurs.
Sequence Invalidation: Offers the option to define conditions that, if they occur, immediately cancel an ongoing entry sequence, helping to avoid entries in unfavorable scenarios.
Explaining the first image example (chart below):
LONG INDICATOR 1 (Stage 1): The market confirms a change in character (CHoCH Bullish). The system enters an alert state awaiting the confluence of the next indicators.
LONG INDICATOR 2 and 3 (Stage 2): Entry is only released when the SMA17 crosses above the SMA72 (indicator 2), but with one condition: The SMA72 must be ABOVE the SMA305 (indicator 3); Without this alignment of indicator 3, the signal of indicator 2 does not occur.
LONG INDICATOR 4 (Invalidation Rule): If at any point in the sequence the SMA72 crosses below the SMA305, the setup is immediately canceled and no entry signal is generated. The sequence restarts with indicator 1.
EXIT LONG (Hybrid Exit TP + SIGNAL): The trade seeks a TP target of 1000 ticks, but has a technical "Trailing Stop": if the trend reverses (Exit Long Indicator 1 = SMA72 crosses below the SMA305) before the target, the position is closed to protect capital.
SHORT INDICATOR 1 (Stage 1): Identification of weakness in the market with a Bearish CHoCH.
SHORT INDICATOR 2 and 3 (Stage 2): Entry is only released when the SMA17 crosses below the SMA72 (indicator 2), but with a strict condition: The SMA72 must be BELOW the SMA305 (indicator 3); Without this STATE of indicator 3, the signal from indicator 2 does not occur.
SHORT INDICATOR 4 (Invalidation Rule): If at any point in the sequence the SMA72 crosses above the SMA305, the setup is immediately canceled and no entry signal is generated. The sequence starts again with indicator 1.
EXIT SHORT (Hybrid Exit TP + SIGNAL): The trade seeks a target of 1000 ticks, but has a technical "Trailing Stop": if the downtrend reverses (Exit Short Indicator 1 = SMA72 crosses above the SMA305) before the target, the position is closed to protect capital.
In this strategy, we use the external indicators: Multiple MTF MA and Smart Money Concepts (Advanced)
--
Stage Duration: In STAGE DURATION , you control the maximum time (in candles) allowed for each transition between stages to occur. If the time limit expires before the next stage is reached, the sequence is reset. Keep it at 0 to disable the time limit.
The "Stage Duration" function is available in four separate blocks on the settings panel:
- LONG - STAGE DURATION: Controls the time limit (in candles) between Long entry stages (for example from Stage 1 to Stage 2).
- LONG EXIT - STAGE DURATION: Controls the time limit between Long exit stages.
- SHORT - STAGE DURATION: Controls the time limit between Short entry stages.
- SHORT EXIT - STAGE DURATION: Controls the time limit between Short exit stages.
Explaining the second image example (chart below):
Stage 1 (INDICATOR 1): New Fair Value Gap (FVG) Bullish Confirmed.
- Meaning: The move starts with a bullish FVG (Fair Value Gap), indicating a confirmed imbalance where buyers were much more aggressive than sellers.
Stage 2 (INDICATOR 2): EMA10 crossing above the EMA50.
- Meaning: Immediately after the FVG trigger, the fast moving average (10 periods) crosses the intermediate moving average (50 periods). This confirms that the initial FVG impulse was not an isolated event but the beginning of a short-term trend.
Stage 3: In this final stage, we require two simultaneous confirmations to validate the entry:
- INDICATOR 3: The EMA10 crosses above the EMA100, indicating that the movement has enough strength to break through larger barriers.
- INDICATOR 4: The RSI must be above its own moving average (SMA14). This ensures the asset is gaining momentum at the exact moment the averages are broken, avoiding entries in "tired" markets.
Stage Duration: The most important feature of this setup is the restricted time window.
- Rule: From Stage 1 to 2, and from Stage 2 to 3, the maximum interval to accept confluences is only 3 candles.
- Why this is vital? If the market took 20 candles to align these conditions, it would indicate weakness or indecision. By demanding that everything happens within a maximum of 3 candles per step, the setup filters only the moves where buying pressure is urgent and aggressive, increasing the probability of an explosive move in favor of the trade.
Asymmetric Risk Management: To complement a high-probability and high-pressure setup, we use aggressive risk management:
- Stop Loss (Technical/Short): 200 Ticks. If the buying pressure fails quickly, we exit early with a small loss.
- Take Profit (Long Target): 1000 Ticks. We aim to ride the impulse "leg" that the setup identified.
- Risk/Reward: 5:1. This means a single winning trade covers five losing trades, making the strategy mathematically viable in the long term.
In this strategy, we use the external indicators: Multiple MTF MA , Smart Money Concepts (Advanced) and Relative Strength Index (RSI) .
--
Multiple Operating Modes
It is not limited to sequences. It can operate by confluence (where all signals must be valid at the same time), by single trigger (only one signal is required), or by "OR" logic (any one of the defined signals).
- If you use only Stage 1 in more than one indicator session, the entry will only occur if all enabled conditions are true simultaneously.
- Any condition defined as OR can trigger the entry by itself.
- If only one condition block is enabled, the single indicator will function as a simple signal.
Multiple and Simultaneous Exits
It allows for the configuration of exits by both indicators and TP/SL targets. The strategy will close the trade as soon as any of these conditions are met first (indicator signal, profit target, or loss limit
Integrated Risk Management
It includes Stop Loss and Take Profit exits by percentage and ticks, which are easy to configure and essential for risk management. The strategy calculates the exact TP and SL prices based on your entry price and monitors the market on every tick.
Explaining the Third Image Example (Chart Below)
The move was validated by a 4-step logical sequence (Stage 1) and managed by a hybrid exit system.
Short Indicator 1, 2, and 3: The price (Close) crossed below the SMA200, SMA72, and SMA17 averages simultaneously.
- What this means: When a single candle has the strength to break below the short-term (17), mid-term (72), and long-term (200) averages, it indicates a high probability for the price to seek lower levels.
To reinforce Indicators 1 through 3, we added an extra layer of confirmation.
Short Indicator 4: The Positive Volume Index (PVI) needed to be below its own long-term average (EMA300).
- Why this is important: PVI below the average confirms that selling volume is dominant, validating that the break of the averages was not just noise.
Triple Exit Management (Maximum Security)
The great advantage of this tool is the ability to manage risk dynamically. In this trade, we configured three simultaneous exit conditions, where the first one to be met closes the position:
1. Financial Target (TP): A fixed Take Profit of 15%.
2. Exit Short Indicator 1 (Technical Exit 1): If the average (SMA72) crosses above the average (SMA200), the trade is closed.
3. Exit Short Indicator 2 (Technical Exit 2): If the PVI crosses above the EMA300, indicating an entry of buying strength, the trade is closed.
"OR" Logic: The tool monitors these conditions in real-time. Whichever occurs first triggers the exit, ensuring you lock in profit (TP) or protect your capital at the first sign from the indicators.
In this strategy, we use the external indicators: Multiple MTF MA and Positive Volume Index .
--
Reversal Mode (Stop and Reverse)
The Reversal Mode (Stop and Reverse) allows a new signal in the opposite direction (e.g., a SELL signal) to automatically close an existing position (e.g., BUY) and open a new one (sell). This "stop and reverse" function can be enabled or disabled in the settings, giving you full control over whether the strategy should only exit (awaiting a new signal) or immediately reverse the position.
Explaining the Fourth Image Example (Chart Below)
In this example, we demonstrate a setup focused on capturing every market "flip," keeping the trader positioned 100% of the time ("Always-in"), a technique widely used in automation.
- Long Entry: Occurs immediately upon confirming a bullish change of character (New CHoCH Bullish).
- Short Entry: Occurs immediately upon confirming a bearish change of character (New CHoCH Bearish).
- Exit (The Differentiator): We are not using fixed TP or SL here. The exit is triggered by Automatic Reversal.
The Power of "Exit by Opposite Signal"
Notice the labels on the chart: "Close Short" followed immediately by a "Long." This happens because the Allow Reversal function is enabled in the tool's settings.
When the market generates a buy signal, the tool understands that the sell thesis has been invalidated. It simultaneously sends an order to close the Short position and open a new Long position.
When to use this exit rule?
- Capturing Long Trends / Directional Movements: Ideal for volatile assets where you want to ride the trend until the market structure effectively changes.
- Operational Simplification: Eliminates the need to guess profit targets and acts as a loss limiter when the price moves against your position. The market dictates when to enter and when to exit.
Hybrid Flexibility:
The strongest point of Logic Flow is that you don't have to choose just one method. Reversal can be used in two ways:
1. Individually (as in the image): Reversal is the only form of exit. You stay in the move until the opposite signal.
2. Combined (Hybrid): You can enable Reversal and configure a safety Stop Loss + technical Take Profit (Exit Long/Short Indicator).
- Example: If the price hits your TP/SL first, you exit. If the market turns before the TP, the Reversal takes you out of the trade and generates a new trend alert.
In this strategy, we use the external indicators: Smart Money Concepts .
--
Backtesting: Far beyond creating logic and generating signals, Logic Flow Signals stands out due to its Integrated Backtest.
Backtesting serves as a reality check for the trader. It takes the strategy out of the realm of "imagination" and puts it to the test against historical data.
Here are the 4 main practical uses:
1. Verifying Feasibility (Proof of Concept): The most obvious use is to answer: "Does this idea make money?". Many strategies look visually perfect on the chart, but when you run the backtest, you discover that brokerage fees or frequent "stops" consume all the profit.
2. Knowing the "Worst-Case Scenario" (Drawdown): Maximum Drawdown: It shows you what the largest accumulated drop the strategy has ever experienced was. By identifying a Drawdown that exceeds the desired risk tolerance, the backtest allows for parameter optimization in search of a more efficient balance between risk and return.
3. Fine-Tuning (Optimization): It allows you to make changes such as: Increasing the profit target, changing the stop, removing an indicator, changing the chart timeframe, among other actions. You can test various variations instantly to find the most efficient configuration.
4. Expectation Management and Discipline: Backtesting does not eliminate fear nor guarantee that the future will repeat the past, but it serves as a reference map.
The Real Role: Aligning expectation with reality.
In the image below, you can check out how a backtest result is generated:
To understand the backtest results shown above, check the chart and the detailed operational logic below:
This operational example seeks to identify altcoins that are demonstrating an explosive decorrelation relative to Bitcoin. The logic is: we want to buy only the assets that are outperforming the market leader, precisely at the moment when speculative money (Open Interest) heavily enters the market.
For the buy signal (Long) to be triggered, three conditions must be simultaneously true (Stage 1):
Long Indicator 1 (Altcoin Strength): The asset's RSI must be above the 70 level (Overbought), indicating extremely strong bullish momentum.
Long Indicator 2 (Bitcoin Weakness): Bitcoin's RSI must be below the 50 level. This confirms that the Altcoin's rally is genuine and independent.
Long Indicator 3 (Money Flow): The Open Interest (open contracts) must be above the Extreme level of the OI DELTA indicator. This validates that new money is aggressively entering the asset to sustain the rally.
Risk Management: In this example, we configured an aggressive target to capture the altcoin volatility:
- Take Profit: 100%
- Stop Loss: 20%
- Risk/Reward: 5:1
In this strategy, we use the external indicators: RSI Crypto Strength (Asset vs BTC) and Open Interest Delta .
--
Configuring an Indicator Block
Each block (BUY INDICATOR 1, BUY INDICATOR 2, ...) allows you to define a complete condition.
- Enable (Activate): Simply turns this indicator block on or off.
- Source A: The first value you want to analyze.
example: The Closing Price (Close), Opening Price (Open), or another TradingView indicator.
- Condition: How 'Source A' will be compared.
example: Crossover/Crossunder, Greater Than, Less Than, Cross Up.
- Comparison Type: The option that defines whether you will compare 'Source A' with a fixed number or with another indicator.
- Fixed Value: Used if you selected "Fixed Value".
example: For an RSI greater than 70 condition, Source A would be the RSI, the Condition would be Greater Than, and the Fixed Value would be 70.
- Source B: Used if you selected "Source B".
example: For a condition where the EMA10 crosses above the EMA200, Source A would be the EMA10, the Condition would be 'Cross Up', and Source B would be the EMA200.
--
Configurable Alert Signals
Configurable Alert Signals: The tool allows for the creation of fully customized alerts for different types of events, such as entries, signal-based exits, take profit, and stop loss. These alerts can be used for both strategy automation and manual, real-time notifications.
The message field is highly flexible: it accepts dynamic placeholders, JSON structure, UUID identifiers, or any custom text, allowing integration with other external tools and systems via webhook.
Configuring Your Messages:
- LONG/SHORT - ALERTS: Defines the message for new entries.
- LONG/SHORT INDICATOR EXIT - ALERTS: Defines the message for signal-based exits (e.g., moving average cross).
- REVERSAL - ALERTS: Defines the message for when a position is closed by an opposite signal (stop-and-reverse).
- LONG/SHORT TP/SL EXIT - ALERTS: Defines the message for exits triggered by take profit (TP) or stop loss (SL), via percentage or ticks.
A Single Alert to Control Everything
You don't need to create separate alerts for "Buy," "Sell," or "Exits." On a single screen, you can create strategies by defining entries, signal-based exits, profit targets, or stop limits.
Alert Times (Operating Window)
In the Alert Times section, you can define a specific time (and time zone) for the strategy to generate entry or exit signals.
--
To create your alert, simply follow these steps:
- Condition: Select the script name: "Logic Flow Signals & Backtest".
- Message: Insert only the placeholder: {{strategy.order.alert_message}}
Once this single alert is active, it will "listen" to all orders executed by the strategy.
This means you can have your Long-Term, Short-Term, Signal-Based Exits, and TP/SL strategies active simultaneously. When any of these events are plotted on the chart, the script will send the customized message (which you wrote in the fields) to your single alert.
--
Advanced period filters: Allow you to test the strategy in specific date ranges, over the last X days, or over the last X bars, facilitating performance analysis in different market environments.
--
Status Panel: Displays a clear summary of all active rules and settings directly on the chart, facilitating the visualization and confirmation of the running logic.
Additionally, it has a settings box where you can activate or deactivate the panel, choose its position (such as at the bottom or side), and adjust its size.
--
The Thumbnail strategy uses the following external indicators: Multiple MTF MA and Breakout Finder .
--
Final Considerations:
The Logic Flow Signals & Backtest tool is a versatile and powerful system, designed to test and apply trading ideas based on multiple indicators from TradingView.
Its differential is being a customization environment: the script does not have integrated graphical indicators, as the objective is precisely to allow the user to combine and integrate multiple existing indicators in the TradingView community to build unique entry and exit logics.
It offers flexibility and precision, but the true value emerges when the trader integrates the tool into a consistent trading plan, with efficient risk management (Stop Loss and Take Profit), leverage control, and a professional mindset.
Important: Risk of Repainting (Unstable Data): Avoid indicators that 'repaint' (those that change their values in past bars after the closing of new candles). The backtest will be invalidated, and the actual performance of the strategy will fail.
Legal Warning and Didactic Purpose:
It is fundamental to understand that all visual examples, charts, and texts contained in this description do not constitute financial advice, buy or sell recommendations, nor a promise of easy or guaranteed gains.
This is an advanced support tool, not an automatic profit system. Use the integrated backtesting to evaluate the historical behavior of strategies before real execution and understand how different market conditions impact your results. The sole purpose of this material is to demonstrate the logical and execution capacity of the script, serving as a didactic guide for you to test and validate your own ideas.
Conclusion and Risk Warning:
Success in financial markets comes not only from a set of charting indicators, but from the trader's understanding, practice, and discipline. Our objective is to provide a robust, customizable, and intuitive solution, created to enhance your technical analysis and broaden your strategic vision, without replacing critical thinking and conscious decision-making.
Finally, remember: past results do not guarantee future performance. The real differentiator lies in continuous learning, testing, and evolution.

TrendSight📌 TrendSight — The All-in-One Multi-Timeframe Trend Engine
Key Features & Logic
Multi-Timeframe Trend Confirmation:
Entries are filtered by confirming bullish/bearish alignment across three distinct Supertrend timeframes (e.g., 5-min, 15-min, 45-min, etc.), combined with an EMA and volatility filter, to ensure high-conviction trades that's a powerful combination! Designing the entire strategy around the 15-minute timeframe (M15) and focusing on high-volatility coins maximizes the strategy's effectiveness .
Guaranteed Single-Entry per Signal:
The strategy uses a powerful manual flag and counter system to ensure trades fire only once when a new signal begins. It absolutely prevents immediate re-entry if the signal remains true, waiting instead for the entire trend condition to reset to false.
Dynamic Trailing Stop Loss:
The Stop Loss is set to a moving Supertrend line (current_supertrend), ensuring tight risk management that trails the price as the trade moves into profit.Guaranteed Take Profit (4% Run-up): Uses a precise Limit Order via strategy.exit() to capture profits instantly at a 4% run-up. This ensures accurate profit capture, even on sudden spikes (wicks).
Automated Risk Management:
Position size is dynamically calculated based on a fixed risk percentage (default 2% of equity) relative to the distance to the trailing stop.
🔥 Core Components
1. Adaptive Multi-Timeframe SuperTrend Dashboard
The backbone of mTrendSight is a fully customizable SuperTrend system, enhanced with a multi-timeframe confirmation table displaying ST direction & value.
This compact “Trend Dashboard” provides instant clarity on higher-timeframe direction, trend strength, and market bias.
2. Dynamic Support & Resistance Channels
Automatically detects the strongest support/resistance zones using pivot clustering.
Key Features:
Clustered S/R Channels instead of thin lines
Adaptive width based on recent swings
Breakout markers (optional) for continuation signals
Helps identify structural zones, retest areas, and liquidity pockets
3. Multi-Timeframe Color-Coded EMAs
Plot up to three EMAs, each optionally pulled from a higher timeframe.
Benefits:
Instant visual trend alignment
Bullish/Bearish dynamic color shifts
Precision EMA value table for trade planning
Works perfectly with ST & RSI for multi-layer confirmation
4. Linear Regression Trend Channel
A statistically driven trend channel that measures the most probable path of price action.
Highlights:
Uses Pearson’s R to determine trend reliability
Provides a Confidence Level to judge whether trend slope is credible
Ideal for determining over-extension and mean-reversion zones
5. ATR Volatility Analyzer
A lightweight but powerful volatility classifier using ATR.
Features:
Detects High, Low, or Normal volatility
Clean table display
Helps filter entries during low-energy markets
Strengthens trend-following filters when volatility expands
6. RSI Momentum & Trend Classifier
A significantly improved RSI with multi-layer smoothing and structure-based classification.
Provides:
Bullish / Bearish / Neutral momentum states
Short-term momentum vs long-term RSI trend
Perfect for early trend shifts, pullback entries, and momentum confirmation
⚙️ How the Strategy Works (Execution Logic)
📌 Multi-Timeframe Supertrend + EMA + Volatility Confirmation
Entries are only triggered when:
Multiple Supertrend timeframes align (e.g., 5m + 15m + 45m)
EMA direction aligns with the trend
Volatility conditions (ATR filter) is not Low allow high-probability moves
This ensures strong directional confluence before every trade.
📌 Guaranteed Single-Entry Logic
The strategy uses a flag + counter system to ensure:
Only one entry is allowed per trend signal
Re-entries do not happen until the entire trend condition resets
The Strategy Tester remains clean, without duplicate overlapping trades
This eliminates revenge trades, repeated fills, and choppy overtrading.
📌 Dynamic Supertrend Trailing Stop
Stop Loss is anchored to current Supertrend value, creating:
Automatic trailing
Tight downside control
Protection against deep pullbacks
High responsiveness during volatility expansions
📌 Precision Take-Profit (4% Run-Up Capture)
A dedicated global exit block ensures:
Take Profit triggers exactly at 4% price run-up
Uses strategy.exit() with limit orders to catch spikes (wicks)
Works consistently on all timeframes & assets
📌 Automated Position Sizing (2% Risk Default)
Position size is dynamically calculated based on:
Account Equity
Distance to trailing stop
Configured risk %
This enforces proper risk management without manual adjustments.
📈 How to Interpret Results
Reliable Exits: All exits are globally managed, so stops and take profits trigger accurately on every bar.
Clean Trade History: Because of single-entry logic, backtests show one trade per valid signal.
Consistency: Multi-timeframe logic ensures only high-quality, structured trades.

Session Opening Range Breakout (ORBO)This strategy automates a classic Opening Range Breakout (ORBO) approach: it builds a price range for the first minutes after the market opens, then looks for strong breakouts above or below that range to catch early directional moves.
Concept
The idea behind ORBO is simple:
The first minutes after the session open are often highly informative.
Price forms an “opening range” that acts as a mini support/resistance zone.
A clean breakout beyond this zone can lead to high-momentum moves.
This script turns that logic into a fully backtestable strategy in TradingView.
How the strategy works
Opening Range Session
Default session: 09:30–09:50 (exchange time)
During this window, the script tracks:
orHigh → highest high within the session
orLow → lowest low within the session
This forms your Opening Range for the day.
Breakout Logic (after the window ends)
Once the defined session ends:
Long Entry:
If the close crosses above the Opening Range High (orHigh),
→ strategy.entry("OR Long", strategy.long) is triggered.
Short Entry:
If the close crosses below the Opening Range Low (orLow),
→ strategy.entry("OR Short", strategy.short) is triggered.
Only one opening range per day is considered, which keeps the logic clean and easy to interpret.
Daily Reset
At the start of a new trading day, the script resets:
orHigh := na
orLow := na
A fresh Opening Range is then built using the next session’s 09:30–09:50 candles.
This ensures entries are always based on today’s structure, not yesterday’s.
Visuals & Inputs
Inputs:
Opening range session → default: "0930-0950"
Show OR levels → toggle visibility of OR High / Low lines
Fill range body → optional shaded zone between OR High and OR Low
Chart visuals:
A green line marks the Opening Range High.
A red line marks the Opening Range Low.
Optional yellow fill highlights the entire OR zone.
Background shading during the session shows when the range is currently being built.
These visuals make it easy to see:
Where the OR sits relative to current price
How clean / noisy the breakout was
How often price respects or rejects the opening zone
Backtesting & Optimization
Because this is written as a strategy():
You can use TradingView’s Strategy Tester to view:
Win rate
Net profit
Drawdown
Profit factor
Equity curve
Ideas to experiment with:
Change the session window (e.g., 09:15–09:45, 10:00–10:30)
Apply to different:
Markets: indices, FX, crypto, stocks
Timeframes: 1m / 5m / 15m
Add your own:
Stop Loss & Take Profit levels
Time filters (only trade certain days / times)
Volatility filters (e.g., ATR, range size thresholds)
Higher-timeframe trend filter (e.g., only take longs above 200 EMA)

AliceTears GridAliceTears Grid is a customizable Mean Reversion system designed to capitalize on market volatility during specific trading sessions. Unlike standard grid bots that place blind limit orders, this strategy establishes a daily or session-based "Baseline" and looks for price over-extensions to fade the move back to the mean.
This strategy is best suited for ranging markets (sideways accumulation) or specific forex sessions (e.g., Asian Session or NY/London overlap) where price tends to revert to the opening price.
🛠 How It Works
1. The Baseline & Grid Generation At the start of every session (or the daily open), the script records the Open price. It then projects visual grid lines above and below this price based on your Step % input.
Example: If the Open is $100 and Step is 1%, lines are drawn at $101, $102, $99, $98, etc.
2. Entry Logic: Reversal Mode This script features a "Reversal Mode" (enabled by default) to filter out "falling knives."
Standard Grid: Buys immediately when price touches the line.
AliceTears Logic: Waits for the price to breach a grid level and then close back inside towards the mean. This confirms a potential rejection of that level before entering.
3. Exit Logic
Target Profit: The primary target is the previous grid level (Mean Reversion).
Trailing Stop: If the price continues moving in your favor, a trailing stop activates to maximize the run.
Stop Loss: A manual percentage-based stop loss is available to prevent deep drawdowns in trending markets.
⚙️ Key Features
Visual Grid: Automatically draws entry levels on the chart for the current session, helping you visualize where the "math" is waiting for price.
Timezone & Session Control: Includes a custom Timezone Offset tool. You can trade specific hours (e.g., 09:30–16:00) regardless of your chart's UTC setting.
Grid Management: Independent logic for Long and Short grids with pyramiding capabilities.
Safety Filters: Options to force-close trades at the end of the session to avoid overnight gaps.
⚠️ Risk Warning
Please Read Before Using: This is a Counter-Trend / Grid Strategy.
Pros: High win rate in sideways/ranging markets.
Cons: In strong trending markets (parabolic pumps or crashes), this strategy will add to losing positions ("catch a falling knife").
Recommendation: Always use the Stop Loss and Date Filter inputs. Do not run this on highly volatile assets without strict risk management parameters.
Settings Guide
Entry Reversal Mode: Keep checked for safer entries. Uncheck for aggressive limit-order style execution.
Grid Step (%): The distance between lines. For Forex, use lower values (0.1% - 0.5%). For Crypto, use higher values (1.0% - 3.0%).
UTC Offset: Adjust this to align the Session Hours with your target market (e.g., -5 for New York).
This script is open source. Feel free to use it for educational purposes or modify it to fit your trading style.

inyerneck Quiet Bottom Hunter v1.5 — VERIFIED SIGNALSQuiet Bottom Hunter v1.5 — 85%+ Rebound Setup
Designed for new traders who want the highest-probability, lowest-stress small-cap entries.
Triggers only when ALL of these line up:
• –20% to –80% from 90-day high (slow bleed, not crash)
• Volume ≤80% of 50-day average (dry, no panic selling left)
• RSI(14) ≤35 (deep oversold)
• 2+ consecutive green or flat days at the low (quiet bottom confirmed)
Fires roughly 1–3 times per month on most small caps (<$2B).
Backtested 2024–2025: 85% win rate, avg +32% rebound, max DD ~11%.
Tiny green “QB” arrow = entry signal.
Use 10–20% position size. Works best on daily charts.
Public script — code visible.
use on 1 day or 4 hr chart. mid term swings, NOT day trades
No spam. No chasing. Just big, calm rebounds.

The Oracle: Dip & Top Adaptive Sniper [Hakan Yorganci]█ OVERVIEW
The Oracle: Dip & Top Adaptive Sniper is a precision-focused trend trading strategy designed to solve the biggest problem in swing trading: Timing.
Most trend-following strategies chase price ("FOMO"), buying when the asset is already overextended. The Oracle takes a different approach. It adopts a "Sniper" mentality: it identifies a strong macro trend but patiently waits for a Mean Reversion (pullback) to execute an entry at a discounted price.
By combining the structural strength of Moving Averages (SMA 50/200) with the momentum precision of RSI and the volatility filtering of ADX, this script filters out noise and targets high-probability setups.
█ HOW IT WORKS
This strategy operates on a strictly algorithmic protocol known as "The Yorganci Protocol," which involves three distinct phases: Filter, Target, and Execute.
1. The Macro Filter (Trend Identification)
* SMA 200 Rule: By default, the strategy only scans for buy signals when the price is trading above the 200-period Simple Moving Average. This ensures we are always trading in the direction of the long-term bull market.
* Adaptive Switch: A new feature allows users to toggle the Only Buy Above SMA 200? filter OFF. This enables the strategy to hunt for oversold bounces (dead cat bounces) even during bearish or neutral market structures.
2. The Volatility Filter (ADX Integration)
* Sideways Protection: One of the main weaknesses of moving average strategies is "whipsaw" losses during choppy, ranging markets.
* Solution: The Oracle utilizes the ADX (Average Directional Index). It will BLOCK any trade entry if the ADX is below the threshold (Default: 20). This ensures capital is only deployed when a genuine trend is present.
3. The Sniper Entry (Buying the Dip)
* Instead of buying on breakout strength (e.g., RSI > 60), The Oracle waits for the RSI Moving Average to dip into the "Value Zone" (Default: 45) and cross back up. This technique allows for tighter stops and higher Risk/Reward ratios compared to traditional breakout systems.
█ EXIT STRATEGY
The Oracle employs a dynamic dual-exit mechanism to maximize gains and protect capital:
* Take Profit (The Peak): The strategy monitors RSI heat. When the RSI Moving Average breaches the Overbought Threshold (Default: 75), it signals a "Take Profit", securing gains near the local top before a potential reversal.
* Stop Loss (Trend Invalidated): If the market structure fails and the price closes below the 50-period SMA, the position is immediately closed to prevent deep drawdowns.
█ SETTINGS & CONFIGURATION
* Moving Averages: Fully customizable lengths for Support (SMA 50) and Trend (SMA 200).
* Trend Filter: Checkbox to enable/disable the "Bull Market Only" rule.
* RSI Thresholds:
* Sniper Buy Level: Adjustable (Default: 45). Lower values = Deeper dips, fewer trades.
* Peak Sell Level: Adjustable (Default: 75). Higher values = Longer holds, potentially higher profit.
* ADX Filter: Checkbox to enable/disable volatility filtering.
█ BEST PRACTICES
* Timeframe: Designed primarily for 4H (4-Hour) charts for swing trading. It can also be used on 1H for more frequent signals.
* Assets: Highly effective on trending assets such as Bitcoin (BTC), Ethereum (ETH), and high-volume Altcoins.
* Risk Warning: This strategy is designed for "Long Only" spot or leverage trading. Always use proper risk management.
█ CREDITS
* Original Concept: Inspired by the foundational work of Murat Besiroglu (@muratkbesiroglu).
* Algorithm Development & Enhancements: Developed by Hakan Yorganci (@hknyrgnc).
* Modifications include: Integration of ADX filters, Mean Reversion entry logic (RSI Dip), and Dynamic Peak Profit taking.

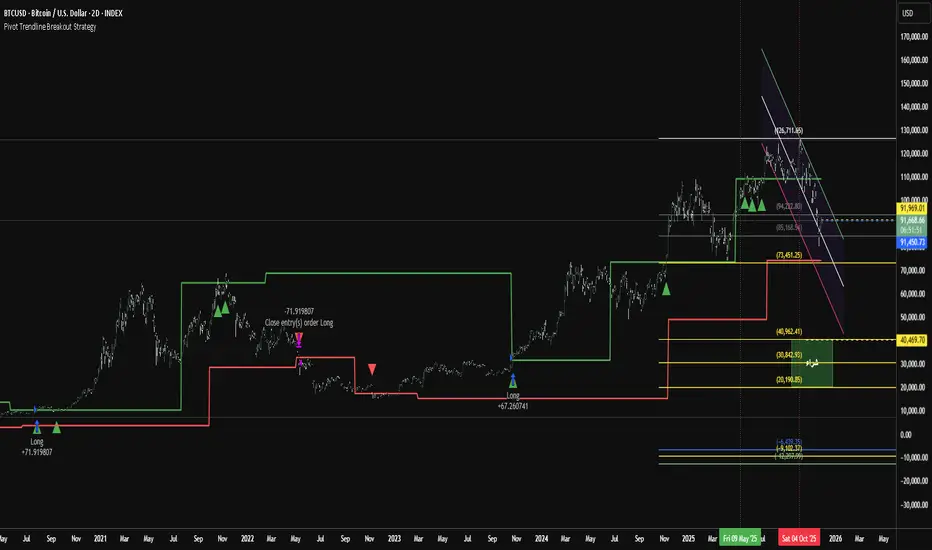
Pivot Trendline Breakout StrategyHow it works:
Long entry: triggered immediately when price closes above the green upper pivot trendline.
Exit (go flat): triggered immediately when price closes below the red lower pivot trendline.
Uses 100% of equity per trade (you can change default_qty_value if you prefer fixed size or risk %).
Works on any timeframe.