Linear Cross Trading StrategyLinear Cross Trading Strategy
The Linear Cross trading strategy is a technical analysis strategy that uses linear regression to predict the future price of a stock. The strategy is based on the following principles:
The price of a stock tends to follow a linear trend over time.
The slope of the linear trend can be used to predict the future price of the stock.
The strategy enters a long position when the predicted price crosses above the current price, and exits the position when the predicted price crosses below the current price.
The Linear Cross trading strategy is implemented in the TradingView Pine script below. The script first calculates the linear regression of the stock price over a specified period of time. The script then plots the predicted price and the current price on the chart. The script also defines two signals:
Long signal: The long signal is triggered when the predicted price crosses above the current price.
Short signal: The short signal is triggered when the predicted price crosses below the current price.
The script enters a long position when the long signal is triggered and exits the position when the short signal is triggered.
Here is a more detailed explanation of the steps involved in the Linear Cross trading strategy:
Calculate the linear regression of the stock price over a specified period of time.
Plot the predicted price and the current price on the chart.
Define two signals: the long signal and the short signal.
Enter a long position when the long signal is triggered.
Exit the long position when the short signal is triggered.
The Linear Cross trading strategy is a simple and effective way to trade stocks. However, it is important to note that no trading strategy is guaranteed to be profitable. It is always important to do your own research and backtest the strategy before using it to trade real money.
Here are some additional things to keep in mind when using the Linear Cross trading strategy:
The length of the linear regression period is a key parameter that affects the performance of the strategy. A longer period will smooth out the noise in the price data, but it will also make the strategy less responsive to changes in the price.
The strategy is more likely to generate profitable trades when the stock price is trending. However, the strategy can also generate profitable trades in ranging markets.
The strategy is not immune to losses. It is important to use risk management techniques to protect your capital when using the strategy.
I hope this blog post helps you understand the Linear Cross trading strategy better. Booost and share with your friend, if you like.
Análise de Tendência

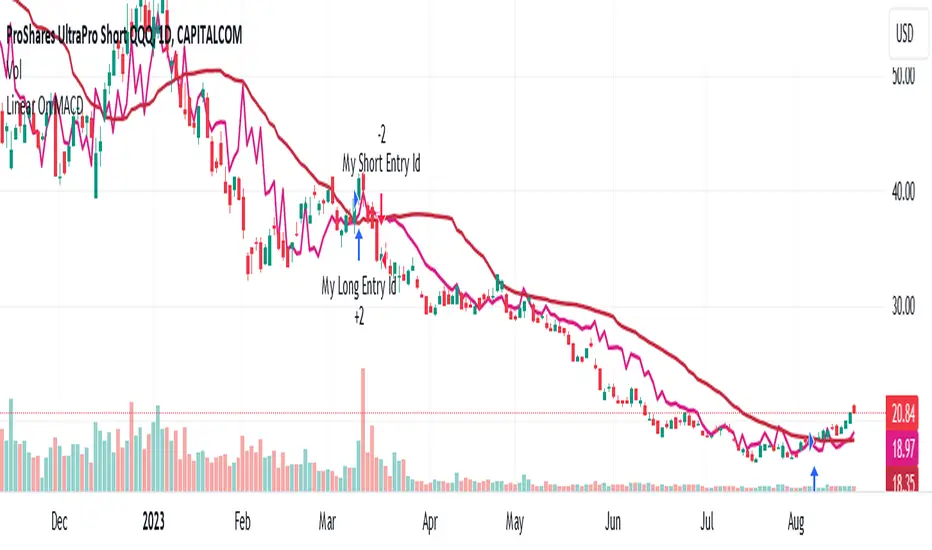
Linear On MACDUnlocking the Magic of Linear Regression in TradingView
In the ever-evolving world of financial markets, traders and investors seek effective tools to gauge price movements, make informed decisions, and achieve their financial goals. One such tool that has proven its worth over time is linear regression, a mathematical concept that has found its way into technical analysis and trading strategies. In this blog post, we will explore the magic behind linear regression, delve into its history, and understand how it's widely used as a technical indicator.
The Birth of Linear Regression: From Mathematics to Trading
Linear regression is a statistical method that aims to model the relationship between two variables by fitting a linear equation to observed data. The formula for a linear regression line is typically expressed as y = a + bx, where y is the dependent variable, x is the independent variable, a is the intercept, and b is the slope.
While the roots of linear regression trace back to the field of statistics, it didn't take long for traders and investors to recognize its potential in the financial world. By applying linear regression to historical price data, traders can identify trends, assess the relationship between variables, and even predict potential future price levels.
The Linear On MACD Strategy
Let's take a closer look at a powerful example of how linear regression is employed in a trading strategy right within TradingView. The "Linear On MACD" strategy harnesses the potential of linear regression in conjunction with the Moving Average Convergence Divergence (MACD) indicator. The goal of this strategy is to generate buy and sell signals based on the interactions between the predicted stock price and the MACD indicator.
Here's a breakdown of the strategy's components:
Calculation of Linear Regression: The strategy begins by calculating linear regression coefficients for the historical stock price based on volume. This helps predict potential future price levels.
Predicted Stock Price: The linear regression results are then used to plot the predicted stock price on the chart. This provides a visual representation of where the price could trend based on historical data.
Buy and Sell Signals: The strategy generates buy signals when certain conditions are met. These conditions include the predicted stock price being between the open and close prices, a rising MACD, and other factors that suggest a potential bullish trend. On the other hand, sell signals are generated based on MACD trends and predicted price levels.
Risk Management: The strategy also incorporates risk tolerance levels to determine entry and exit points. This ensures that traders take into account their risk appetite when making trading decisions.
Embracing the Magic of Linear Regression
As we explore the "Linear On MACD" strategy, we uncover the power of linear regression in aiding traders and investors. Linear regression, a mathematical marvel, seamlessly merges with technical analysis to provide insights into potential price movements. Its historical significance in statistics blends perfectly with the demands of modern financial markets.
Whether you're a seasoned trader or a curious investor, the Linear On MACD strategy exemplifies how a robust mathematical concept can be harnessed to make informed trading decisions. By embracing the magic of linear regression, you're tapping into a tool that continues to evolve alongside the financial world it empowers.
Disclaimer: The information provided in this blog post is for educational purposes only and does not constitute financial advice. Trading and investing carry risks, and it's important to conduct thorough research and consider seeking professional advice before making any trading decisions.
Pivot Point SuperTrend Strategy +TrendFilterIn the dynamic world of financial markets, traders are always on the lookout for innovative strategies to identify trends and make timely trades. The "Pivot Point SuperTrend strategy +TrendFilter" has emerged as an intriguing approach, combining two popular indicators - Pivot Points and SuperTrend, while introducing an additional trend filter for added precision. This strategy draws inspiration from Lonesome TheBlue's "Pivot Point SuperTrend" script, aiming to provide traders with a reliable tool for trend following while minimizing false signals.
The Core Concept:
The strategy's foundation lies in the fusion of Pivot Points and SuperTrend indicators, and the addition of a robust trend filter. It begins by calculating Pivot Highs and Lows over a specified period, serving as crucial reference points for trend analysis. Through a weighted average calculation, these Pivot Points create a center line, refining the overall indicator.
Next, based on the center line and the Average True Range (ATR) with a user-defined Factor, upper and lower bands are generated. These bands adapt to market volatility, adding flexibility to the strategy. The heart of the "Pivot Point SuperTrend" strategy lies in accurately identifying the prevailing trend, with the indicator smoothly transitioning between bullish and bearish signals as the price interacts with the SuperTrend bands.
The additional trend filter introduced into the strategy further enhances its capabilities. This filter is based on a moving average, providing a dynamic assessment of the trend's strength and direction. By combining this trend filter with the original Pivot Point SuperTrend signals, the strategy aims to make more informed and reliable trading decisions.
Advantages of "Pivot Point SuperTrend" with Trend Filter:
1. Enhanced Precision: The incorporation of a trend filter improves the strategy's accuracy by confirming the overall trend direction before generating signals.
2. Trend Continuation: The integration of Pivot Points and SuperTrend, along with the trend filter, aims to prolong trades during strong market trends, potentially maximizing profit opportunities.
3. Reduced Whipsaws: The strategy's weighted average calculation, coupled with the trend filter, helps minimize false signals and reduces whipsaws during uncertain or sideways market conditions.
4. Support and Resistance Insights: The strategy continues to provide additional support and resistance levels based on the Pivot Points, offering valuable contextual information to traders.

Pineconnector Strategy TemplateHello traders
After getting five requests in a raw to convert an indicator into a backtest strategy with statistics + Metatrader MT4/MT5 bot using Pineconnector, I decided to publish this TradingView strategy plug-and-play template automatically generating the Pineconnector alerts for you.
Trial
A 4-day FREE TRIAL is available upon request.
I'll help you with the Expert Advisor configuration on Metatrader if needed.
Features
✅ Easily convert your TradingView Indicators into a Strategy with automatically generated alerts using the Pineconnector syntax.
Non-coders don't know how to send the entry price/SL/TP/etc information from TradingView to Pineconnector.
I made that automatic - the alert messages are automatically generated with the correct syntax based on the selected broker connected to your Metatrader.
For example, the OANDA tickers aren't the same as the EightCap tickers.
The template pre-selects the correct tickers for you, and I'll keep updating that tickers list whenever there is a ticker name update on the broker side.
✅ Select whether you want to create "at-market" or "limit" orders.
The alert messages are updated accordingly.
✅ Custom close condition
Some indicators may have a custom close trade condition
For example, A trader could decide to cut a trade if another indicator gives a signal in the opposite direction
In that case, the template alerts the Expert Advisor to close the opened trade(s).
✅ Includes a Stop-Loss, Take-Profit, Trailing Stop-Loss, Stop-Loss to breakeven features
The Stop-Loss/Take-Profit can be set in percentage or pips value.
The template sends those price values to the MetaTrader Expert Advisor.
✅ For a complicated TradingView script to connect or for more filters, we suggest selecting the "Custom Integration" option
A complex TradingView is any script involving a Zig Zag, divergences, Harmonic patterns, or similar logic.
If you don't know if the indicator(s) you want to connect is/are complex or not, please ask me in DM to have a look first.
Alerts
Important: When creating the alerts, select the option "Order fills and alert() function calls"
Leave the alert message field as is - It has already been pre-filled for you.
Need more information?
For more information, please send me a direct message or email.
Strategy Results from this post
Please note they're not relevant.
I connected a simple SMA cross indicator not to showcase the backtest statistics but the connection feature between a TradingView indicator script with this Pineconnector strategy template.
Dave

TrendGuard Flag Finder - Strategy [presentTrading]
Introduction and How It Is Different
In the vast world of trading strategies, the TrendGuard Flag Finder stands out as a unique blend of traditional flag pattern detection and the renowned SuperTrend indicator.
- A significant portion of the Flag Pattern detection is inspired by the "Flag Finder" code by @Amphibiantrading, which serves as one of foundational element of this strategy.
- While many strategies focus on either trend-following or pattern recognition, this strategy harmoniously combines both, offering traders a more holistic view of the market.
- The integration of the SuperTrend indicator not only provides a clear direction of the prevailing trend but also offers potential stop-loss levels, enhancing the strategy's risk management capabilities.
AAPL 1D chart
ETHBTC 6hr chart
Strategy: How It Works
The TrendGuard Flag Finder is primarily built on two pillars:
1. Flag Pattern Detection : At its core, the strategy identifies flag patterns, which are continuation patterns suggesting that the prevailing trend will resume after a brief consolidation. The strategy meticulously detects both bullish and bearish flags, ensuring traders can capitalize on opportunities in both rising and falling markets.
What is a Flag Pattern? A flag pattern consists of two main components:
1.1 The Pole : This is the initial strong price move, which can be either upwards (for bullish flags) or downwards (for bearish flags). The pole represents a strong surge in price in a particular direction, driven by significant buying or selling momentum.
1.2 The Flag : Following the pole, the price starts consolidating, moving against the initial trend. This consolidation forms a rectangular shape and is characterized by parallel trendlines. In a bullish flag, the consolidation will have a slight downward tilt, while in a bearish flag, it will have a slight upward tilt.
How the Strategy Detects Flags:
Identifying the Pole: The strategy first identifies a strong price movement over a user-defined number of bars. This movement should meet a certain percentage change to qualify as a pole.
Spotting the Flag: After the pole is identified, the strategy looks for a consolidation phase. The consolidation should be counter to the prevailing trend and should be contained within parallel lines. The depth (for bullish flags) or rally (for bearish flags) of this consolidation is calculated to ensure it meets user-defined criteria.
2. SuperTrend Integration : The SuperTrend indicator, known for its simplicity and effectiveness, is integrated into the strategy. It provides a dynamic line on the chart, signaling the prevailing trend. When prices are above the SuperTrend line, it's an indication of an uptrend, and vice versa. This not only confirms the flag pattern's direction but also offers a potential stop-loss level for trades.
When combined, these components allow traders to identify potential breakout (for bullish flags) or breakdown (for bearish flags) scenarios, backed by the momentum indicated by the SuperTrend.
Usage
To use the SuperTrend Enhanced Flag Finder:
- Inputs : Begin by setting the desired parameters. The strategy offers a range of user-controlled settings, allowing for customization based on individual trading preferences and risk tolerance.
- Visualization : Once the parameters are set, the strategy will identify and visually represent flag patterns on the chart. Bullish flags are represented in green, while bearish flags are in red.
- Trade Execution : When a breakout or breakdown is identified, the strategy provides entry signals. It also offers exit signals based on the SuperTrend, ensuring that traders can capitalize on the momentum while managing risk.
Default Settings
The strategy comes with a set of default settings optimized for general use:
- SuperTrend Parameters: Length set to 10 and Factor set to 5.0.
- Bull Flag Criteria: Max Flag Depth at 7, Max Flag Length at 10 bars, Min Flag Length at 3 bars, Prior Uptrend Minimum at 9%, and Flag Pole Length between 7 to 13 bars.
- Bear Flag Criteria: Similar settings adjusted for bearish patterns.
- Display Options: By default, both bullish and bearish flags are displayed, with breakout and breakdown points highlighted.

[tradinghook] - Renko Trend Reversal Strategy V2Title: Renko Trend Reversal Strategy
Short Title: - Renko TRS
> Special thanks to for manually calculating `renkoClose` and `renkoOpen` values in order to remove the infamous repaint issue
Description:
The Renko Trend Reversal Strategy ( - Renko TRS) is a powerful and original trading approach designed to identify trend reversals in financial markets using Renko charts. Renko charts differ from traditional time-based charts, as they focus solely on price movements and ignore time, resulting in a clearer representation of market trends. This strategy leverages Renko charts in conjunction with the Average True Range (ATR) to capture trend reversals with high precision and effectiveness.
Key Concepts:
Renko Charts: Renko charts are unique chart types that only plot price movements beyond a predefined brick size, ignoring time and noise. By doing so, they provide a more straightforward depiction of market trends, eliminating insignificant price fluctuations and making it easier to spot trend reversals.
Average True Range (ATR): The strategy utilizes the ATR indicator, which measures market volatility and provides valuable insights into potential price movements. By setting the brick size of the Renko chart based on the ATR, the strategy adapts to changing market conditions, ensuring optimal performance across various instruments and timeframes.
How it Works:
The Renko Trend Reversal Strategy is designed to identify trend reversal points and generate buy or sell signals based on the following principles:
Renko Brick Generation: The strategy calculates the ATR over a user-defined period (ATR Length) and utilizes this value to determine the size of Renko bricks. Larger ATR values result in bigger bricks, capturing higher market volatility, while smaller ATR values create smaller bricks for calmer market conditions.
Buy and Sell Signals: The strategy generates buy signals when the Renko chart's open price crosses below the close price, indicating a potential bullish trend reversal. Conversely, sell signals are generated when the open price crosses above the close price, suggesting a bearish trend reversal. These signals help traders identify potential entry points to capitalize on market movements.
Stop Loss and Take Profit Management: To manage risk and protect profits, the strategy incorporates dynamic stop-loss and take-profit levels. The stop-loss level is calculated as a percentage of the Renko open price, ensuring a fixed risk amount for each trade. Similarly, the take-profit level is set as a percentage of the Renko open price to secure potential gains.
How to Use:
Inputs: Before using the strategy, traders can customize several parameters to suit their trading preferences. These inputs include the ATR Length, Stop Loss Percentage, Take Profit Percentage, Start Date, and End Date. Adjusting these settings allows users to optimize the strategy for different market conditions and risk tolerances.
Chart Setup: Apply the - Renko TRS script to your desired financial instrument and timeframe on TradingView. The Renko chart will dynamically adjust its brick size based on the ATR Length parameter.
Buy and Sell Signals: The strategy will generate green "Buy" labels below bullish reversal points and red "Sell" labels above bearish reversal points on the Renko chart. These labels indicate potential entry points for long and short trades, respectively.
Risk Management: The strategy automatically calculates stop-loss and take-profit levels based on the user-defined percentages. Traders can ensure proper risk management by using these levels to protect their capital and secure profits.
Backtesting and Optimization: Before implementing the strategy live, traders are encouraged to backtest it on historical data to assess its performance across various market conditions. Adjust the input parameters through optimization to find the most suitable settings for specific instruments and timeframes.
Conclusion:
The - Renko Trend Reversal Strategy is a unique and versatile tool for traders looking to identify trend reversals with greater accuracy. By combining Renko charts and the Average True Range (ATR) indicator, this strategy adapts to market dynamics and provides clear entry and exit signals. Traders can harness the power of Renko charts while effectively managing risk through stop-loss and take-profit levels. Before using the strategy in live trading, backtesting and optimization will help traders fine-tune the parameters for optimal performance. Start exploring trend reversals with the - Renko TRS and take your trading to the next level.
(Note: This description is for illustrative purposes only and does not constitute financial advice. Traders are advised to thoroughly test the strategy and exercise sound risk management practices when trading in real markets.)

PercentX Trend Follower [Trendoscope]"Trendoscope" was born from our trading journey, where we first delved into the world of trend-following methods. Over time, we discovered the captivating allure of pattern analysis and the exciting challenges it presented, drawing us into exploring new horizons. However, our dedication to trend-following methodologies remains steadfast and continues to be an integral part of our core philosophy.
Here we are, introducing another effective trend-following methodology, employing straightforward yet powerful techniques.
🎲 Concepts
Introducing the innovative PercentX Oscillator , a representation of Bollinger PercentB and Keltner Percent K. This powerful tool offers users the flexibility to customize their PercentK oscillator, including options for the type of moving average and length.
The Oscillator Range is derived dynamically, utilizing two lengths - inner and outer. The inner length initiates the calculation of the oscillator's highest and lowest range, while the outer length is used for further calculations, involving either a moving average or the opposite side of the highest/lowest range, to obtain the oscillator ranges.
Next, the Oscillator Boundaries are derived by applying another round of high/low or moving average calculations on the oscillator range values.
Breakouts occur when the close price crosses above the upper boundary or below the lower boundary, signaling potential trading opportunities.
🎲 How to trade a breakout?
To reduce false signals, we employ a simple yet effective approach. Instead of executing market trades, we use stop orders on both sides at a certain distance from the current close price.
In case of an upper side breakout, a long stop order is placed at 1XATR above the close, and a short stop order is placed at 2XATR below the close. Conversely, for a lower side breakout, a short stop order is placed at 1XATR below the close, and a long stop order is placed at 2XATR above the ATR. As a trend following method, our first inclination is to trade on the side of breakout and not to find the reversals. Hence, higher multiplier is used for the direction opposite to the breakout.
The script provides users with the option to specify ATR multipliers for both sides.
Once a trade is initiated, the opposite side of the trade is converted into a stop-loss order. In the event of a breakout, the script will either place new long and short stop orders (if no existing trade is present) or update the stop-loss orders if a trade is currently running.
As a trend-following strategy, this script does not rely on specific targets or target levels. The objective is to run the trade as long as possible to generate profits. The trade is only stopped when the stop-loss is triggered, which is updated with every breakout to secure potential gains and minimize risks.
🎲 Default trade parameters
Script uses 10% equity per trade and up to 4 pyramid orders. Hence, the maximum invested amount at a time is 40% of the equity. Due to this, the comparison between buy and hold does not show a clear picture for the trade.
Feel free to explore and optimize the parameters further for your favorite symbols.
🎲 Visual representation
The blue line represents the PercentX Oscillator, orange and lime colored lines represent oscillator ranges. And red/green lines represent oscillator boundaries. Oscillator spikes upon breakout are highlighted with color fills.
Previous Day High Low Strategy only for LongWelcome to the "Previous Day High Low Strategy only for Long"!.
This strategy aims to identify potential long trading opportunities based on the previous day's high and low prices, along with certain market strength conditions.
Key Features:
Entry Conditions: The strategy triggers a long position when the current day's closing price crosses above the previous day's high or low.
Market Strength Filter: The strategy incorporates a market strength filter using the Average Directional Index (ADX). It only takes long positions when the ADX value is above a specific threshold and when there is a predominance of upward movement.
Trade Timing: The strategy operates within a specified trade window, starting at 09:30 and ending at 15:10. Positions are closed at 15:15 if still active.
Risk Management: The strategy employs dynamic stop-loss and profit-taking levels based on a user-defined Max Profit value. It has three profit targets (T1, T2, T3) and a stop-loss level to manage risk effectively.
Rules:
Ensure that the strategy idea is clearly understandable. Provide an easy-to-read title and a thoughtful description explaining the reasoning behind the strategy.
All content should be ad-free. Avoid any form of promotion, advertising, or solicitation.
No fundraising requests or money solicitation is allowed on TradingView.
Publish in the same language as the TradingView subdomain you're on, except for script titles, which must be in English.
Don't plagiarize. Create and share only unique content, and always give credit when using someone else's work.
Be respectful, kind, and constructive when engaging with others.
Zero tolerance for contentious political discourse, defamatory, threatening, or discriminatory remarks.
Avoid sharing harmful, misleading, or inappropriate content.
Respect the moderators' work and address complaints privately.
Use only your original account and avoid creating duplicate or fake accounts.
Do not attempt to manipulate the reputation system or engage in like-for-like schemes.
Explanation of how the strategy works
1. Previous Day's High and Low (HH, LL):
In this strategy, we start by obtaining the high and low prices of the previous day (not the current day) using the request.security function. This function allows us to access historical data for a specific time frame. The high and low prices are stored in the variables HH and LL, respectively.
2. Entry Conditions:
The strategy uses two conditions to trigger a long position:
Condition 1 (Long Condition 1): If the closing price of the current day crosses above the previous day's high (HH), it generates a long signal. This is achieved using the ta.crossover function, which detects when a crossover occurs.
Condition 2 (Long Condition 2): Similarly, if the closing price of the current day crosses above the previous day's low (LL), it also generates a long signal.
Combined Condition: To take long positions, the strategy combines both long conditions using the logical OR operator (or). This means that if either of the two conditions is met, a long position will be initiated.
3. Market Strength Filter:
The strategy also includes a filter based on the Average Directional Index (ADX) to gauge the market's strength before taking long positions. The ADX measures the strength of a trend in the market. The higher the ADX value, the stronger the trend.
Calculation of ADX: The ADX is calculated using the adx function, which takes two parameters: LWdilength (DMI Length) and LWadxlength (ADX period).
Strength Condition (strength_up): The strategy requires that the ADX value should be above a threshold (11 in this case) and that there is a predominance of upward movement (up > down) before initiating a long position. The LWADX value is multiplied by 2.5 and compared to the highest value of LWADX from the last 4 periods using ta.highest(LWADX , 4). If these conditions are met, the variable strength_up is set to true.
Combined Condition: The strength_up condition is then combined with the long conditions using the logical AND operator (and). This means that the strategy will only take a long position if both the long conditions and the market strength condition are met.
4. Trade Timing:
The strategy sets a specific trade window between 09:30 and 15:10. It will only execute trades within this time frame (TradeTime).
5. Risk Management:
The strategy implements dynamic stop-loss (SL) and profit-taking levels (T1, T2, T3) based on a user-defined Max Profit value. The stop-loss is set as a percentage of the Max Profit value. As the position moves in favor of the trader, the profit targets are adjusted accordingly.
6. Position Management:
The strategy uses the strategy.entry function to enter long positions based on the combined entry conditions. Once a position is open, the script uses strategy.exit to define the exit condition when either the profit target or stop-loss level is hit. The strategy.close function is used to close any open position at the end of the trade window (15:15).
7. Plotting:
The strategy uses the plot function to visualize the previous day's high and low prices, as well as the stop-loss (SL) and profit-taking (T1, T2, T3) levels on the chart.
Overall, the "Previous Day High Low Strategy only for Long" aims to identify potential long trading opportunities based on the previous day's price action and market strength conditions. However, as with any trading strategy, it's essential to thoroughly test it and consider risk management before applying it to real-world trading scenarios.
Disclaimer:
The information presented by this strategy is for educational purposes only and should not be considered as investment advice. The strategy is not designed for qualified investors. Always conduct your own research and consult with a financial advisor before making any trading decisions.
Remember, the success of any trading strategy depends on various factors, including market conditions, risk management, and individual trading skills. Past performance is not indicative of future results.

[tradinghook] - Renko Trend Reversal Strategy - Renko Trend Reversal Strategy
Short Title: - Renko TRS
Description:
The Renko Trend Reversal Strategy ( - Renko TRS) is a powerful and original trading approach designed to identify trend reversals in financial markets using Renko charts. Renko charts differ from traditional time-based charts, as they focus solely on price movements and ignore time, resulting in a clearer representation of market trends. This strategy leverages Renko charts in conjunction with the Average True Range (ATR) to capture trend reversals with high precision and effectiveness.
Key Concepts:
Renko Charts: Renko charts are unique chart types that only plot price movements beyond a predefined brick size, ignoring time and noise. By doing so, they provide a more straightforward depiction of market trends, eliminating insignificant price fluctuations and making it easier to spot trend reversals.
Average True Range (ATR): The strategy utilizes the ATR indicator, which measures market volatility and provides valuable insights into potential price movements. By setting the brick size of the Renko chart based on the ATR, the strategy adapts to changing market conditions, ensuring optimal performance across various instruments and timeframes.
How it Works:
The Renko Trend Reversal Strategy is designed to identify trend reversal points and generate buy or sell signals based on the following principles:
Renko Brick Generation: The strategy calculates the ATR over a user-defined period (ATR Length) and utilizes this value to determine the size of Renko bricks. Larger ATR values result in bigger bricks, capturing higher market volatility, while smaller ATR values create smaller bricks for calmer market conditions.
Buy and Sell Signals: The strategy generates buy signals when the Renko chart's open price crosses below the close price, indicating a potential bullish trend reversal. Conversely, sell signals are generated when the open price crosses above the close price, suggesting a bearish trend reversal. These signals help traders identify potential entry points to capitalize on market movements.
Stop Loss and Take Profit Management: To manage risk and protect profits, the strategy incorporates dynamic stop-loss and take-profit levels. The stop-loss level is calculated as a percentage of the Renko open price, ensuring a fixed risk amount for each trade. Similarly, the take-profit level is set as a percentage of the Renko open price to secure potential gains.
How to Use:
Inputs: Before using the strategy, traders can customize several parameters to suit their trading preferences. These inputs include the ATR Length, Stop Loss Percentage, Take Profit Percentage, Start Date, and End Date. Adjusting these settings allows users to optimize the strategy for different market conditions and risk tolerances.
Chart Setup: Apply the - Renko TRS script to your desired financial instrument and timeframe on TradingView. The Renko chart will dynamically adjust its brick size based on the ATR Length parameter.
Buy and Sell Signals: The strategy will generate green "Buy" labels below bullish reversal points and red "Sell" labels above bearish reversal points on the Renko chart. These labels indicate potential entry points for long and short trades, respectively.
Risk Management: The strategy automatically calculates stop-loss and take-profit levels based on the user-defined percentages. Traders can ensure proper risk management by using these levels to protect their capital and secure profits.
Backtesting and Optimization: Before implementing the strategy live, traders are encouraged to backtest it on historical data to assess its performance across various market conditions. Adjust the input parameters through optimization to find the most suitable settings for specific instruments and timeframes.
Conclusion:
The - Renko Trend Reversal Strategy is a unique and versatile tool for traders looking to identify trend reversals with greater accuracy. By combining Renko charts and the Average True Range (ATR) indicator, this strategy adapts to market dynamics and provides clear entry and exit signals. Traders can harness the power of Renko charts while effectively managing risk through stop-loss and take-profit levels. Before using the strategy in live trading, backtesting and optimization will help traders fine-tune the parameters for optimal performance. Start exploring trend reversals with the - Renko TRS and take your trading to the next level.
(Note: This description is for illustrative purposes only and does not constitute financial advice. Traders are advised to thoroughly test the strategy and exercise sound risk management practices when trading in real markets.)

Crunchster's Turtle and Trend SystemThis is a combination of two popular systematic trading strategies - in the trend following category.
The strategy is designed for use on the daily timeframe. Specific features of this system are outlined below:
1. Two different strategies to choose from, "Trend" which is a volatility adjusted Exponential Moving Average (EMA) crossover strategy and "Breakout" which is my adaptation of the well documented "Turtle Strategy"
2. Uses advanced position sizing and risk management, usually reserved for institutional portfolio management, a proven technique utilised by Commodity Trading Advisors and Managed Futures funds (Algo/Quant funds).
"Trend" uses a fast (user defined) and slow EMA crossover, where the slow length is 5 times the fast length. The resulting signal is adjusted for the volatility of returns over a 252 lookback period, which helps to normalise the signal across different assets. The system goes long or short when it detects a new trend has formed.
"Break" uses the highest high or lowest low over a user defined lookback period to define the recent range. This is converted into a price normalised signal to allow the system to detect when a breakout occurs. The system goes long or short based off the breakout signal.
Position sizing is based on recent price volatility and the user defined annualised risk target. In essence positions are inverse volatility weighted, so larger size is opened during lower volatility and smaller size during increased volatility. Recent volatility is calculated as the standard deviation of returns with 14 period lookback, then extrapolated into an annualised volatility of expected returns. Annualised recent volatility is then referenced to the risk target set by the user to adjust the position size. The default settings are a conservative 15% annual risk target/volatility. Initial capital should be set as the maximum risk capital per trade (ie if $10,000 total capital and 10% risk per trade, initial capital should be $1000). Maximum leverage per position can be set independently, to facilitate hitting risk targets that are greater than the natural volatility of the traded asset, and to accommodate low volatility conditions, whilst maintaining overall risk controls. Direction (long or short) is at the user's discretion.
Hard stop losses are based on multiples of the average true range of recent price (14 period lookback), user configurable.
Strategy trailing stops are based off recent highest highs or lowest lows (user defined lookback) to cut the position if the trend or momentum is lost.
Although both strategies can be run simultaneously, optimal diversification will be achieved if ran separately/individually to avoid masking of entries.

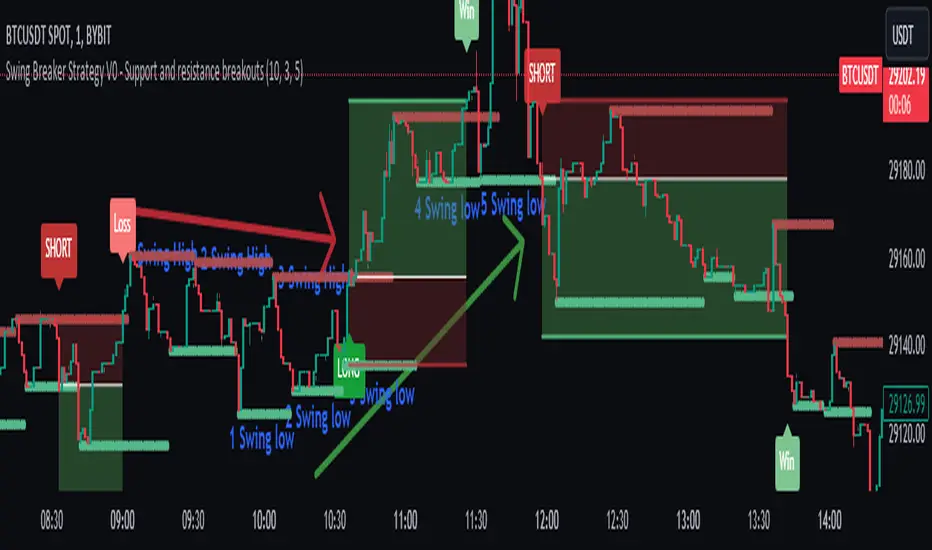
Swing Breaker Strategy [v0.1] - Support and resistance breakoutSwing Breaker Strategy - Support and Resistance Breakouts
This strategy has no repainting.
Default settings:
Swing Barsback: 10
Number of Swings: 3
Stoploss Candles Lookback: 5
Why these default settings?
This strategy has been backtested with over 100 trades, and on a larger scale of 1000 trades, it has reported a 1.33 profit factor with a maximum 5% cumulative drawdown, using no leverage. In this backtest, the settings (10,3,5) were used, becoming the default settings as they are more adaptable to different market conditions.
How does this strategy work?
Defining swing lows (support) and swing highs (resistance): We can locate these candles by looking at a symmetrical candle unit around them. For example, the default settings present a 10 swing bars back, which means there is no superior level within a 10-candle radius in the case of a swing high, and the opposite for a swing low. Swings are located a few candles after, just the number of swing bars back (width), because it is needed to ensure it is a swing.
Locating trends: We locate trends by looking at consecutive swings. For example, in the default settings, to determine a bullish trend, we need 3 consecutive ascending swing lows; for a bearish trend, 3 consecutive descending swing highs. You can find this parameter in settings as "Number of swings."
When a trend is formed, a stop entry is placed at the last swing until it is broken.
Just after the entry, the stop is placed at the lowest (in the case of a long) or the highest (in the case of a short) of the last candles. You can define that number in the settings as "Stoploss candles lookback," which default is 5. The take profit is placed at 2 times the stop value, resulting in a 2 risk-reward ratio.
Why is this strategy protected?
No other strategy combines the way of locating swings and turning it into a strategy, including customizable parameters such as stop loss, swing width and introducing the number of swings. That's why we decided to protect it.
CC Trend strategy 2- Downtrend ShortTrend Strategy #2
Indicators:
1. EMA(s)
2. Fibonacci retracement with a mutable lookback period
Strategy:
1. Short Only
2. No preset Stop Loss/Take Profit
3. 0.01% commission
4. When in a profit and a closure above the 200ema, the position takes a profit.
5. The position is stopped When a closure over the (0.764) Fibonacci ratio occurs.
* NO IMMEDIATE RE-ENTRIES EVER!*
How to use it and what makes it unique:
This strategy will enter often and stop quickly. The goal with this strategy is to take losses often but catch the big move to the downside when it occurs through the Silvercross/Fibonacci combination. This is a unique strategy because it uses a programmed Fibonacci ratio that can be used within the strategy and on any program. You can manipulate the stats by changing the lookback period of the Fibonacci retracement and looking at different assets/timeframes.
This description tells the indicators combined to create a new strategy, with commissions and take profit/stop loss conditions included, and the process of strategy execution with a description of how to use it. If you have any questions feel free to PM me and boost if you found it helpful. Thank you, pineUSERS!
CHEATCODE1

Quantitative Trend Strategy- Uptrend longTrend Strategy #1
Indicators:
1. SMA
2. Pivot high/low functions derived from SMA
3. Step lines to plot support and resistance based on the pivot points
4. If the close is over the resistance line, green arrows plot above, and vice versa for red arrows below support.
Strategy:
1. Long Only
2. Mutable 2% TP/1.5% SL
3. 0.01% commission
4. When the close is greater than the pivot point of the sma pivot high, and the close is greater than the resistance step line, a long position is opened.
*At times, the 2% take profit may not trigger IF; the conditions for reentry are met at the time of candle closure + no exit conditions have been triggered.
5. If the position is in the green and the support step line crosses over the resistance step line, positions are exited.
How to use it and what makes it unique:
Use this strategy to trade an up-trending market using a simple moving average to determine the trend. This strategy is meant to capture a good risk/reward in a bullish market while staying active in an appropriate fashion. This strategy is unique due to it's inclusion of the step line function with statistics derived from myself.
This description tells the indicators combined to create a new strategy, with commissions and take profit/stop loss conditions included, and the process of strategy execution with a description on how to use it. If you have any questions feel free to PM me and boost if you enjoyed it. Thank you, pineUSERS!

Dynamic Trendline Break - Strategy [presentTrading]- Introduction and How It Is Different
The Dynamic Trendline Break Strategy is a unique trading algorithm that leverages the power of trendlines and swing detection to identify potential trading opportunities.
Unlike traditional trendline strategies that rely on static trendlines, this strategy dynamically calculates trendlines based on pivot highs and lows.
This dynamic approach allows the strategy to adapt to changing market conditions (especially 24hr markets like Crypto) and potentially identify trading opportunities that static trendlines might miss.
BTCUSD 6hr chart
Tencent 700.HK 1D chart
- Strategy, How It Works
The strategy works by first identifying pivot highs and lows using a lookback period defined by the user. These pivot points are then used to calculate the slope of the trendlines. The slope calculation method can be chosen from three options: Average True Range (ATR), Standard Deviation (Stdev), or Linear Regression (Linreg), providing flexibility to the trader.
Once the trendlines are calculated, the strategy identifies potential trading opportunities when the price crosses over the upper trendline (for long trades) or crosses under the lower trendline (for short trades). The strategy also allows the user to define the trade direction (Long, Short, or Both) and the stop loss method (Fixed or SuperTrend).
- Trade Direction
The trade direction parameter allows the user to define the direction of the trades that the strategy will take. If set to "Long", the strategy will only take long trades when the price crosses over the upper trendline. If set to "Short", the strategy will only take short trades when the price crosses under the lower trendline. If set to "Both", the strategy will take both long and short trades.
- Usage
To use this strategy, simply input your desired parameters for the swing detection lookback, slope, slope calculation method, trade direction, stop loss method, and stop loss level. Once these parameters are set, the strategy will automatically calculate the trendlines and identify potential trading opportunities based on the defined parameters.
- Default Settings
The default settings for the strategy are as follows:
Swing Detection Lookback: 30
Slope: 0.618
Slope Calculation Method: ATR
Trade Direction: Both
Stop Loss Method: SuperTrend
Stop Loss Level: 15%
SuperTrend Factor: 3
SuperTrend Lookback: 21
These settings can be adjusted to suit your trading style and risk tolerance. Always remember to backtest any changes to the settings before live trading.

Trend FollowingMoving Average Period:** This is the period of the moving average that will be used to identify the trend. A good starting point is 10 days.
* **Candlestick Patterns:** The candlestick patterns that will be used to identify potential reversals in the trend. Some of the most common candlestick patterns include the bullish engulfing pattern, the bearish engulfing pattern, the hammer pattern, and the inverted hammer pattern.
* **Support and Resistance Levels:** The support and resistance levels that will be used to manage risk. These levels can be identified using a variety of technical indicators, such as the moving average, the Bollinger bands, and the Fibonacci retracement levels.
Here is how the strategy will work:
1. The moving average will be used to identify the trend. When the price is above the moving average, it is considered to be in an uptrend. When the price is below the moving average, it is considered to be in a downtrend.
2. Candlestick patterns will be used to identify potential reversals in the trend. If a bullish candlestick pattern appears in an uptrend, it could be a sign that the trend is about to continue. If a bearish candlestick pattern appears in a downtrend, it could be a sign that the trend is about to reverse.

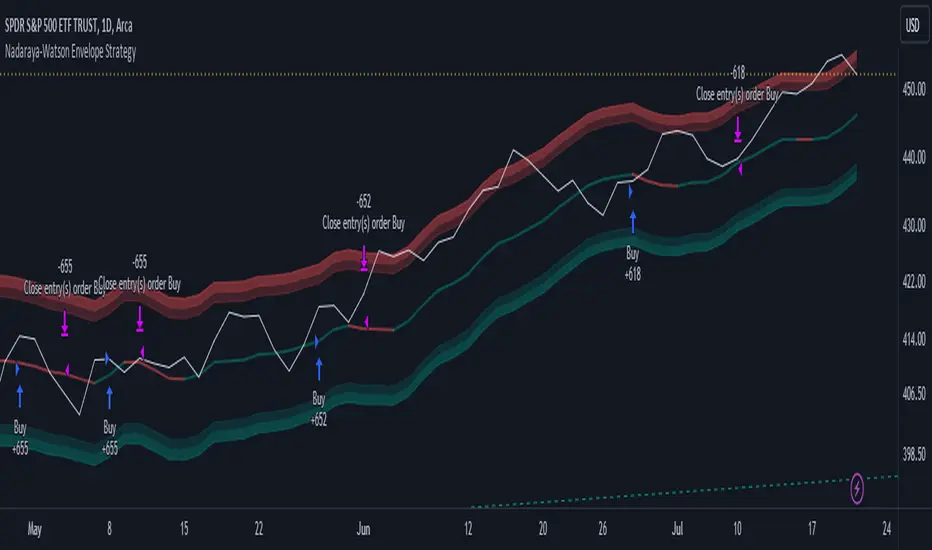
Nadaraya-Watson Envelope Strategy (Non-Repainting) Log ScaleIn the diverse world of trading strategies, the Nadaraya-Watson Envelope Strategy offers a different approach. Grounded in mathematical analysis, this strategy utilizes the Nadaraya-Watson kernel regression, a method traditionally employed for interpreting complex data patterns.
At the core of this strategy lies the concept of 'envelopes', which are essentially dynamic volatility bands formed around the price based on a custom Average True Range (ATR). These envelopes help provide guidance on potential market entry and exit points. The strategy suggests considering a buy when the price crosses the lower envelope and a sell when it crosses the upper envelope.
One distinctive characteristic of the Nadaraya-Watson Envelope Strategy is its use of a logarithmic scale, as opposed to a linear scale. The logarithmic scale can be advantageous when dealing with larger timeframes and assets with wide-ranging price movements.
The strategy is implemented using Pine Script v5, and includes several adjustable parameters such as the lookback window, relative weighting, and the regression start point, providing a level of flexibility.
However, it's important to maintain a balanced view. While the use of mathematical models like the Nadaraya-Watson kernel regression may provide insightful data analysis, no strategy can guarantee success. Thorough backtesting, understanding the mathematical principles involved, and sound risk management are always essential when applying any trading strategy.
The Nadaraya-Watson Envelope Strategy thus offers another tool for traders to consider. As with all strategies, its effectiveness will largely depend on the trader's understanding, application, and the specific market conditions.
Crunchster's Normalised Trend StrategyThis is a unique rules-based, systematic trading strategy - in the trend following category.
The strategy is designed for use on the daily timeframe. Specific features of this strategy are outlined below:
1. Uses a transformed price series (which I dub "real price") to generate signals rather than ticker price
2. Uses advanced position sizing and risk management, usually reserved for institutional portfolio management, a proven technique utilised by Commodity Trading Advisors and Managed Futures funds (Algo/Quant funds).
"Real Price" is a transformed price series derived from the sum of volatility adjusted (daily) returns, over the entire price series of an asset. The lookback period of the volatility adjustment is user defined.
A Hull moving average (HMA) is derived from the real price, and used as the main trend determinant. The lookback period of the HMA is user defined. Default lookback of 100 periods (days) ensures a responsive trend indicator, but without leading to over-trading from frequent crossovers (average holding period 14 days on BTC).
The core strategy is very simple, go long when real price crosses over HMA, go short when real price crosses under HMA. New position triggers automatically close open positions in the counter direction.
Position sizing is based on recent price volatility and the user defined annualised risk target. In essence positions are inverse volatility weighted, so larger size is opened during lower volatility and smaller size during increased volatility. Recent volatility is calculated as the standard deviation of returns with 14 period lookback, then extrapolated into an annualised volatility of expected returns. Annualised recent volatility is then referenced to the risk target set by the user to adjust the position size. The default settings are a very conservative 10% annual risk target. Initial capital should be set as the maximum risk capital per trade (ie if $10,000 total capital and 10% risk per trade, initial capital should be $1000). Maximum leverage per position can be set independently, to facilitate hitting risk targets that are greater than the natural volatility of the traded asset, and to accommodate low volatility conditions, whilst maintaining overall risk controls.
Hard stop losses are based on multiples of the average true range of recent price (14 period lookback), user configurable.
Please leave comments regarding further features or refinements. I plan to develop further adding alternative moving average selections and the ability to select/deselect long and short strategies.
3 hours ago
Release Notes:
Added option to compound profits versus using a fixed position capital. Be mindful that compounding will potentially increase profits, but also increase drawdowns and overall risk. Leverage will still cap overall exposure with compounding and therefore provides an additional layer of risk control.
2 hours ago
Release Notes:
Added function to toggle long/short strategy legs on and off.

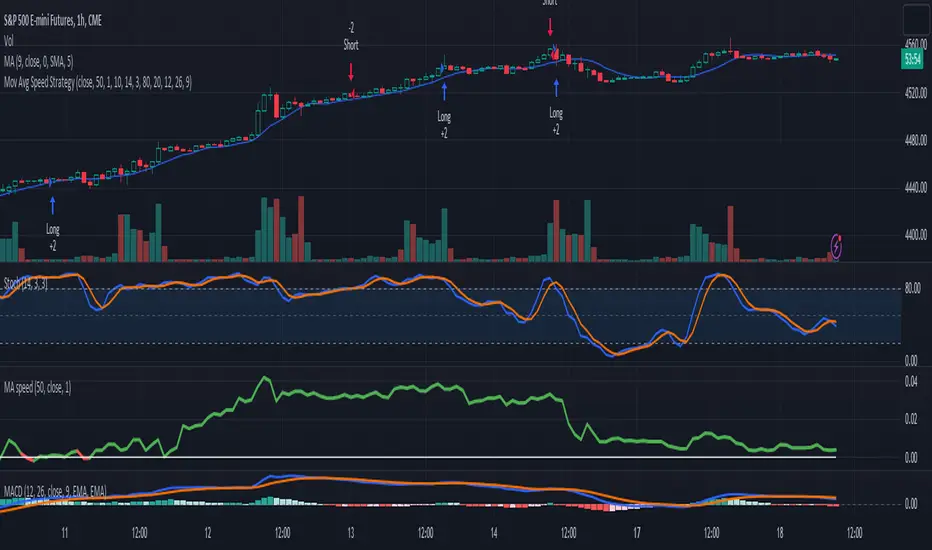
3-Signal Directional Trend Strategy for E-MinisThis is a conceptual strategy intended for E-mini S&P 500 futures with hourly bars.
It uses three signals, going long or short when two or more change in the same direction.
First is MACD. A positive oscillator is considered a bullish signal and a falling oscillator is interpreted bearishly.
Next, stochastics are used as an overbought/oversold indicator. Overbought conditions are considered bearish and oversold readings are viewed as bullish.
Third is a custom indicator based on our Moving Average Speed script. It takes the rate of change of the 50-hour simple moving average (SMA), and then smooths it using a 10-period average. This provides a directional signal.
Traders may want to experiment with different settings for moving average speed.
Note: This is intended for use with stock index futures, which have round-the clock price data to populate the data in the indicators. It may not yield good results with stocks or ETFs.
TradeStation has, for decades, advanced the trading industry, providing access to stocks, options, futures and cryptocurrencies. See our Overview for more.
Important Information
TradeStation Securities, Inc., TradeStation Crypto, Inc., and TradeStation Technologies, Inc. are each wholly owned subsidiaries of TradeStation Group, Inc., all operating, and providing products and services, under the TradeStation brand and trademark. TradeStation Crypto, Inc. offers to self-directed investors and traders cryptocurrency brokerage services. It is neither licensed with the SEC or the CFTC nor is it a Member of NFA. When applying for, or purchasing, accounts, subscriptions, products, and services, it is important that you know which company you will be dealing with. Please click here for further important information explaining what this means.
This content is for informational and educational purposes only. This is not a recommendation regarding any investment or investment strategy. Any opinions expressed herein are those of the author and do not represent the views or opinions of TradeStation or any of its affiliates.
Investing involves risks. Past performance, whether actual or indicated by historical tests of strategies, is no guarantee of future performance or success. There is a possibility that you may sustain a loss equal to or greater than your entire investment regardless of which asset class you trade (equities, options, futures, or digital assets); therefore, you should not invest or risk money that you cannot afford to lose. Before trading any asset class, first read the relevant risk disclosure statements on the Important Documents page, found here: www.tradestation.com .
SuperTrend Enhanced Pivot Reversal - Strategy [PresentTrading]
- Introduction and How it is Different
The SuperTrend Enhanced Pivot Reversal is a unique approach to trading that combines the best of two worlds: the precision of pivot reversal points and the trend-following power of the SuperTrend indicator. This strategy is designed to provide traders with clear entry and exit points, while also filtering out potentially false signals using the SuperTrend indicator.
BTCUSDT 6hr
ETHBTC 6hr
Unlike traditional pivot reversal strategies, this approach uses the SuperTrend indicator as a filter. This means that it only takes trades that align with the overall trend, as determined by the SuperTrend indicator. This can help to reduce the number of false signals and improve the overall profitability of the strategy.
The Pivot Reversal Strategy with SuperTrend Filter is particularly well-suited to the cryptocurrency market for the reason of High Volatility. This means that prices can change rapidly in a very short time, making it possible to make a profit quickly. The strategy's use of pivot points allows traders to take advantage of these rapid price changes by identifying potential reversal points
- Strategy: How it Works
The strategy works by identifying pivot reversal points, which are points in the price chart where the price is likely to reverse. These points are identified using a combination of the ta.pivothigh and ta.pivotlow functions, which find the highest and lowest points in the price chart over a certain period.
Once a pivot reversal point is identified, the strategy checks the direction of the SuperTrend indicator. If the SuperTrend is positive (indicating an uptrend), the strategy will only take long trades. If the SuperTrend is negative (indicating a downtrend), the strategy will only take short trades.
The strategy also includes a stop loss level, which is set as a percentage of the entry price. This helps to limit potential losses if the price moves in the opposite direction to the trade.
- Trade Direction
The trade direction can be set to "Long", "Short", or "Both". This allows the trader to choose whether they want to take only long trades (buying low and selling high), only short trades (selling high and buying low), or both. This can be useful depending on the trader's view of the market and their risk tolerance.
- Usage
To use the Pivot Reversal Strategy with SuperTrend Filter, simply input the desired parameters into the script and apply it to the price chart of the asset you wish to trade. The strategy will then identify potential trade entry and exit points, which will be displayed on the price chart.
- Default Settings
The default settings for the strategy are as follows:
ATR Length: 5
Factor: 2.618
Trade Direction: Both
Stop Loss Level: 20%
Commission: 0.1%
Slippage: 1
Currency: USD
Each trade: 10% of account equity
Initial capital: $10,000
These settings can be adjusted to suit the trader's preferences and risk tolerance. Always remember to test any changes to the settings using historical data before applying them to live trades.

Master Trend ReversalThe 'Master Trend Reversal' strategy is an innovative approach to detecting trend reversals in the market. This strategy harnesses the power of 'Pin Bars', a specific type of candlestick, to pinpoint potential trading opportunities.
Based on the properties of Pin Bars, this strategy identifies scenarios where the market is likely to reverse its trend. In particular, it seeks out Pin Bars that are significantly longer than their surrounding candles, a length determined by the 'Pin Bar Size (%)' parameter.
When a bullish Pin Bar is detected (i.e., the closing price is lower than the opening price, and the gap between the opening and low prices exceeds the specified Pin Bar size), the strategy goes long. Conversely, upon identifying a bearish Pin Bar (the closing price is higher than the opening price, and the difference between the high and opening prices is greater than the specified Pin Bar size), the strategy goes short.
Furthermore, 'Master Trend Reversal' incorporates an efficient risk management mechanism via stop-loss orders. The stop-loss level is calculated based on the average price of the position and the 'Stop Loss Percentage (%)' as specified by the user.
Hence, the 'Master Trend Reversal' strategy offers a unique approach to capitalize on market trend reversals while limiting potential losses through the use of stop-loss orders. This combination of precise trend reversal detection and robust risk management makes this strategy particularly useful for traders seeking to maximize their profits while effectively controlling their risk exposure.
Please remember that, like any trading strategy, 'Master Trend Reversal' does not guarantee success and should be used as part of a holistic risk management approach in the markets.

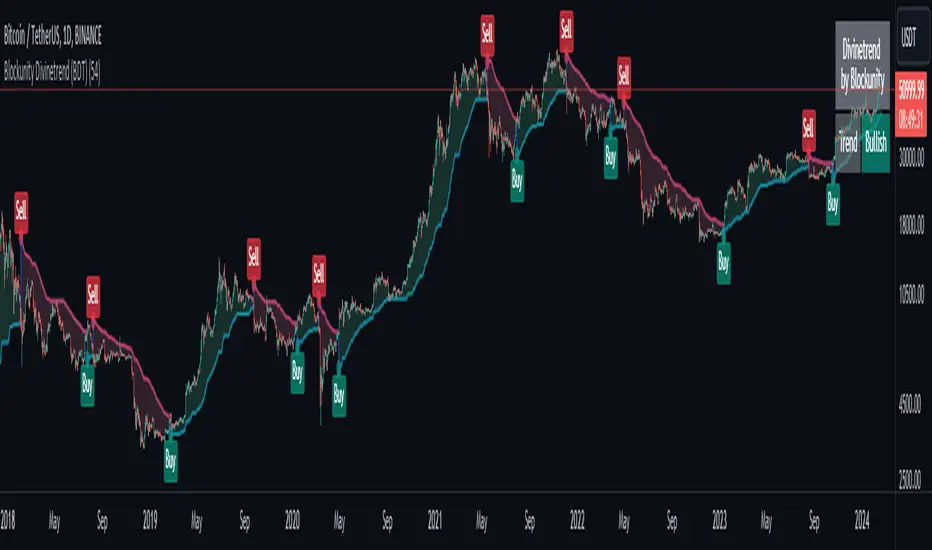
Blockunity Divinetrend (BDT)A formidable trend-following indicator, based on an ATR combined with a trailing stop mechanism. Divinetrend’s aim is to offer a simple and efficient alternative to Supertrend, another highly reputed indicator of the same type. It comes with a trading strategy that can be activated in its parameters. You can also change a number of design parameters.
Divinetrend is pretty straightforward in its approach. It calculates a base moving average taking into account the asset’s volatility, multiplies it with an ATR, then displays a line representing a trailing stop. When a red line is broken, the asset is considered to be moving back into an uptrend. Inversely, when a green line is broken, a bearish signal is sent. In the parameters, you can also activate a trend contestation period. If this parameter is activated, the price must have been trending for at least 5 days for the trend change to be validated.
Usage Advice
We recommend that you do not use this indicator with a time unit of less than 2 hours. Ideally in 4 hours or daily, or even 3 days. Otherwise, there’s nothing special about the use of this indicator. We still recommend that you use your logarithmic chart for a better visualization, but this is optional.
This indicator was designed in particular for the crypto market, but it also works on traditional market assets.
The Different Signals
Divinetrend gives buy and sell signals based on trailing stop line breaks and trend orientation. In particular, it can be used for trend identification and following. If the Contested Trend option is activated in the settings, the indicator will also display a contested period in blue. In this case, it is necessary to wait 5 days for the trend to be validated.
Integrated Strategy
In addition, a trading strategy is integrated into the Divinetrend indicator. This can be activated in the parameters. This is mainly there to see the results and the relevance of the indicator in the TradingView Strategy Tester. We do not recommend using it alone. As this strategy is used to study the indicator's performance, we use the following default parameters: An initial capital of 2,000 USDT with 100% of equity in order size. In other words, we'll bet the entire portfolio on each trade. To do this, we use a default stop loss of 10%, to avoid risking heavy losses. We also use a commission of 0.01% and a slippage of 3 ticks to reflect more reality.
Moving Average Rainbow (Stormer)This strategy is based and shown by trader and investor Alexandre Wolwacz "Stormer".
Overview
The strategy uses 12 moving averages (default EMA) to identify trends and generate trading signals opening positions.
Allowing to select the type of moving average and length to be used.
The conditions includes relationship between moving averages, the position of the current price relative to the moving averages, and the occurrence of certain price patterns.
Calculation
The mean moving averages is calculated by adding all the 12 moving averages and dividing by 12, the value is used to help to identify trend and possible condition to open position.
The 12 moving averages is spliced by 3 ranges, initial range (moving average lines 1 to 4), middle range (moving average lines 5 to 8) and end range (moving average lines 9 to 12). These ranges helps to identify potential trend and market turn over.
The moving average touch price is a relationship between the low price (uptrend) or high price (downtrend) with the moving average lines, it identifies where the price (low/high) has reached the the moving average line. Fetching the value to help for opening position, set stop loss and take profit.
Since the stop loss is based and set from the previous moving average touch price value, when position is about to be open and setting the stop loss value, there is a verification to check both current and previous moving average touch price to recalculate the stop loss value.
The turnover trend checks for a possible market turnover event, setting up a new profit target, this setting when enabled is to be helpful when a turnover occurs against the position to exit position with some profit based on highest high price if long or lowest low price if short.
The turnover signal is similar to turnover trend. The difference is that when this setting is enabled and it triggers, it simply exit the current position and opens up a reverse position, long goes short and short goes long. And there is an complement optional that checks current price exit profitable.
Entry Position
Long Position:
Price is higher than the mean moving averages. Meaning possible uptrend.
The lines of the middle range from the moving averages are in increasing order. Meaning possible uptrend.
The current high pierced up previous high.
Fetch the previous value of the moving average touch price. Meaning the low price has touched one of the moving average lines, which that value is conditioning to open position.
Short Position:
Price is lower than the mean moving averages. Meaning possible downtrend.
The lines of the middle range from the moving averages are in decreasing order. Meaning possible downtrend.
The current low pierced down previous low.
Fetch the previous value of the moving average touch price. Meaning the high price has touched one of the moving average lines, which that value is conditioning to open position.
Risk Management
Stop Loss:
The stop loss is based from the previous moving average touch price value, high price for short and low price for long or occurs an verification to check for both current and previous moving average touch price value and a recalculation is done to set the stop loss.
Take Profit:
According to the author, the profit target should be at least 1:1.6 the risk, so to have the strategy mathematically positive.
The profit target is configured input, can be increased or decreased.
It calculates the take profit based on the price of the stop loss with the profit target input.
Turnover Trend
Long Position:
The moving averages initial range lines signals a possible market turnover. Meaning long might be going short.
Fetches the highest high hit since the opening of the position, setting that value to the new profit target.
Short Position:
The moving averages initial range lines signals a possible market turnover. Meaning short might be going long.
Fetches the lowest low hit since the opening of the position, setting that value to the new profit target.

Volatility Capture RSI-Bollinger - Strategy [presentTrading]- Introduction and how it is different
The 'Volatility Capture RSI-Bollinger - Strategy ' is a trading strategy that combines the concepts of Bollinger Bands (BB), Relative Strength Index (RSI), and Simple Moving Average (SMA) to generate trading signals. The uniqueness of this strategy is it calculates which is a dynamic level between the upper and lower Bollinger Bands based on the closing price. This unique feature allows the strategy to adapt to market volatility and price movements.
The market in Crypto and Stock are highly volatile, making them suitable for a strategy that uses Bollinger Bands. The RSI can help identify overbought or oversold conditions in this often speculative market.
BTCUSD 4hr chart
(700.hk) 3hr chart
Remember, the effectiveness of a trading strategy also depends on other factors such as the timeframe used, the specific settings of the indicators, and the overall market conditions. It's always recommended to backtest and paper trade a strategy before using it in live trading.
- Strategy, How it Works
Dynamic Bollinger Band: The strategy works by first calculating the upper and lower Bollinger Bands based on the user-defined length and multiplier. It then uses the Bollinger Bands and the closing price to dynamically adjust the presentBollingBand value. In the end, it generates a long signal when the price crosses over the present Bolling Band and a short signal when the price crosses under the present Bolling Band.
RSI: If the user has chosen to use RSI for signals, the strategy also calculates the RSI and its SMA, and uses these to generate additional long and short signals. The RSI-based signals are only used if the 'Use RSI for signals' option is set to true.
The strategy then checks the chosen trading direction and enters a long or short position accordingly. If the trading direction is set to 'Both', the strategy can enter both long and short positions.
Finally, the strategy exits a position when the close price crosses under the present Bolling Band for a long position, or crosses over the present Bolling Band for a short position.
- Trade direction
The strategy also includes a trade direction parameter, allowing the user to choose whether to enter long trades, short trades, or both. This makes the strategy adaptable to different market conditions and trading styles.
- Usage
1. Set the input parameters as per your trading preferences. You can choose the price source, the length of the moving average, the multiplier for the ATR, whether to use RSI for signals, the RSI and SMA periods, the bought and sold range levels, and the trading direction.
2. The strategy will then generate buy and sell signals based on these parameters. You can use these signals to enter and exit trades.
- Default settings
1. Source: hlc3
2. Length: 50
3. Multiplier: 2.7183
4. Use RSI for signals: True
5. RSI Period: 10
6. SMA Period: 5
7. Bought Range Level: 55
8. Sold Range Level: 50
9. Trade Direction: Both
- Strategy's default Properties
1. Default Quantity Type: 'strategy.percent_of_equity'
2. commission_value= 0.1, commission_type=strategy.commission.percent, slippage= 1: These parameters set the commission and slippage for the strategy. The commission is set to 0.1% of the trade value, and the slippage (the difference between the expected price of a trade and the price at which the trade is executed) is set to 1.
3. default_qty_type = strategy.percent_of_equity, default_qty_value = 15: These parameters set the default quantity for trades. The default_qty_type is set to strategy.percent_of_equity, which means that the size of each trade will be a percentage of the account equity. The default_qty_value is set to 15, which means that each trade will be 15% of the account equity.
4. initial_capital= 10000: This parameter sets the initial capital for the strategy to $10,000.
