Advanced Bitcoin Trend Following StrategyTitle: Bitcoin Multi-Factor Trend Following Strategy
Description:
The Bitcoin Multi-Factor Trend Following Strategy is designed for traders seeking a robust, multi-factor approach to trend following in Bitcoin markets. This script combines technical indicators and statistical methods to identify trend directions, optimize entry and exit points, and manage position sizing based on volatility and leverage constraints. Key features of the strategy include:
Multi-Indicator Trend Forecasting:
This strategy employs three trend forecasting methods: range, exponential moving average (EMA), and Bollinger Bands. Each method can be independently enabled or disabled, giving traders flexibility in how trends are identified and followed.
Range Forecast : Calculates forecast based on the range (high and low) of recent prices, with optional smoothing via a Kalman filter to reduce noise.
EMA Spread Forecast : Utilizes the spread between fast and slow EMAs to gauge the trend’s strength, adjusted for volatility.
Bollinger Band Forecast : Measures the proximity of price to Bollinger Band levels to assess trend intensity.
Kalman Filter for Smoothing:
The Kalman filter is applied to price data for smoother trend estimation, particularly within the range forecast. This allows the strategy to reduce noise and focus on more reliable price signals.
Volatility-Adjusted Position Sizing:
The strategy incorporates volatility targeting to dynamically adjust position sizes based on current market conditions. Traders can set an annualized volatility target to control the risk level, with position size scaled accordingly to maintain consistent risk exposure. A maximum leverage cap ensures that position sizes do not exceed a user-defined threshold, offering an additional layer of risk control.
Dynamic Entry and Exit Points:
Entry and exit points are based on customizable thresholds that determine trend strength and are sensitive to market volatility. The script monitors changes in forecast values and automatically adjusts trades to capitalize on emerging trends or exit weakening ones. The strategy includes an option to close all open positions when trend forecasts fall below defined thresholds, ensuring an automated approach to risk management.
Backtesting and Performance Metrics:
To support strategy optimization, the script includes a backtest mode that calculates key performance metrics such as Sharpe Ratio, Buy & Hold profit, Strategy profit, Win rate, and other metrics. These metrics are displayed in a summary table directly on the chart, providing real-time insight into the strategy’s historical performance compared to a buy-and-hold approach.
Configurable Time and Date Range:
Users can specify start and end dates for the backtest period, allowing for focused backtesting over any desired timeframe. This feature enables in-depth analysis of performance across varying market conditions.
Use Case:
This strategy is best suited for experienced traders who wish to apply a structured trend-following approach in Bitcoin or other high-volatility assets. It is highly customizable, making it adaptable to various market conditions and trading styles. The combination of trend forecasting methods, volatility targeting, and automatic leverage control offers a balanced approach to capturing long-term trends while managing risk.
Parameters:
Entry Threshold: Adjusts the sensitivity of the entry point for trends. Lower values make the strategy more reactive.
Annual Volatility Target: Controls the risk level by targeting a specific annualized volatility percentage.
Max Leverage: Caps the allowable leverage for each trade.
Forecast Activations: Toggles to enable or disable the use of range, EMA, and Bollinger forecasts.
Date Range: Allows users to define the start and end dates for testing the strategy.
Notes:
This strategy is designed for educational purposes and requires thorough backtesting and optimization before live trading. Real-time performance may vary, and additional risk management practices are advised.
License:
This script is subject to the terms of the Mozilla Public License 2.0.
Análise de Tendência

Fractional Accumulation Distribution Strategy🔹 INTRODUCTION:
As traders and investors, we often find ourselves searching for ways to maximize our market positioning—trying to capture the best price, manage risk, and adapt to ever-changing volatility. Through years of working with a variety of traders and investors, a common theme emerged: the most successful market participants were those who accumulated positions strategically over time, rather than relying on one-off, rigid entry points. However, even the best of them struggled to consistently time their entries and exits for optimal results.
That's why I created the Fractional Accumulation/Distribution Strategy (FADS)—an adaptable solution designed to dynamically adjust position sizing and entry points based on changing market conditions, enabling both passive and active market participants to optimize their approach.
The FADS trading strategy combines volatility-based trend detection and adaptive position scaling to maximize profitability across varied market conditions. By using the price ranges from higher timeframes, FADS pinpoints extreme demand and supply zones with a high statistical probability of reversal, making it effective in both high and low volatility environments. By applying adjustable threshold settings, users can focus on meaningful price movements to reduce unnecessary trades. Adaptive position scaling further enhances this approach by adjusting position sizes based on entry level distances, allowing for strategic position building that balances risk and reward in uncertain markets. This systematic scaling begins with smaller positions, expanding as the trend solidifies, creating a refined, robust trading experience.
🔹 FEATURES:
Multi-Timeframe Volatility-Based Trend Detection
Accumulation/Distribution Level Filter
Customizable Period for Highest/Lowest Prices Capture
Adjustable Sensitivity & Frequency in Positioning
Broad control settings of Strategy
Adaptive Position Scaling
🔹 SETTINGS:
Volatility : Determines trading range based on market volatility . Highest range value number of periods.
Factor : Adjusts the width of the Accumulation & Distribution bands separately. The Level Filter feature offers customizable triggering bands, allowing users to fine-tune the initiation point for the Accumulation/Distribution sequence. This flexibility enables traders to align entries more precisely with market conditions, setting optimal thresholds for initiating trade chains, whether in accumulating positions during uptrends or distributing in downtrends.
Lowest : Choose the price source (e.g., Close, Low). Number of bars considered when determining the lowest price level. Selecting the checkbox generate a signal when the price crosses below the previous lowest value for calculating the lowest value used for trade signals.
Highest : Choose the price source (e.g., Close, High). Number of bars considered when determining the highest price levels. Selecting the checkbox generate a signal when the price crosses above the previous highest value for calculating the highest value used for trade signals.
Accumulation Spread : Adjusts the buying frequency sensitivity by setting the distance between entries based on personal risk tolerance. Larger values for less frequent buys; smaller values for more frequent buys.
Distribution Spread : Adjusts the selling frequency sensitivity by setting the distance between exits based on reward preference. Larger values for less frequent sells; smaller values for more frequent sells.
Percentage of Capital Allocation : Sets the portion of total capital used for the initial trade in a strategy. It sets the scale for subsequent trades during accumulation phase.
🔹 APPLICATIONS:
❖ Accumulation and Distribution Phases
Early entries are avoided by initiating accumulation only after a trend reversal is confirmed and price breaks below long-term range.
Position sizes are determined by the distance between consecutive trades, smaller distance results in smaller position sizes and vice versa.
Average position cost is reduced by accumulating larger positions at the lower prices, potentially resulting in improved profitability.
Early exits are avoided by initiating distribution only after trend reversal is confirmed and price breaks above long-term range.
The pace of distribution can be tracked by the violet line that represents average positions during distribution phase
❖ Use Cases (Different than default setting input is used for illustration purposes)
If the starting point of accumulation starts too high for the risk preference, Accumulation Level Filter can be lowered by increasing the 🟢 threshold Factor.
If the starting point of distribution is too low for the reward preference, the Distribution Level Filter can be raised by increasing the 🔴 threshold Factor.
In lower timeframes, positions during the accumulation phase could be purchased at higher levels relative to prior entry positions. To optimize for this, consider extending the period used to capture the lowest prices. Similarly, during the distribution phase, increasing the period for identifying higher prices can improve accuracy.
🔹 Strategy Properties:
Adjusting properties within the script settings is recommended to align with specific accounts and trading platforms, ensuring realistic strategy results.
Balance (default): $100,000
Initial Order Size: 1% of the default balance
Commission: 0.1%
Slippage: 5 Ticks
Backtesting: Backtested using TradingView’s built-in strategy testing tool with default commission rates of 0.1% and slippage of 5 ticks. It reflects average market conditions for Apple Inc. (APPL) on 1-hour timeframe
Disclaimers: Commission and slippage varies with market conditions and brokerage policies. The assumed value may not represent all trading environments.
PAST PERFORMANCE DOESN’T GUARANTEE FUTURE RESULTS!
Disclaimer: Please remember that past performance may not be indicative of future results. Due to various factors, including changing market conditions, the strategy may no longer perform as well as in historical backtesting. This post and the script don’t provide any financial advice.
This invite-only script is being published as part of my commitment to developing tools that align with TradingView’s community standards. Access requests will be reviewed carefully after the script passes TradingView's moderation process.

Zig Zag + Aroon StrategyBelow is a trading strategy that combines the Zig Zag indicator and the Aroon indicator. This combination can help identify trends and potential reversal points.
Zig Zag and Aroon Strategy Overview
Zig Zag Indicator:
The Zig Zag indicator helps to identify significant price movements and eliminates smaller fluctuations. It is useful for spotting trends and reversals.
Aroon Indicator:
The Aroon indicator consists of two lines: Aroon Up and Aroon Down. It measures the time since the highest high and the lowest low over a specified period, indicating the strength of a trend.
Strategy Conditions
Long Entry Conditions:
Aroon Up crosses above Aroon Down (indicating a bullish trend).
The Zig Zag indicator shows an upward movement (indicating a potential continuation).
Short Entry Conditions:
Aroon Down crosses above Aroon Up (indicating a bearish trend).
The Zig Zag indicator shows a downward movement (indicating a potential continuation).
Exit Conditions:
Exit long when Aroon Down crosses above Aroon Up.
Exit short when Aroon Up crosses above Aroon Down.

FTMO Rules MonitorFTMO Rules Monitor: Stay on Track with Your FTMO Challenge Goals
TLDR; You can test with this template whether your strategy for one asset would pass the FTMO challenges step 1 then step 2, then with real money conditions.
Passing a prop firm challenge is ... challenging.
I believe a toolkit allowing to test in minutes whether a strategy would have passed a prop firm challenge in the past could be very powerful.
The FTMO Rules Monitor is designed to help you stay within FTMO’s strict risk management guidelines directly on your chart. Whether you’re aiming for the $10,000 or the $200,000 account challenge, this tool provides real-time tracking of your performance against FTMO’s rules to ensure you don’t accidentally breach any limits.
NOTES
The connected indicator for this post doesn't matter.
It's just a dummy double supertrends (see below)
The strategy results for this script post does not matter as I'm posting a FTMO rules template on which you can connect any indicator/strategy.
//@version=5
indicator("Supertrends", overlay=true)
// Supertrend 1 Parameters
var string ST1 = "Supertrend 1 Settings"
st1_atrPeriod = input.int(10, "ATR Period", minval=1, maxval=50, group=ST1)
st1_factor = input.float(2, "Factor", minval=0.5, maxval=10, step=0.5, group=ST1)
// Supertrend 2 Parameters
var string ST2 = "Supertrend 2 Settings"
st2_atrPeriod = input.int(14, "ATR Period", minval=1, maxval=50, group=ST2)
st2_factor = input.float(3, "Factor", minval=0.5, maxval=10, step=0.5, group=ST2)
// Calculate Supertrends
= ta.supertrend(st1_factor, st1_atrPeriod)
= ta.supertrend(st2_factor, st2_atrPeriod)
// Entry conditions
longCondition = direction1 == -1 and direction2 == -1 and direction1 == 1
shortCondition = direction1 == 1 and direction2 == 1 and direction1 == -1
// Optional: Plot Supertrends
plot(supertrend1, "Supertrend 1", color = direction1 == -1 ? color.green : color.red, linewidth=3)
plot(supertrend2, "Supertrend 2", color = direction2 == -1 ? color.lime : color.maroon, linewidth=3)
plotshape(series=longCondition, location=location.belowbar, color=color.green, style=shape.triangleup, title="Long")
plotshape(series=shortCondition, location=location.abovebar, color=color.red, style=shape.triangledown, title="Short")
signal = longCondition ? 1 : shortCondition ? -1 : na
plot(signal, "Signal", display = display.data_window)
To connect your indicator to this FTMO rules monitor template, please update it as follow
Create a signal variable to store 1 for the long/buy signal or -1 for the short/sell signal
Plot it in the display.data_window panel so that it doesn't clutter your chart
signal = longCondition ? 1 : shortCondition ? -1 : na
plot(signal, "Signal", display = display.data_window)
In the FTMO Rules Monitor template, I'm capturing this external signal with this input.source variable
entry_connector = input.source(close, "Entry Connector", group="Entry Connector")
longCondition = entry_connector == 1
shortCondition = entry_connector == -1
🔶 USAGE
This indicator displays essential FTMO Challenge rules and tracks your progress toward meeting each one. Here’s what’s monitored:
Max Daily Loss
• 10k Account: $500
• 25k Account: $1,250
• 50k Account: $2,500
• 100k Account: $5,000
• 200k Account: $10,000
Max Total Loss
• 10k Account: $1,000
• 25k Account: $2,500
• 50k Account: $5,000
• 100k Account: $10,000
• 200k Account: $20,000
Profit Target
• 10k Account: $1,000
• 25k Account: $2,500
• 50k Account: $5,000
• 100k Account: $10,000
• 200k Account: $20,000
Minimum Trading Days: 4 consecutive days for all account sizes
🔹 Key Features
1. Real-Time Compliance Check
The FTMO Rules Monitor keeps track of your daily and total losses, profit targets, and trading days. Each metric updates in real-time, giving you peace of mind that you’re within FTMO’s rules.
2. Color-Coded Visual Feedback
Each rule’s status is shown clearly with a ✓ for compliance or ✗ if the limit is breached. When a rule is broken, the indicator highlights it in red, so there’s no confusion.
3. Completion Notification
Once all FTMO requirements are met, the indicator closes all open positions and displays a celebratory message on your chart, letting you know you’ve successfully completed the challenge.
4. Easy-to-Read Table
A table on your chart provides an overview of each rule, your target, current performance, and whether you’re meeting each goal. The table adjusts its color scheme based on your chart settings for optimal visibility.
5. Dynamic Position Sizing
Integrated ATR-based position sizing helps you manage risk and avoid large drawdowns, ensuring each trade aligns with FTMO’s risk management principles.
Daveatt

PTS - Bollinger Bands with Trailing StopPTS - Bollinger Bands with Trailing Stop Strategy
Overview
The "PTS - Bollinger Bands with Trailing Stop" strategy is designed to capitalize on strong bullish market movements by combining the Bollinger Bands indicator with a dynamic trailing stop based on the Average True Range (ATR). This strategy aims to enter long positions during upward breakouts and protect profits through an adaptive exit mechanism.
Key Features
1. Bollinger Bands Indicator
Basis Moving Average Type: Choose from SMA, EMA, SMMA, WMA, or VWMA for the Bollinger Bands' basis line. Length: Adjustable period for calculating the moving average and standard deviation (default is 20). Standard Deviation Multiplier (StdDev): Determines the width of the bands (default is 2.0). Source: Select the price data used for calculations (default is the closing price).
2. Entry Conditions
The strategy enters a long position when the closing price crosses above the upper Bollinger Band , indicating strong upward momentum.
3. Exit Conditions
Trailing Stop Loss: Implemented using ATR to adjust dynamically with market volatility. ATR Length: Period for calculating ATR (default is 14). ATR Multiplier for Trailing Stop: Determines how closely the trailing stop follows the price (default is 2.0). Close Below Lower Bollinger Band: The strategy exits the long position if the closing price crosses below the lower Bollinger Band .
4. Risk Management
Commission and Slippage: Commission is set at 0.1%; slippage is set to 3. Position Sizing: Uses 100% of equity per trade (adjustable).
5. Date Range Filter
Specify the time period during which the strategy is active. Start Date: January 1, 2018. End Date: December 31, 2069.
Customizable Inputs
BB Length: Adjust the period for Bollinger Bands calculation. BB StdDev: Modify the standard deviation multiplier. Basis MA Type: Select the moving average type. Source: Choose the price data source. Offset: Shift the Bollinger Bands on the chart. ATR Length: Set the period for ATR calculation. ATR Multiplier for Trailing Stop: Adjust the trailing stop sensitivity.
Thought for 1m 7s
Description for the "PTS - Bollinger Bands with Trailing Stop" Strategy
PTS - Bollinger Bands with Trailing Stop Strategy
Overview
The "PTS - Bollinger Bands with Trailing Stop" strategy is designed to capitalize on strong bullish market movements by combining the Bollinger Bands indicator with a dynamic trailing stop based on the Average True Range (ATR). This strategy aims to enter long positions during upward breakouts and protect profits through an adaptive exit mechanism.
Key Features
1. Bollinger Bands Indicator
Basis Moving Average Type: Choose from SMA, EMA, SMMA, WMA, or VWMA for the Bollinger Bands' basis line. Length: Adjustable period for calculating the moving average and standard deviation (default is 20). Standard Deviation Multiplier (StdDev): Determines the width of the bands (default is 2.0). Source: Select the price data used for calculations (default is the closing price).
2. Entry Conditions
The strategy enters a long position when the closing price crosses above the upper Bollinger Band , indicating strong upward momentum.
3. Exit Conditions
Trailing Stop Loss: Implemented using ATR to adjust dynamically with market volatility. ATR Length: Period for calculating ATR (default is 14). ATR Multiplier for Trailing Stop: Determines how closely the trailing stop follows the price (default is 2.0). Close Below Lower Bollinger Band: The strategy exits the long position if the closing price crosses below the lower Bollinger Band .
4. Risk Management
Commission and Slippage: Commission is set at 0.1%; slippage is set to 3. Position Sizing: Uses 100% of equity per trade (adjustable).
5. Date Range Filter
Specify the time period during which the strategy is active. Start Date: January 1, 2018. End Date: December 31, 2069.
Customizable Inputs
BB Length: Adjust the period for Bollinger Bands calculation. BB StdDev: Modify the standard deviation multiplier. Basis MA Type: Select the moving average type. Source: Choose the price data source. Offset: Shift the Bollinger Bands on the chart. ATR Length: Set the period for ATR calculation. ATR Multiplier for Trailing Stop: Adjust the trailing stop sensitivity.
How the Strategy Works
1. Initialization
Calculates Bollinger Bands and ATR based on selected parameters.
2. Entry Logic
Opens a long position when the closing price exceeds the upper Bollinger Band.
3. Exit Logic
Uses a trailing stop loss based on ATR. Exits if the closing price drops below the lower Bollinger Band.
4. Date Filtering
Executes trades only within the specified date range.
Advantages
Adaptive Risk Management: Trailing stop adjusts to market volatility. Simplicity: Clear entry and exit signals. Customizable Parameters: Tailor the strategy to different assets or conditions.
Considerations
Aggressive Position Sizing: Using 100% equity per trade is high-risk. Market Conditions: Best in trending markets; may produce false signals in sideways markets. Backtesting: Always test on historical data before live trading.
Disclaimer
This strategy is intended for educational and informational purposes only. Trading involves significant risk, and past performance is not indicative of future results. Assess your financial situation and consult a financial advisor if necessary.
Usage Instructions
1. Apply the Strategy: Add it to your TradingView chart. 2. Configure Inputs: Adjust parameters to suit your style and asset. 3. Analyze Backtest Results: Use the Strategy Tester. 4. Optimize Parameters: Experiment with input values. 5. Risk Management: Evaluate position sizing and incorporate risk controls.
Final Notes
The "PTS - Bollinger Bands with Trailing Stop" strategy provides a framework to leverage momentum breakouts while managing risk through adaptive trailing stops. Customize and test thoroughly to align with your trading objectives.

Fibonacci ATR Fusion - Strategy [presentTrading]Open-script again! This time is also an ATR-related strategy. Enjoy! :)
If you have any questions, let me know, and I'll help make this as effective as possible.
█ Introduction and How It Is Different
The Fibonacci ATR Fusion Strategy is an advanced trading approach that uniquely integrates Fibonacci-based weighted averages with the Average True Range (ATR) to identify and capitalize on significant market trends.
Unlike traditional strategies that rely on single indicators or static parameters, this method combines multiple timeframes and dynamic volatility measurements to enhance precision and adaptability. Additionally, it features a 4-step Take Profit (TP) mechanism, allowing for systematic profit-taking at various levels, which optimizes both risk management and return potential in long and short market positions.
BTCUSD 6hr Performance
█ Strategy, How It Works: Detailed Explanation
The Fibonacci ATR Fusion Strategy utilizes a combination of technical indicators and weighted averages to determine optimal entry and exit points. Below is a breakdown of its key components and operational logic.
🔶 1. Enhanced True Range Calculation
The strategy begins by calculating the True Range (TR) to measure market volatility accurately.
TR = max(High - Low, abs(High - Previous Close), abs(Low - Previous Close))
High and Low: Highest and lowest prices of the current trading period.
Previous Close: Closing price of the preceding trading period.
max: Selects the largest value among the three calculations to account for gaps and limit movements.
🔶 2. Buying Pressure (BP) Calculation
Buying Pressure (BP) quantifies the extent to which buyers are driving the price upwards within a period.
BP = Close - True Low
Close: Current period's closing price.
True Low: The lower boundary determined in the True Range calculation.
🔶 3. Ratio Calculation for Different Periods
To assess the strength of buying pressure relative to volatility, the strategy calculates a ratio over various Fibonacci-based timeframes.
Ratio = 100 * (Sum of BP over n periods) / (Sum of TR over n periods)
n: Length of the period (e.g., 8, 13, 21, 34, 55).
Sum of BP: Cumulative Buying Pressure over n periods.
Sum of TR: Cumulative True Range over n periods.
This ratio normalizes buying pressure, making it comparable across different timeframes.
🔶 4. Weighted Average Calculation
The strategy employs a weighted average of ratios from multiple Fibonacci-based periods to smooth out signals and enhance trend detection.
Weighted Avg = (w1 * Ratio_p1 + w2 * Ratio_p2 + w3 * Ratio_p3 + w4 * Ratio_p4 + Ratio_p5) / (w1 + w2 + w3 + w4 + 1)
w1, w2, w3, w4: Weights assigned to each ratio period.
Ratio_p1 to Ratio_p5: Ratios calculated for periods p1 to p5 (e.g., 8, 13, 21, 34, 55).
This weighted approach emphasizes shorter periods more heavily, capturing recent market dynamics while still considering longer-term trends.
🔶 5. Simple Moving Average (SMA) of Weighted Average
To further smooth the weighted average and reduce noise, a Simple Moving Average (SMA) is applied.
Weighted Avg SMA = SMA(Weighted Avg, m)
- m: SMA period (e.g., 3).
This smoothed line serves as the primary signal generator for trade entries and exits.
🔶 6. Trading Condition Thresholds
The strategy defines specific threshold values to determine optimal entry and exit points based on crossovers and crossunders of the SMA.
Long Condition = Crossover(Weighted Avg SMA, Long Entry Threshold)
Short Condition = Crossunder(Weighted Avg SMA, Short Entry Threshold)
Long Exit = Crossunder(Weighted Avg SMA, Long Exit Threshold)
Short Exit = Crossover(Weighted Avg SMA, Short Exit Threshold)
Long Entry Threshold (T_LE): Level at which a long position is triggered.
Short Entry Threshold (T_SE): Level at which a short position is triggered.
Long Exit Threshold (T_LX): Level at which a long position is exited.
Short Exit Threshold (T_SX): Level at which a short position is exited.
These conditions ensure that trades are only executed when clear trends are identified, enhancing the strategy's reliability.
Previous local performance
🔶 7. ATR-Based Take Profit Mechanism
When enabled, the strategy employs a 4-step Take Profit system to systematically secure profits as the trade moves in the desired direction.
TP Price_1 Long = Entry Price + (TP1ATR * ATR Value)
TP Price_2 Long = Entry Price + (TP2ATR * ATR Value)
TP Price_3 Long = Entry Price + (TP3ATR * ATR Value)
TP Price_1 Short = Entry Price - (TP1ATR * ATR Value)
TP Price_2 Short = Entry Price - (TP2ATR * ATR Value)
TP Price_3 Short = Entry Price - (TP3ATR * ATR Value)
- ATR Value: Calculated using ATR over a specified period (e.g., 14).
- TPxATR: User-defined multipliers for each take profit level.
- TPx_percent: Percentage of the position to exit at each TP level.
This multi-tiered exit strategy allows for partial position closures, optimizing profit capture while maintaining exposure to potential further gains.
█ Trade Direction
The Fibonacci ATR Fusion Strategy is designed to operate in both long and short market conditions, providing flexibility to traders in varying market environments.
Long Trades: Initiated when the SMA of the weighted average crosses above the Long Entry Threshold (T_LE), indicating strong upward momentum.
Short Trades: Initiated when the SMA of the weighted average crosses below the Short Entry Threshold (T_SE), signaling robust downward momentum.
Additionally, the strategy can be configured to trade exclusively in one direction—Long, Short, or Both—based on the trader’s preference and market analysis.
█ Usage
Implementing the Fibonacci ATR Fusion Strategy involves several steps to ensure it aligns with your trading objectives and market conditions.
1. Configure Strategy Parameters:
- Trading Direction: Choose between Long, Short, or Both based on your market outlook.
- Trading Condition Thresholds: Set the Long Entry, Short Entry, Long Exit, and Short Exit thresholds to define when to enter and exit trades.
2. Set Take Profit Levels (if enabled):
- ATR Multipliers: Define how many ATRs away from the entry price each take profit level is set.
- Take Profit Percentages: Allocate what percentage of the position to close at each TP level.
3. Apply to Desired Chart:
- Add the strategy to the chart of the asset you wish to trade.
- Observe the plotted Fibonacci ATR and SMA Fibonacci ATR indicators for visual confirmation.
4. Monitor and Adjust:
- Regularly review the strategy’s performance through backtesting.
- Adjust the input parameters based on historical performance and changing market dynamics.
5. Risk Management:
- Ensure that the sum of take profit percentages does not exceed 100% to avoid over-closing positions.
- Utilize the ATR-based TP levels to adapt to varying market volatilities, maintaining a balanced risk-reward ratio.
█ Default Settings
Understanding the default settings is crucial for optimizing the Fibonacci ATR Fusion Strategy's performance. Here's a precise and simple overview of the key parameters and their effects:
🔶 Key Parameters and Their Effects
1. Trading Direction (`tradingDirection`)
- Default: Both
- Effect: Determines whether the strategy takes both long and short positions or restricts to one direction. Selecting Both allows maximum flexibility, while Long or Short can be used for directional bias.
2. Trading Condition Thresholds
Long Entry (long_entry_threshold = 58.0): Higher values reduce false positives but may miss trades.
Short Entry (short_entry_threshold = 42.0): Lower values capture early short trends but may increase false signals.
Long Exit (long_exit_threshold = 42.0): Exits long positions early, securing profits but potentially cutting trends short.
Short Exit (short_exit_threshold = 58.0): Delays short exits to capture favorable movements, avoiding premature exits.
3. Take Profit Configuration (`useTakeProfit` = false)
- Effect: When enabled, the strategy employs a 4-step TP mechanism to secure profits at multiple levels. By default, it is disabled to allow users to opt-in based on their trading style.
4. ATR-Based Take Profit Multipliers
TP1 (tp1ATR = 3.0): Sets the first TP at 3 ATRs for initial profit capture.
TP2 (tp2ATR = 8.0): Targets larger trends, though less likely to be reached.
TP3 (tp3ATR = 14.0): Optimizes for extreme price moves, seldom triggered.
5. Take Profit Percentages
TP Level 1 (tp1_percent = 12%): Secures 12% at the first TP.
TP Level 2 (tp2_percent = 12%): Exits another 12% at the second TP.
TP Level 3 (tp3_percent = 12%): Closes an additional 12% at the third TP.
6. Weighted Average Parameters
Ratio Periods: Fibonacci-based intervals (8, 13, 21, 34, 55) balance responsiveness.
Weights: Emphasizes recent data for timely responses to market trends.
SMA Period (weighted_avg_sma_period = 3): Smoothens data with minimal lag, balancing noise reduction and responsiveness.
7. ATR Period (`atrPeriod` = 14)
Effect: Sets the ATR calculation length, impacting TP sensitivity to volatility.
🔶 Impact on Performance
- Sensitivity and Responsiveness:
- Shorter Ratio Periods and Higher Weights: Make the weighted average more responsive to recent price changes, allowing quicker trade entries and exits but increasing the likelihood of false signals.
- Longer Ratio Periods and Lower Weights: Provide smoother signals with fewer false positives but may delay trade entries, potentially missing out on significant price moves.
- Profit Taking:
- ATR Multipliers: Higher multipliers set take profit levels further away, targeting larger price movements but reducing the probability of reaching these levels.
- Fixed Percentages: Allocating equal percentages at each TP level ensures consistent profit realization and risk management, preventing overexposure.
- Trade Direction Control:
- Selecting Specific Directions: Restricting trades to Long or Short can align the strategy with market trends or personal biases, potentially enhancing performance in trending markets.
- Risk Management:
- Take Profit Percentages: Dividing the position into smaller percentages at multiple TP levels helps lock in profits progressively, reducing risk and allowing the remaining position to ride further trends.
- Market Adaptability:
- Weighted Averages and ATR: By combining multiple timeframes and adjusting to volatility, the strategy adapts to different market conditions, maintaining effectiveness across various asset classes and timeframes.
---
If you want to know more about ATR, can also check "SuperATR 7-Step Profit".
Enjoy trading.

The Most Powerful TQQQ EMA Crossover Trend Trading StrategyTQQQ EMA Crossover Strategy Indicator
Meta Title: TQQQ EMA Crossover Strategy - Enhance Your Trading with Effective Signals
Meta Description: Discover the TQQQ EMA Crossover Strategy, designed to optimize trading decisions with fast and slow EMA crossovers. Learn how to effectively use this powerful indicator for better trading results.
Key Features
The TQQQ EMA Crossover Strategy is a powerful trading tool that utilizes Exponential Moving Averages (EMAs) to identify potential entry and exit points in the market. Key features of this indicator include:
**Fast and Slow EMAs:** The strategy incorporates two EMAs, allowing traders to capture short-term trends while filtering out market noise.
**Entry and Exit Signals:** Automated signals for entering and exiting trades based on EMA crossovers, enhancing decision-making efficiency.
**Customizable Parameters:** Users can adjust the lengths of the EMAs, as well as take profit and stop loss multipliers, tailoring the strategy to their trading style.
**Visual Indicators:** Clear visual plots of the EMAs and exit points on the chart for easy interpretation.
How It Works
The TQQQ EMA Crossover Strategy operates by calculating two EMAs: a fast EMA (default length of 20) and a slow EMA (default length of 50). The core concept is based on the crossover of these two moving averages:
- When the fast EMA crosses above the slow EMA, it generates a *buy signal*, indicating a potential upward trend.
- Conversely, when the fast EMA crosses below the slow EMA, it produces a *sell signal*, suggesting a potential downward trend.
This method allows traders to capitalize on momentum shifts in the market, providing timely signals for trade execution.
Trading Ideas and Insights
Traders can leverage the TQQQ EMA Crossover Strategy in various market conditions. Here are some insights:
**Scalping Opportunities:** The strategy is particularly effective for scalping in volatile markets, allowing traders to make quick profits on small price movements.
**Swing Trading:** Longer-term traders can use this strategy to identify significant trend reversals and capitalize on larger price swings.
**Risk Management:** By incorporating customizable stop loss and take profit levels, traders can manage their risk effectively while maximizing potential returns.
How Multiple Indicators Work Together
While this strategy primarily relies on EMAs, it can be enhanced by integrating additional indicators such as:
- **Relative Strength Index (RSI):** To confirm overbought or oversold conditions before entering trades.
- **Volume Indicators:** To validate breakout signals, ensuring that price movements are supported by sufficient trading volume.
Combining these indicators provides a more comprehensive view of market dynamics, increasing the reliability of trade signals generated by the EMA crossover.
Unique Aspects
What sets this indicator apart is its simplicity combined with effectiveness. The reliance on EMAs allows for smoother signals compared to traditional moving averages, reducing false signals often associated with choppy price action. Additionally, the ability to customize parameters ensures that traders can adapt the strategy to fit their unique trading styles and risk tolerance.
How to Use
To effectively utilize the TQQQ EMA Crossover Strategy:
1. **Add the Indicator:** Load the script onto your TradingView chart.
2. **Set Parameters:** Adjust the fast and slow EMA lengths according to your trading preferences.
3. **Monitor Signals:** Watch for crossover points; enter trades based on buy/sell signals generated by the indicator.
4. **Implement Risk Management:** Set your stop loss and take profit levels using the provided multipliers.
Regularly review your trading performance and adjust parameters as necessary to optimize results.
Customization
The TQQQ EMA Crossover Strategy allows for extensive customization:
- **EMA Lengths:** Change the default lengths of both fast and slow EMAs to suit different time frames or market conditions.
- **Take Profit/Stop Loss Multipliers:** Adjust these values to align with your risk management strategy. For instance, increasing the take profit multiplier may yield larger gains but could also increase exposure to market fluctuations.
This flexibility makes it suitable for various trading styles, from aggressive scalpers to conservative swing traders.
Conclusion
The TQQQ EMA Crossover Strategy is an effective tool for traders seeking an edge in their trading endeavors. By utilizing fast and slow EMAs, this indicator provides clear entry and exit signals while allowing for customization to fit individual trading strategies. Whether you are a scalper looking for quick profits or a swing trader aiming for larger moves, this indicator offers valuable insights into market trends.
Incorporate it into your TradingView toolkit today and elevate your trading performance!

Bullish B's - RSI Divergence StrategyThis indicator strategy is an RSI (Relative Strength Index) divergence trading tool designed to identify high-probability entry and exit points based on trend shifts. It utilizes both regular and hidden RSI divergence patterns to spot potential reversals, with signals for both bullish and bearish conditions.
Key Features
Divergence Detection:
Bullish Divergence: Signals when RSI indicates momentum strengthening at a lower price level, suggesting a reversal to the upside.
Bearish Divergence: Signals when RSI shows weakening momentum at a higher price level, indicating a potential downside reversal.
Hidden Divergences: Looks for hidden bullish and bearish divergences, which signal trend continuation points where price action aligns with the prevailing trend.
Volume-Adjusted Entry Signals:
The strategy enters long trades when RSI shows bullish or hidden bullish divergence, indicating an upward momentum shift.
An optional volume filter ensures that only high-volume, high-conviction trades trigger a signal.
Exit Signals:
Exits long positions when RSI reaches a customizable overbought level, typically indicating a potential reversal or profit-taking opportunity.
Also closes positions if bearish divergence signals appear after a bullish setup, providing protection against trend reversals.
Trailing Stop-Loss:
Uses a trailing stop mechanism based on ATR (Average True Range) or a percentage threshold to lock in profits as the price moves in favor of the trade.
Alerts and Custom Notifications:
Integrated with TradingView alerts to notify the user when entry and exit conditions are met, supporting timely decision-making without constant monitoring.
Customizable Parameters:
Users can adjust the RSI period, pivot lookback range, overbought level, trailing stop type (ATR or percentage), and divergence range to fit their trading style.
Ideal Usage
This strategy is well-suited for trend traders and swing traders looking to capture reversals and trend continuations on medium to long timeframes. The divergence signals, paired with trailing stops and volume validation, make it adaptable for multiple asset classes, including stocks, forex, and crypto.
Summary
With its focus on RSI divergence, trailing stop-loss management, and volume filtering, this strategy aims to identify and capture trend changes with minimized risk. This allows traders to efficiently capture profitable moves and manage open positions with precision.
This Strategy BEST works with GLD!

Z-Score RSI StrategyOverview
The Z-Score RSI Indicator is an experimental take on momentum analysis. By applying the Relative Strength Index (RSI) to a Z-score of price data, it measures how far prices deviate from their mean, scaled by standard deviation. This isn’t your traditional use of RSI, which is typically based on price data alone. Nevertheless, this unconventional approach can yield unique insights into market trends and potential reversals.
Theory and Interpretation
The RSI calculates the balance between average gains and losses over a set period, outputting values from 0 to 100. Typically, people look at the overbought or oversold levels to identify momentum extremes that might be likely to lead to a reversal. However, I’ve often found that RSI can be effective for trend-following when observing the crossover of its moving average with the midline or the crossover of the RSI with its own moving average. These crossovers can provide useful trend signals in various market conditions.
By combining RSI with a Z-score of price, this indicator estimates the relative strength of the price’s distance from its mean. Positive Z-score trends may signal a potential for higher-than-average prices in the near future (scaled by the standard deviation), while negative trends suggest the opposite. Essentially, when the Z-Score RSI indicates a trend, it reflects that the Z-score (the distance between the average and current price) is likely to continue moving in the trend’s direction. Generally, this signals a potential price movement, though it’s important to note that this could also occur if there’s a shift in the mean or standard deviation, rather than a meaningful change in price itself.
While the Z-Score RSI could be an insightful addition to a comprehensive trading system, it should be interpreted carefully. Mean shifts may validate the indicator’s predictions without necessarily indicating any notable price change, meaning it’s best used in tandem with other indicators or strategies.
Recommendations
Before putting this indicator to use, conduct thorough backtesting and avoid overfitting. The added parameters allow fine-tuning to fit various assets, but be careful not to optimize purely for the highest historical returns. Doing so may create an overly tailored strategy that performs well in backtests but fails in live markets. Keep it balanced and look for robust performance across multiple scenarios, as overfitting is likely to lead to disappointing real-world results.

Equilibrium Candles + Pattern [Honestcowboy]The Equilibrium Candles is a very simple trend continuation or reversal strategy depending on your settings.
How an Equilibrium Candle is created:
We calculate the equilibrium by measuring the mid point between highest and lowest point over X amount of bars back.
This now is the opening price for each bar and will be considered a green bar if price closes above equilibrium.
Bars get shaded by checking if regular candle close is higher than open etc. So you still see what the normal candles are doing.
Why are they useful?
The equilibrium is calculated the same as Baseline in Ichimoku Cloud. Which provides a point where price is very likely to retrace to. This script visualises the distance between close and equilibrium using candles. To provide a clear visual of how price relates to this equilibrium point.
This also makes it more straightforward to develop strategies based on this simple concept and makes the trader purely focus on this relationship and not think of any Ichimoku Cloud theories.
Script uses a very simple pattern to enter trades:
It will count how many candles have been one directional (above or below equilibrium)
Based on user input after X candles (7 by default) script shows we are in a trend (bg colors)
On the first pullback (candle closes on other side of equilibrium) it will look to enter a trade.
Places a stop order at the high of the candle if bullish trend or reverse if bearish trend.
If based on user input after X opposite candles (2 by default) order is not filled will cancel it and look for a new trend.
Use Reverse Logic:
There is a use reverse logic in the settings which on default is turned on. It will turn long orders into short orders making the stop orders become limit orders. It will use the normal long SL as target for the short. And TP as stop for the short. This to provide a means to reverse equity curve in case your pair is mean reverting by nature instead of trending.
ATR Calculation:
Averaged ATR, which is using ta.percentile_nearest_rank of 60% of a normal ATR (14 period) over the last 200 bars. This in simple words finds a value slightly above the mean ATR value over that period.
Big Candle Exit Logic:
Using Averaged ATR the script will check if a candle closes X times that ATR from the equilibrium point. This is then considered an overextension and all trades are closed.
This is also based on user input.
Simple trade management logic:
Checks if the user has selected to use TP and SL, or/and big candle exit.
Places a TP and SL based on averaged ATR at a multiplier based on user Input.
Closes trade if there is a Big Candle Exit or an opposite direction signal from indicator.
Script can be fully automated to MT5
There are risk settings in % and symbol settings provided at the bottom of the indicator. The script will send alert to MT5 broker trying to mimic the execution that happens on tradingview. There are always delays when using a bridge to MT5 broker and there could be errors so be mindful of that. This script sends alerts in format so they can be read by tradingview.to which is a bridge between the platforms.
Use the all alert function calls feature when setting up alerts and make sure you provide the right webhook if you want to use this approach.
There is also a simple buy and sell alert feature if you don't want to fully automate but still get alerts. These are available in the dropdown when creating an alert.
Almost every setting in this indicator has a tooltip added to it. So if any setting is not clear hover over the (?) icon on the right of the setting.
The backtest uses a 4% exposure per trade and a 10 point slippage. I did not include a commission cause I'm not personaly aware what the commissions are on most forex brokers. I'm only aware of minimal slippage to use in a backtest. Trading conditions vary per broker you use so always pay close attention to trading costs on your own broker. Use a full automation at your own risk and discretion and do proper backtesting.

SuperATR 7-Step Profit - Strategy [presentTrading] Long time no see!
█ Introduction and How It Is Different
The SuperATR 7-Step Profit Strategy is a multi-layered trading approach that integrates adaptive Average True Range (ATR) calculations with momentum-based trend detection. What sets this strategy apart is its sophisticated 7-step take-profit mechanism, which combines four ATR-based exit levels and three fixed percentage levels. This hybrid approach allows traders to dynamically adjust to market volatility while systematically capturing profits in both long and short market positions.
Traditional trading strategies often rely on static indicators or single-layered exit strategies, which may not adapt well to changing market conditions. The SuperATR 7-Step Profit Strategy addresses this limitation by:
- Using Adaptive ATR: Enhances the standard ATR by making it responsive to current market momentum.
- Incorporating Momentum-Based Trend Detection: Identifies stronger trends with higher probability of continuation.
- Employing a Multi-Step Take-Profit System: Allows for gradual profit-taking at predetermined levels, optimizing returns while minimizing risk.
BTCUSD 6hr Performance
█ Strategy, How It Works: Detailed Explanation
The strategy revolves around detecting strong market trends and capitalizing on them using an adaptive ATR and momentum indicators. Below is a detailed breakdown of each component of the strategy.
🔶 1. True Range Calculation with Enhanced Volatility Detection
The True Range (TR) measures market volatility by considering the most significant price movements. The enhanced TR is calculated as:
TR = Max
Where:
High and Low are the current bar's high and low prices.
Previous Close is the closing price of the previous bar.
Abs denotes the absolute value.
Max selects the maximum value among the three calculations.
🔶 2. Momentum Factor Calculation
To make the ATR adaptive, the strategy incorporates a Momentum Factor (MF), which adjusts the ATR based on recent price movements.
Momentum = Close - Close
Stdev_Close = Standard Deviation of Close over n periods
Normalized_Momentum = Momentum / Stdev_Close (if Stdev_Close ≠ 0)
Momentum_Factor = Abs(Normalized_Momentum)
Where:
Close is the current closing price.
n is the momentum_period, a user-defined input (default is 7).
Standard Deviation measures the dispersion of closing prices over n periods.
Abs ensures the momentum factor is always positive.
🔶 3. Adaptive ATR Calculation
The Adaptive ATR (AATR) adjusts the traditional ATR based on the Momentum Factor, making it more responsive during volatile periods and smoother during consolidation.
Short_ATR = SMA(True Range, short_period)
Long_ATR = SMA(True Range, long_period)
Adaptive_ATR = /
Where:
SMA is the Simple Moving Average.
short_period and long_period are user-defined inputs (defaults are 3 and 7, respectively).
🔶 4. Trend Strength Calculation
The strategy quantifies the strength of the trend to filter out weak signals.
Price_Change = Close - Close
ATR_Multiple = Price_Change / Adaptive_ATR (if Adaptive_ATR ≠ 0)
Trend_Strength = SMA(ATR_Multiple, n)
🔶 5. Trend Signal Determination
If (Short_MA > Long_MA) AND (Trend_Strength > Trend_Strength_Threshold):
Trend_Signal = 1 (Strong Uptrend)
Elif (Short_MA < Long_MA) AND (Trend_Strength < -Trend_Strength_Threshold):
Trend_Signal = -1 (Strong Downtrend)
Else:
Trend_Signal = 0 (No Clear Trend)
🔶 6. Trend Confirmation with Price Action
Adaptive_ATR_SMA = SMA(Adaptive_ATR, atr_sma_period)
If (Trend_Signal == 1) AND (Close > Short_MA) AND (Adaptive_ATR > Adaptive_ATR_SMA):
Trend_Confirmed = True
Elif (Trend_Signal == -1) AND (Close < Short_MA) AND (Adaptive_ATR > Adaptive_ATR_SMA):
Trend_Confirmed = True
Else:
Trend_Confirmed = False
Local Performance
🔶 7. Multi-Step Take-Profit Mechanism
The strategy employs a 7-step take-profit system
█ Trade Direction
The SuperATR 7-Step Profit Strategy is designed to work in both long and short market conditions. By identifying strong uptrends and downtrends, it allows traders to capitalize on price movements in either direction.
Long Trades: Initiated when the market shows strong upward momentum and the trend is confirmed.
Short Trades: Initiated when the market exhibits strong downward momentum and the trend is confirmed.
█ Usage
To implement the SuperATR 7-Step Profit Strategy:
1. Configure the Strategy Parameters:
- Adjust the short_period, long_period, and momentum_period to match the desired sensitivity.
- Set the trend_strength_threshold to control how strong a trend must be before acting.
2. Set Up the Multi-Step Take-Profit Levels:
- Define ATR multipliers and fixed percentage levels according to risk tolerance and profit goals.
- Specify the percentage of the position to close at each level.
3. Apply the Strategy to a Chart:
- Use the strategy on instruments and timeframes where it has been tested and optimized.
- Monitor the positions and adjust parameters as needed based on performance.
4. Backtest and Optimize:
- Utilize TradingView's backtesting features to evaluate historical performance.
- Adjust the default settings to optimize for different market conditions.
█ Default Settings
Understanding default settings is crucial for optimal performance.
Short Period (3): Affects the responsiveness of the short-term MA.
Effect: Lower values increase sensitivity but may produce more false signals.
Long Period (7): Determines the trend baseline.
Effect: Higher values reduce noise but may delay signals.
Momentum Period (7): Influences adaptive ATR and trend strength.
Effect: Shorter periods react quicker to price changes.
Trend Strength Threshold (0.5): Filters out weaker trends.
Effect: Higher thresholds yield fewer but stronger signals.
ATR Multipliers: Set distances for ATR-based exits.
Effect: Larger multipliers aim for bigger moves but may reduce hit rate.
Fixed TP Levels (%): Control profit-taking on smaller moves.
Effect: Adjusting these levels affects how quickly profits are realized.
Exit Percentages: Determine how much of the position is closed at each TP level.
Effect: Higher percentages reduce exposure faster, affecting risk and reward.
Adjusting these variables allows you to tailor the strategy to different market conditions and personal risk preferences.
By integrating adaptive indicators and a multi-tiered exit strategy, the SuperATR 7-Step Profit Strategy offers a versatile tool for traders seeking to navigate varying market conditions effectively. Understanding and adjusting the key parameters enables traders to harness the full potential of this strategy.

DSL Strategy [DailyPanda]
Overview
The DSL Strategy by DailyPanda is a trading strategy that synergistically combines the idea from indicators to create a more robust and reliable trading tool. By integrating these indicators, the strategy enhances signal accuracy and provides traders with a comprehensive view of market trends and momentum shifts. This combination allows for better entry and exit points, improved risk management, and adaptability to various market conditions.
Combining ideas from indicators adds value by:
Enhancing Signal Confirmation : The strategy requires alignment between trend and momentum before generating trade signals, reducing false entries.
Improving Accuracy : By integrating price action with momentum analysis, the strategy captures more reliable trading opportunities.
Providing Comprehensive Market Insight : The combination offers a better perspective on the market, considering both the direction (trend) and the strength (momentum) of price movements.
How the Components Work Together
1. Trend Identification with DSL Indicator
Dynamic Signal Lines : Calculates upper and lower DSL lines based on a moving average (SMA) and dynamic thresholds derived from recent highs and lows with a specified offset. These lines adapt to market conditions, providing real-time trend insights.
ATR-Based Bands : Adds bands around the DSL lines using the Average True Range (ATR) multiplied by a width factor. These bands account for market volatility and help identify potential stop-loss levels.
Trend Confirmation : The relationship between the price, DSL lines, and bands determines the current trend. For example, if the price consistently stays above the upper DSL line, it indicates a bullish trend.
2. Momentum Analysis
RSI Calculation : Computes the RSI over a specified period to measure the speed and change of price movements.
Zero-Lag EMA (ZLEMA) : Applies a ZLEMA to the RSI to minimize lag and produce a more responsive oscillator.
DSL Application on Oscillator : Implements the DSL concept on the oscillator by calculating dynamic upper and lower levels. This helps identify overbought or oversold conditions more accurately.
Signal Generation : Detects crossovers between the oscillator and its DSL lines. A crossover above the lower DSL line signals potential bullish momentum, while a crossover below the upper DSL line signals potential bearish momentum.
3. Integrated Signal Filtering
Confluence Requirement : A trade signal is generated only when both the DSL indicator and oscillator agree. For instance, a long entry requires both an uptrend confirmation from the DSL indicator and a bullish momentum signal from the oscillator.
Risk Management Integration : The strategy uses the DSL indicator's bands for setting stop-loss levels and calculates take-profit levels based on a user-defined risk-reward ratio. This ensures that every trade has a predefined risk management plan.
--------------------------------------------------------------------------------------------
Originality and Value Added to the Community
Unique Synergy : While both indicators are available individually, this strategy is original in how it combines them to enhance their strengths and mitigate their weaknesses, offering a novel approach not present in existing scripts.
Enhanced Reliability : By requiring confirmation from both trend and momentum indicators, the strategy reduces false signals and increases the likelihood of successful trades.
Versatility : The customizable parameters allow traders to adapt the strategy to different instruments, timeframes, and trading styles, making it a valuable tool for a wide range of trading scenarios.
Educational Contribution : The script demonstrates an effective method of combining indicators for improved trading performance, providing insights that other traders can learn from and apply to their own strategies.
--------------------------------------------------------------------------------------------
How to Use the Strategy
Adding the Strategy to Your Chart
Apply the DSL Strategy to your desired trading instrument and timeframe on TradingView.
--------------------------------------------------------------------------------------------
Configuring Parameters
DSL Indicator Settings :
Length (len) : Adjusts the sensitivity of the DSL lines (default is 34).
Offset : Determines the look-back period for threshold calculations (default is 30).
Bands Width (width) : Changes the distance of the ATR-based bands from the DSL lines (default is 1).
DSL-BELUGA Oscillator Settings :
Beluga Length (len_beluga) : Sets the period for the RSI calculation in the oscillator (default is 10).
DSL Lines Mode (dsl_mode) : Chooses between "Fast" (more responsive) and "Slow" (smoother) modes for the oscillator's DSL lines.
Risk Management :
Risk Reward (risk_reward) : Defines your desired risk-reward ratio for calculating take-profit levels (default is 1.5).
--------------------------------------------------------------------------------------------
Interpreting Signals
Long Entry Conditions :
Trend Confirmation : Price is above the upper DSL line and the upper DSL band (dsl_up1 > dsl_dn).
Price Behavior : The last three candles have both their opens and closes above the upper DSL line.
Momentum Signal : The DSL-BELUGA oscillator crosses above its lower DSL line (up_signal), indicating bullish momentum.
Short Entry Conditions :
Trend Confirmation : Price is below the lower DSL line and the lower DSL band (dsl_dn < dsl_up1).
Price Behavior : The last three candles have both their opens and closes below the lower DSL band.
Momentum Signal : The DSL-BELUGA oscillator crosses below its upper DSL line (dn_signal), indicating bearish momentum.
Exit Conditions :
Stop-Loss : Automatically set at the DSL indicator's band level (upper band for longs, lower band for shorts).
Take-Profit : Calculated based on the risk-reward ratio and the initial risk determined by the stop-loss distance.
Visual Aids
Signal Arrows : Upward green arrows for long entries and downward blue arrows for short entries appear on the chart when conditions are met.
Stop-Loss and Take-Profit Lines : Red and green lines display the calculated stop-loss and take-profit levels for active trades.
Background Highlighting : The chart background subtly changes color to indicate when a signal has been generated.
Backtesting and Optimization
Use TradingView's strategy tester to backtest the strategy over historical data.
Adjust parameters to optimize performance for different instruments or market conditions.
Regularly review backtesting results to ensure the strategy remains effective.

RVI Crossover Strategy[Kopottaja]Overview of the RVI Crossover Strategy
Strategy Name: RVI Crossover Strategy
Purpose: The RVI Crossover Strategy is based on the crossover signals between the Relative Vigor Index (RVI) and its moving average signal line. This strategy aims to identify potential buy and sell signals by evaluating the market’s directional trend.
Key Indicator Features
Relative Vigor Index (RVI): This indicator measures the momentum of price changes over a specified period and helps identify the market’s current trend. The RVI is based on the idea that prices generally close higher than they open in an uptrend (and lower in a downtrend). The RVI helps provide an indication of the strength and direction of a trend.
Signal Line: A moving average (e.g., SMA) is applied to the RVI values, creating a "signal line." When the RVI crosses above or below this line, it signals a potential trading opportunity.
Calculations and Settings
Calculating the RVI: The RVI is calculated by comparing the difference between the close and open prices to the difference between high and low prices. This provides information about the direction and momentum of price movement:
RVI= Sum(SWMA(high−low))Sum(SWMA(close−open))
where SWMA is a smoothed weighted moving average over a specified period.
Signal Line Calculation: The RVI value is smoothed by applying a simple moving average (SMA) to create the signal line. This signal line helps filter crossover signals for improved accuracy.
Buy and Sell Conditions: Buy and sell conditions are identified based on crossovers between the RVI and its signal line.
Buy Signal: A buy condition is triggered when the RVI crosses above the signal line, provided that the "Bearish" condition (trend confirmation) is met.
Sell Signal: A sell condition occurs when the RVI crosses below the signal line, alongside the "Bullish" trend confirmation.
Volume-Weighted Moving Averages (VWMA): VWMA indicators are used to assess price-volume relationships over different timeframes:
Fast VWMA: A short-period volume-weighted moving average.
Slow VWMA: A longer-period volume-weighted moving average. These values are used to strengthen the buy and sell conditions by confirming trend directions (Bullish or Bearish).
Disclaimer: This is an educational and informational tool. Past performance is not indicative of future results. Always backtest before using in live markets
Price Action StrategyThe **Price Action Strategy** is a tool designed to capture potential market reversals by utilizing classic reversal candlestick patterns such as Hammer, Shooting Star, Doji, and Pin Bar near dinamic support and resistance levels.
***Note to moderators
- The moving average was removed from the strategy because it was not suitable for the strategy and not participating in the entry or exit criteria.
- The moving average length has been replaced/renamed by the support/resistance lenght.
- The bullish engulfing and bearish engulfing patterns were also removed because in practice they were not working as entry criteria, since the candle price invariably closes far from the support/resistance level even considering the sensitivity range. There was no change in the backtest results after removing these patterns.
### Key Elements of the Strategy
1. Support and Resistance Levels
- Support and resistance are pivotal price levels where the asset has previously struggled to move lower (support) or higher (resistance). These levels act as psychological barriers where buying interest (at support) or selling interest (at resistance) often increases, potentially causing price reversals.
- In this strategy, support is calculated as the lowest low and resistance as the highest high over a 16-period length. When the price nears these levels, it indicates possible zones for a reversal, and the strategy looks for specific candlestick patterns to confirm an entry.
2. Candlestick Patterns
- This strategy uses classic reversal patterns, including:
- **Hammer**: Indicates a buy signal, suggesting rejection of lower prices.
- **Shooting Star**: Suggests a sell signal, showing rejection of higher prices.
- **Doji**: Reflects indecision and potential reversal.
- **Pin Bar**: Represents price rejection with a long shadow, often signaling a reversal.
By combining these reversal patterns with the proximity to dinamic support or resistance levels, the strategy aims to capture potential reversal movements.
3. Sensitivity Level
- The sensitivity parameter adjusts the acceptable range (Default 0.018 = 1.8%) around support and resistance levels within which reversal patterns can trigger trades (i.e. the closing price of the candle must occur within the specified range defined by the sensitivity parameter). A higher sensitivity value expands this range, potentially leading to less accurate signals, as it may allow for more false positives.
4. Entry Criteria
- **Buy (Long)**: A Hammer, Doji, or Pin Bar pattern near support.
- **Sell (Short)**: A Shooting Star, Doji, or Pin Bar near resistance.
5. Exit criteria
- Take profit = 9.5%
- Stop loss = 16%
6. No Repainting
- The Price Action Strategy is not subject to repainting.
7. Position Sizing by Equity and risk management
- This strategy has a default configuration to operate with 35% of the equity. The stop loss is set to 16% from the entry price. This way, the strategy is putting at risk about 16% of 35% of equity, that is, around 5.6% of equity for each trade. The percentage of equity and stop loss can be adjusted by the user according to their risk management.
8. Backtest results
- This strategy was subjected to deep backtest and operations in replay mode on **1000000MOGUSDT.P**, with the inclusion of transaction fees at 0.12% and slipagge of 5 ticks, and the past results have shown consistent profitability. Past results are no guarantee of future results. The strategy's backtest results may even be due to overfitting with past data.
9. Chart Visualization
- Support and resistance levels are displayed as green (support) and red (resistance) lines.
- Only the candlestick pattern that generated the entry signal to triger the trade is identified and labeled on the chart. During the operation, the occurrence of new Doji, Pin Bar, Hammer and Shooting Star patterns will not be demonstrated on the chart, since the exit criteria are based on percentage take profit and stop loss.
Doji:
Pin Bar and Doji
Shooting Star and Doji
Hammer
10. Default settings
Chart timeframe: 20 min
Moving average lenght: 16
Sensitivity: 0.018
Stop loss (%): 16
Take Profit (%): 9.5
BYBIT:1000000MOGUSDT.P

Supertrend StrategyThe Supertrend Strategy was created based on the Supertrend and Relative Strength Index (RSI) indicators, widely respected tools in technical analysis. This strategy combines these two indicators to capture market trends with precision and reliability, looking for optimizing exit levels at oversold or overbought price levels.
The Supertrend indicator identifies trend direction based on price and volatility by using the Average True Range (ATR). The ATR measures market volatility by calculating the average range between an asset’s high and low prices over a set period. It provides insight into price fluctuations, with higher ATR values indicating increased volatility and lower values suggesting stability. The Supertrend Indicator plots a line above or below the price, signaling potential buy or sell opportunities: when the price closes above the Supertrend line, an uptrend is indicated, while a close below the line suggests a downtrend. This line shifts as price movements and volatility levels change, acting as both a trailing stop loss and trend confirmation.
To enhance the Supertrend strategy, the Relative Strength Index (RSI) has been added as an exit criterion. As a momentum oscillator, the RSI indicates overbought (usually above 70) or oversold (usually below 30) conditions. This integration allows trades to close when the asset is overbought or oversold, capturing gains before a possible reversal, even if the percentage take profit level has not been reached. This mechanism aims to prevent losses due to market reversals before the Supertrend signal changes.
### Key Features
1. **Entry criteria**:
- The strategy uses the Supertrend indicator calculated by adding or subtracting a multiple of the ATR from the closing price, depending on the trend direction.
- When the price crosses above the Supertrend line, the strategy signals a long (buy) entry. Conversely, when the price crosses below, it signals a short (sell) entry.
- The strategy performs a reversal if there is an open position and a change in the direction of the supertrend occurs
2. **Exit criteria**:
- Take profit of 30% (default) on the average position price.
- Oversold (≤ 5) or overbought (≥ 95) RSI
- Reversal when there is a change in direction of the Supertrend
3. **No Repainting**:
- This strategy is not subject to repainting, as long as the timeframe configured on your chart is the same as the supertrend timeframe .
4. **Position Sizing by Equity and risk management**:
- This strategy has a default configuration to operate with 35% of the equity. At the time of opening the position, the supertrend line is typically positioned at about 12 to 16% of the entry price. This way, the strategy is putting at risk about 16% of 35% of equity, that is, around 5.6% of equity for each trade. The percentage of equity can be adjusted by the user according to their risk management.
5. **Backtest results**:
- This strategy was subjected to deep backtesting and operations in replay mode, including transaction fees of 0.12%, and slippage of 5 ticks.
- The past results in deep backtest and replay mode were compatible and profitable (Variable results depending on the take profit used, supertrend and RSI parameters). However, it should be noted that few operations were evaluated, since the currency in question has been created for a short time and the frequency of operations is relatively small.
- Past results are no guarantee of future results. The strategy's backtest results may even be due to overfitting with past data.
Default Settings
Chart timeframe: 2h
Supertrend Factor: 3.42
ATR period: 14
Supertrend timeframe: 2 h
RSI timeframe: 15 min
RSI Lenght: 5 min
RSI Upper limit: 95
RSI Lower Limit: 5
Take Profit: 30%
BYBIT:1000000MOGUSDT.P

Universal Trend Following Strategy | QuantumRsearchUniversal All Assets Strategy by Rocheur
The Universal All Assets Strategy is a cutting-edge, trend-following algorithm designed to operate seamlessly across multiple asset classes, including equities, commodities, forex, and cryptocurrencies. This strategy leverages the power of eight unique indicators, offering traders robust, adaptive signals. Its dynamic logic, combined with a comprehensive risk management framework, allows for precision trading in a variety of market conditions.
Core Methodologies and Features
1. Eight Integrated Trend Indicators
At the heart of the Universal All Assets Strategy are eight sophisticated trend-following indicators, each designed to capture different facets of market behavior. These indicators work together to provide a multi-dimensional analysis of price trends, filtering out noise and reacting only to significant movements:
Directional Moving Averages : Tracks the primary market trend, offering a clear indication of long-term price direction, ideal for identifying sustained upward or downward movements.
Smoothed Moving Averages : Reduces short-term volatility and noise to reveal the underlying trend, enhancing signal clarity and helping traders avoid reacting to temporary price spikes.
RSI Loops : Utilizes the Relative Strength Index (RSI) to assess market momentum, using a unique for loop mechanism to smooth out data and enhance precision.
Supertrend Filters : This indicator dynamically adjusts to market volatility, closely following price action to detect significant breakouts or reversals. The Supertrend is a core component for identifying shifts in trend direction with minimal lag.
RVI for Loop : The Relative Volatility Index (RVI) measures the strength of market volatility. It is optimized with a for loop mechanism, which smooths out the data and improves directional cues, especially in choppy or sideways markets.
Hull for Loop : The Hull Moving Average is designed to minimize lag while offering a smooth, responsive trend line. The for loop mechanism further enhances this by making the Hull even more sensitive to trend shifts, ensuring faster reaction to market movements without generating excessive noise.
These indicators evaluate market conditions independently, assigning a score of 1 for bullish trends and -1 for bearish trends. The average score across all eight indicators is calculated for each time frame (or bar), and this score determines whether the strategy should enter, exit, or remain neutral in a trade.
2. Scoring and Signal Confirmation
The strategy’s confirmation system ensures that trades are initiated only when there is strong alignment across multiple indicators:
A Long Position (Buy) is initiated when the majority of indicators generate a bullish signal, i.e., the average score exceeds a predefined upper threshold.
A Short Position or Exit is triggered when the average score falls below a lower threshold, signaling a bearish trend or neutral market.
By using a majority-rule confirmation system, the strategy filters out weak signals, reducing the chances of reacting to market noise or false positives. This ensures that only robust trends—those supported by multiple indicators—trigger trades.
Adaptive Logic for All Asset Classes
The Universal All Assets Strategy stands out for its ability to adapt dynamically across different asset classes. Whether it’s applied to highly volatile assets like cryptocurrencies or more stable instruments like equities, the strategy fine-tunes its behavior to match the asset’s volatility profile and price behavior.
Volatility Filters : The system incorporates volatility-sensitive filters, such as the Average True Range (ATR) and standard deviation metrics, which dynamically adjust its sensitivity based on market conditions. This ensures the strategy remains responsive to significant price movements while filtering out inconsequential fluctuations.
This adaptability makes the Universal All Assets Strategy effective across diverse markets, providing consistent performance whether the market is trending, range-bound, or experiencing high volatility.
Customization and Flexibility
1. Directional Bias
The strategy offers traders the flexibility to set a customizable directional bias, allowing it to focus on:
Long-only trades during bullish markets.
Short-only trades during bear markets.
Bi-directional trades for those looking to capitalize on both uptrends and downtrends.
This bias can be fine-tuned based on market conditions, trader preference, or risk tolerance, without compromising the integrity of the overall signal-generation process.
2. Volatility Sensitivity
Traders can adjust the strategy’s volatility sensitivity through customizable settings. By modifying how the system reacts to volatility, traders can make the strategy more aggressive in high-volatility environments or more conservative in quieter markets, depending on their individual trading style.
Visual Representation of Component Behavior
One of the unique features of the strategy is its real-time visual representation of the eight indicators through a component table displayed on the chart. This table provides a clear overview of the current status of each indicator:
A score of 1 indicates a bullish signal.
A score of -1 indicates a bearish signal.
The table is updated at each time frame (bar), showing how each indicator is contributing to the overall trend decision. This real-time feedback allows traders to monitor the exact composition of the strategy’s signal, helping them better understand market dynamics.
Oscillator Visualization for Trend Detection
To complement the component table, the strategy includes a trend oscillator displayed beneath the price chart, offering a visual summary of the overall market direction:
Green bars represent bullish trends when the majority of indicators signal an uptrend.
Red bars represent bearish trends or a neutral (cash) position when the majority of indicators detect a downtrend.
This oscillator allows traders to quickly assess the market’s overall direction at a glance, without needing to analyze each individual indicator, providing a clear and immediate visual of the market trend.
Backtested and Forward-Tested for Real-World Conditions
The Universal All Assets Strategy has been thoroughly tested under real-world trading conditions, incorporating key factors like:
Slippage : Set at 20 ticks to represent real market fluctuations.
Order Size : Calculated as 10% of equity, ensuring appropriate risk exposure for realistic capital management.
Commission : A fee of 0.05% has been factored in to account for trading costs.
These settings ensure that the strategy’s performance metrics—such as the Sortino Ratio , Sharpe Ratio , Omega Ratio , and Profit Factor —are reflective of actual trading environments. The rigorous backtesting and forward-testing processes ensure that the strategy produces realistic results, making it compatible with the markets it is written for and demonstrating how the system would behave in live conditions. It also includes robust risk management tools to minimize drawdowns and preserve capital, making it suitable for both professional and retail traders.
Anti-Fragile Design and Realistic Expectations
The Universal All Assets Strategy is engineered to be anti-fragile, thriving in volatile markets by adjusting to turbulence rather than being damaged by it. This is a crucial feature that ensures the strategy remains effective even during times of significant market instability.
Moreover, the strategy is transparent about realistic expectations, acknowledging that no system can guarantee a 100% win rate and that past performance is not indicative of future results. This transparency fosters trust and provides traders with a realistic framework for long-term success, making it an ideal choice for traders looking to navigate complex market conditions with confidence.
Acknowledgment of External Code
Special credit goes to bii_vg, whose invite-only code was used with permission in the development of the Universal All Assets Strategy. Their contributions have been instrumental in refining certain aspects of this strategy, ensuring its robustness and adaptability across various markets.
Conclusion
The Universal All Assets Strategy by Rocheur offers traders a powerful, adaptable tool for capturing trends across a wide range of asset classes. Its eight-indicator confirmation system, combined with customizable settings and real-time visual representations, provides a comprehensive solution for traders seeking precision, flexibility, and consistency. Whether used in high-volatility markets or more stable environments, the strategy’s dynamic adaptability, transparent logic, and robust testing make it an excellent choice for traders aiming to maximize performance while managing risk effectively.

Oscillator Price Divergence & Trend Strategy (DPS) // AlgoFyreThe Oscillator Price Divergence & Trend Strategy (DPS) strategy combines price divergence and trend indicators for trend trading. It uses divergence conditions to identify entry points and a trend source for directional bias. The strategy incorporates risk management through dynamic position sizing based on a fixed risk amount. It allows for both long and short positions with customizable stop-loss and take-profit levels. The script includes visualization options for entry, stop-loss, and take-profit levels, enhancing trade analysis.
TABLE OF CONTENTS
🔶 ORIGINALITY
🔸Divergence-Trend Combination
🔸Dynamic Position Sizing
🔸Customizable Risk Management
🔶 FUNCTIONALITY
🔸Indicators
🞘 Trend Indicator
🞘 Oscillator Source
🔸Conditions
🞘 Long Entry
🞘 Short Entry
🞘 Take Profit
🞘 Stop Loss
🔶 INSTRUCTIONS
🔸Adding the Strategy to the Chart
🔸Configuring the Strategy
🔸Backtesting and Practice
🔸Market Awareness
🔸Visual Customization
🔶 CONCLUSION
▅▅▅▅▅▅▅▅▅▅▅▅▅▅▅▅▅▅▅▅▅▅▅▅▅▅▅▅▅▅▅▅▅▅▅▅▅▅▅▅▅▅▅▅▅
🔶 ORIGINALITY The Divergence Trend Trading with Dynamic Position Sizing strategy uniquely combines price divergence indicators with trend analysis to optimize entry and exit points. Unlike static trading strategies, it employs dynamic position sizing based on a fixed risk amount, ensuring consistent risk management. This approach allows traders to adapt to varying market conditions by adjusting position sizes according to predefined risk parameters, enhancing both flexibility and control in trading decisions. The strategy's integration of customizable stop-loss and take-profit levels further refines its risk management capabilities, making it a robust tool for both trending and volatile markets.
🔸Divergence-Trend Combination By combining trend direction with divergence conditions, the strategy enhances the accuracy of entry signals, aligning trades with prevailing market trends.
🔸Dynamic Position Sizing This strategy calculates position sizes dynamically, based on a fixed risk amount, allowing traders to maintain consistent risk exposure across trades.
🔸Customizable Risk Management Traders can set flexible risk-reward ratios and adjust stop-loss and take-profit levels, tailoring the strategy to their risk tolerance and market conditions.
🔶 FUNCTIONALITY The Divergence Trend Trading with Dynamic Position Sizing strategy leverages a combination of trend indicators and price and oscillator divergences to identify optimal trading opportunities. This strategy is designed to capitalize on medium to long-term price movements and works best on h1, h4 or D1 timeframes. It allows traders to manage risk effectively while taking advantage of both long and short positions.
🔸Indicators 🞘 Trend Indicator: A long trend is used to determine market direction, ensuring trades align with prevailing trends.
Recommendation: We recommend using the Adaptive MAs (Hurst, CVaR, Fractal) // AlgoFyre indicator with the following settings for trend detection. However, you can use any trend indicator that suits your trading style, e.g. an EMA 200.
🞘 Oscillator Source: The oscillator source is used for momentum price divergence identification. Any momentum oscillator can be used, e.g. RSI, Stochastic etc. A good oscillator is the Stochastic with the following settings:
🔸Conditions 🞘 Long Entry: A long entry condition is met if price closes above the trend AND selected divergence conditions are met, e.g. regular bullish divergence with a 10 bar lookback period with the divergence being below the 50 point mean. If the info table shows all 3 columns in the same color, the entry conditions are met and a position is opened.
🞘 Short Entry: A short entry condition is met if price closes below the trend AND selected divergence conditions are met, e.g. regular bearish divergence with a 10 bar lookback period with the divergence being above the 50 point mean.
🞘 Take Profit: Take Profit is determined by the Risk to Reward Ratio settings depending on the price distance between the entry price and the stop loss price, e.g. if stop loss is 1% away from entry and Risk Reward Ratio is 3:1 then Take Profit will be set at 3% from entry.
🞘 Stop Loss: Stop loss is a fixed level away from the trend source. For long positions, stop loss is set below the trend, and for short positions, above the trend.
🔶 INSTRUCTIONS The Divergence Trend Trading with Dynamic Position Sizing strategy can be set up by adding it to your TradingView chart and configuring parameters such as the oscillator source, trend source, and risk management settings. This strategy is designed to capitalize on short-term price movements by dynamically adjusting position sizes based on predefined risk parameters. Enhance the accuracy of signals by combining this strategy with additional indicators like trend-following or momentum-based tools. Adjust settings to better manage risk and optimize entry and exit points.
🔸Adding the Strategy to the Chart:
Go to your TradingView chart.
Click on the "Indicators" button at the top.
Search for "Divergence Trend Trading with Dynamic Position Sizing // AlgoFyre" in the indicators list.
Click on the strategy to add it to your chart.
🔸Configuring the Strategy:
Open the strategy settings by clicking on the gear icon next to its name on the chart.
Oscillator Source: Select the source for the oscillator. An oscillator like Stochastic needs to be attached to the chart already in order to be used as an oscillator source to be selectable.
Trend Source: Choose the trend source to determine market direction. A trend indicator like Adaptive MAs (Hurst, CVaR, Fractal) // AlgoFyre needs to be attached to the chart already in order to be used as a trend source to be selectable.
Stop Loss Percentage: Set the stop loss distance from the trend source as a percentage.
Risk/Reward Ratio: Define the desired risk/reward ratio for trades.
🔸Backtesting and Practice:
Backtest the strategy on historical data to understand how it performs in various market environments.
Practice using the strategy on a demo account before implementing it in live trading.
🔸Market Awareness:
Keep an eye on market news and events that might cause extreme price movements. The strategy reacts to price data and might not account for news-driven events that can cause large deviations.
🔸Visual Customization Visualization Settings: Customize the display of entry price, take profit, and stop loss levels.
Color Settings: Switch to the AlgoFyre theme or set custom colors for bullish, bearish, and neutral states.
Table Settings: Enable or disable the information table and adjust its position.
🔶 CONCLUSION
The Divergence Trend Trading with Dynamic Position Sizing strategy provides a robust framework for capitalizing on short-term market trends by combining price divergence with dynamic position sizing. This strategy leverages divergence conditions to identify entry points and utilizes a trend source for directional bias, ensuring trades align with prevailing market conditions. By incorporating dynamic position sizing based on a fixed risk amount, traders can effectively manage risk and adapt to varying market conditions. The strategy's customizable stop-loss and take-profit levels further enhance its risk management capabilities, making it a versatile tool for both trending and volatile markets. With its strategic blend of technical indicators and risk management, the Divergence Trend Trading strategy offers traders a comprehensive approach to optimizing trade execution and maximizing potential returns.
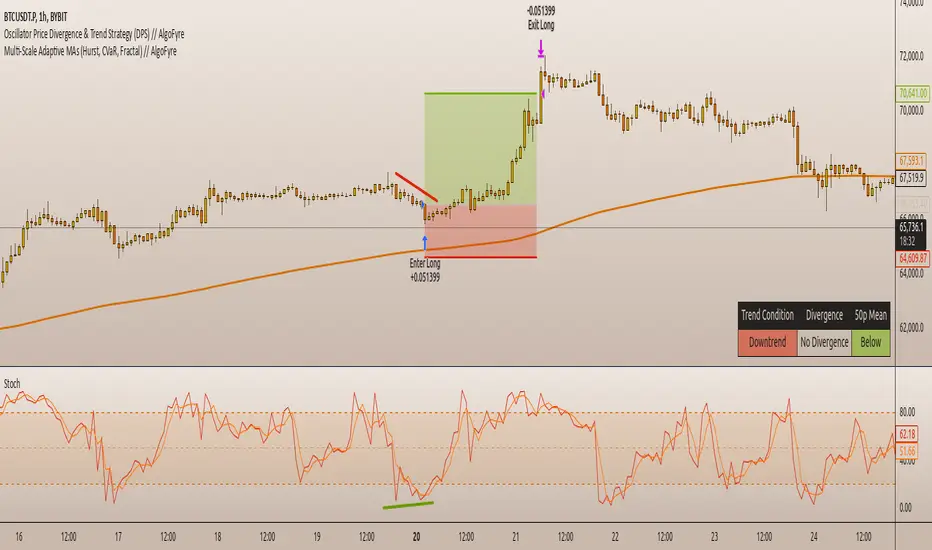
Ultimate Oscillator Trading StrategyThe Ultimate Oscillator Trading Strategy implemented in Pine Script™ is based on the Ultimate Oscillator (UO), a momentum indicator developed by Larry Williams in 1976. The UO is designed to measure price momentum over multiple timeframes, providing a more comprehensive view of market conditions by considering short-term, medium-term, and long-term trends simultaneously. This strategy applies the UO as a mean-reversion tool, seeking to capitalize on temporary deviations from the mean price level in the asset’s movement (Williams, 1976).
Strategy Overview:
Calculation of the Ultimate Oscillator (UO):
The UO combines price action over three different periods (short-term, medium-term, and long-term) to generate a weighted momentum measure. The default settings used in this strategy are:
Short-term: 6 periods (adjustable between 2 and 10).
Medium-term: 14 periods (adjustable between 6 and 14).
Long-term: 20 periods (adjustable between 10 and 20).
The UO is calculated as a weighted average of buying pressure and true range across these periods. The weights are designed to give more emphasis to short-term momentum, reflecting the short-term mean-reversion behavior observed in financial markets (Murphy, 1999).
Entry Conditions:
A long position is opened when the UO value falls below 30, indicating that the asset is potentially oversold. The value of 30 is a common threshold that suggests the price may have deviated significantly from its mean and could be due for a reversal, consistent with mean-reversion theory (Jegadeesh & Titman, 1993).
Exit Conditions:
The long position is closed when the current close price exceeds the previous day’s high. This rule captures the reversal and price recovery, providing a defined point to take profits.
The use of previous highs as exit points aligns with breakout and momentum strategies, as it indicates sufficient strength for a price recovery (Fama, 1970).
Scientific Basis and Rationale:
Momentum and Mean-Reversion:
The strategy leverages two well-established phenomena in financial markets: momentum and mean-reversion. Momentum, identified in earlier studies like those by Jegadeesh and Titman (1993), describes the tendency of assets to continue in their direction of movement over short periods. Mean-reversion, as discussed by Poterba and Summers (1988), indicates that asset prices tend to revert to their mean over time after short-term deviations. This dual approach aims to buy assets when they are temporarily oversold and capitalize on their return to the mean.
Multi-timeframe Analysis:
The UO’s incorporation of multiple timeframes (short, medium, and long) provides a holistic view of momentum, unlike single-period oscillators such as the RSI. By combining data across different timeframes, the UO offers a more robust signal and reduces the risk of false entries often associated with single-period momentum indicators (Murphy, 1999).
Trading and Market Efficiency:
Studies in behavioral finance, such as those by Shiller (2003), show that short-term inefficiencies and behavioral biases can lead to overreactions in the market, resulting in price deviations. This strategy seeks to exploit these temporary inefficiencies, using the UO as a signal to identify potential entry points when the market sentiment may have overly pushed the price away from its average.
Strategy Performance:
Backtests of this strategy show promising results, with profit factors exceeding 2.5 when the default settings are optimized. These results are consistent with other studies on short-term trading strategies that capitalize on mean-reversion patterns (Jegadeesh & Titman, 1993). The use of a dynamic, multi-period indicator like the UO enhances the strategy’s adaptability, making it effective across different market conditions and timeframes.
Conclusion:
The Ultimate Oscillator Trading Strategy effectively combines momentum and mean-reversion principles to trade on temporary market inefficiencies. By utilizing multiple periods in its calculation, the UO provides a more reliable and comprehensive measure of momentum, reducing the likelihood of false signals and increasing the profitability of trades. This aligns with modern financial research, showing that strategies based on mean-reversion and multi-timeframe analysis can be effective in capturing short-term price movements.
References:
Fama, E. F. (1970). Efficient Capital Markets: A Review of Theory and Empirical Work. The Journal of Finance, 25(2), 383-417.
Jegadeesh, N., & Titman, S. (1993). Returns to Buying Winners and Selling Losers: Implications for Stock Market Efficiency. The Journal of Finance, 48(1), 65-91.
Murphy, J. J. (1999). Technical Analysis of the Financial Markets: A Comprehensive Guide to Trading Methods and Applications. New York Institute of Finance.
Poterba, J. M., & Summers, L. H. (1988). Mean Reversion in Stock Prices: Evidence and Implications. Journal of Financial Economics, 22(1), 27-59.
Shiller, R. J. (2003). From Efficient Markets Theory to Behavioral Finance. Journal of Economic Perspectives, 17(1), 83-104.
Williams, L. (1976). Ultimate Oscillator. Market research and technical trading analysis.

Premium Signal Strategy [BRTLab]🔍 Overview
BRTLab Premium Signal Strategy is a comprehensive multi-indicator trading strategy based on the integration of key technical indicators such as ADX, RSX, CAND, V9, PP, MA, and LVL. The strategy allows users to flexibly adjust the parameters of each indicator to optimize for specific market conditions, making it effective for both trending markets and for identifying reversals and breakouts.
🌟 What makes this strategy unique is its seamless compatibility with the BRT Premium Signals tool, allowing traders not only to receive real-time signals but also to conduct robust backtests. This feature enables users to fine-tune the best parameter settings or even test out their own trading ideas through historical data analysis. The ability to backtest empowers traders to validate strategies before going live, significantly improving the chances of success by offering data-driven insights.
💡 Signal Logic:
ADX
The ADX-based signals reflect the strength of market trends. Bullish or bearish signals are generated when directional indicators (+DI or -DI) show increasing strength relative to one another, indicating the start or continuation of a strong trend.
RSX
These signals focus on divergences within RSI, identifying potential reversals by detecting either classic or hidden divergences when the market is overbought or oversold.
V9
Signals are generated when the price interacts with a dynamic threshold, indicating trend continuation or reversal. Additional filters can be applied to refine these signals further, enhancing the dashboard's overall effectiveness.
CAND
Candlestick-based signals are triggered by key patterns such as bullish or bearish engulfing formations. These signals are cross-checked with other conditions, such as RSI levels and candle stability, making them especially useful for short-term trading.
PP (Pivot Points)
Pivot Point signals reinforce candlestick patterns by aligning with key support or resistance levels, suggesting potential reversals or continuation opportunities at significant price points.
MA (Moving Average)
MA signals help identify trends by analyzing price action relative to a moving average. Optional filters like ADX add an additional layer of validation, ensuring only high-confidence signals are displayed on the dashboard.
LVL (Levels)
These signals are based on shifts in RSI and help traders spot potential breakouts or reversals. The dashboard integrates these signals alongside MA and ADX filters to enhance their accuracy.
📊 Risk Management
This strategy includes built-in risk management features to help minimize losses:
Initial Capital: The user can set the initial capital (default is 10000), adjusting the strategy to their financial goals.
Position Size: Set the position size (default is 1000), allowing better risk management and controlling potential losses.
Stop-Loss: Multiple stop-loss methods are available, including ATR-based, fixed percentage, or prior high/low levels.
Take-Profit: Users can configure take-profit settings (default is 1.3%) to lock in gains while managing risk effectively.
⚠️ RISK DISCLAIMER
Trading involves significant risks, and most day traders experience losses. All content, tools, scripts, and educational materials from BRTLab are provided for informational and educational purposes only. Past performance is not a guarantee of future results. Please ensure you use realistic backtesting settings, including proper account size, commission, and slippage, to reflect market conditions.
⚡ CONCLUSION
We believe that successful trading comes from using indicators as supportive tools rather than relying on them for guaranteed success. The BRTLab Premium Signal Strategy is designed to be a comprehensive, customizable toolset that helps traders understand and interpret technical indicators more effectively.
By leveraging the power of backtesting and indicator optimization, traders can make well-informed decisions and develop a deeper understanding of market dynamics. Use this strategy to build a trading framework that aligns with your personal goals and trading style.
Follow the author’s instructions below to access the BRTLab Premium suite and unlock the full potential of this strategy.

Central Pivot Point Cross & Retrace Strategy // AlgoFyreThe Central Pivot Point Cross & Retrace Strategy uses pivot points for trend identification and trade entry. It combines accumulation/distribution indicators with pivot point levels to generate signals. The strategy incorporates dynamic position sizing based on a fixed risk amount and allows for both long and short positions with customizable stop-loss levels.
TABLE OF CONTENTS
🔶 ORIGINALITY
🔸Pivot Point-Based Trading
🔸Accumulation/Distribution
🔸Dynamic Position Sizing
🔸Customizable Risk Management
🔶 FUNCTIONALITY
🔸Indicators
🞘 Pivot Points
🞘 Accumulation/Distribution
🔸Conditions
🞘 Long Entry
🞘 Short Entry
🞘 Take Profit
🞘 Stop Loss
🔶 INSTRUCTIONS
🔸Adding the Strategy to the Chart
🔸Configuring the Strategy
🔸Backtesting and Practice
🔸Market Awareness
🔸Visual Customization
🔶 CONCLUSION
▅▅▅▅▅▅▅▅▅▅▅▅▅▅▅▅▅▅▅▅▅▅▅▅▅▅▅▅▅▅▅▅▅▅▅▅▅▅▅▅▅▅▅▅▅
🔶 ORIGINALITY The Central Pivot Point Cross & Retrace Strategy uniquely combines pivot point analysis with accumulation/distribution indicators to identify optimal entry and exit points. It employs dynamic position sizing based on a fixed risk amount, ensuring consistent risk management across trades. This approach allows traders to adapt to varying market conditions by adjusting position sizes according to predefined risk parameters, enhancing both flexibility and control in trading decisions. The strategy's integration of customizable stop-loss levels further refines its risk management capabilities.
🔸Pivot Point-Based Trading This strategy utilizes daily pivot points to identify key support and resistance levels, providing a framework for trend identification and trade entry. The central pivot point serves as the intraday point of balance between buyers and sellers, with the largest amount of trading volume assumed to take place in this area.
🔸Accumulation/Distribution The strategy incorporates the Accumulation/Distribution (A/D) line, an underrated volume-based indicator, to establish the main trend. The A/D line is used in conjunction with a trend based indicator like the 200-period Exponential Moving Average (EMA) to confirm trend direction and strength.
🔸Dynamic Position Sizing Position sizes are calculated dynamically based on a fixed risk amount, allowing traders to maintain consistent risk exposure across trades.
🔸Customizable Risk Management Traders can set flexible risk-reward ratios and adjust stop-loss and take-profit levels, tailoring the strategy to their risk tolerance and market conditions. The strategy recommends taking partial profits at S1 or R1 levels and moving the stop-loss to break-even for remaining positions.
🔶 FUNCTIONALITY The Central Pivot Point Cross & Retrace Strategy leverages pivot points and accumulation/distribution indicators to identify optimal trading opportunities. This strategy is designed to capitalize on price movements around key pivot levels by dynamically adjusting position sizes based on predefined risk parameters. It allows traders to manage risk effectively while taking advantage of both long and short positions.
🔸Indicators 🞘 Pivot Points: Calculates daily pivot points (PP, R1, R2, S1, S2) to identify key support and resistance levels. The central pivot point is crucial for determining market bias and entry points.
🞘 Accumulation/Distribution: Uses the A/D line and with a trend based indicator like the 200 EMA to determine market direction and trend strength. This combination helps eliminate noise and provides more reliable trend signals. We recommend using the Adaptive MAs (Hurst, CVaR, Fractal) // AlgoFyre , but any moving average could be used.
🔸Conditions 🞘 Long Entry: Initiates a long position when the price crosses above the central pivot point (PP), retraces back to it and the A/D line is above its 200 EMA, indicating an uptrend. A limit entry order is set at the PP for entering the long trade.
🞘 Short Entry: Initiates a short position when the price crosses below the central pivot point (PP), retraces back to it and the A/D line is below its 200 EMA, indicating a downtrend. A limit entry order is set at the PP for entering the short trade.
🞘 Take Profit: 50% of the position is closed as profit when R1 for Longs and S1 for Shorts is reached. The position is fully closed when R2 for Longs and S2 for Shorts is reached.
🞘 Stop Loss: Stop loss is set via strategy settings. When the first 50% take profit for both long and shorts is taken, stop loss for both will be moved to break-even/entry.
🔶 INSTRUCTIONS
The Central Pivot Point Cross & Retrace Strategy can be set up by adding it to your TradingView chart and configuring parameters such as the accumulation/distribution source, stop-loss percentage, and risk management settings. This strategy is designed to capitalize on price movements around key pivot levels by dynamically adjusting position sizes based on predefined risk parameters. Enhance the accuracy of signals by combining this strategy with additional indicators like trend-following or momentum-based tools. Adjust settings to better manage risk and optimize entry and exit points.
🔸Adding the Strategy to the Chart Go to your TradingView chart.
Click on the "Pine Editor" button at the bottom of the chart.
Copy and paste the strategy code into the Pine Editor.
Click "Add to Chart" to apply the strategy.
Add the technical indicator "Accumulation/Distribution" to the chart.
Add the trend indicator " Adaptive MAs (Hurst, CVaR, Fractal) // AlgoFyre " or any other MA to the chart and move it to the "Accumulation/Distribution" pane.
Set the source of your trend indicator to "Accumulation/Distribution".
🔸Configuring the Strategy Open the strategy settings by clicking on the gear icon next to its name on the chart.
Accumulation/Distribution Source: Select the source for the accumulation/distribution indicator.
Accumulation/Distribution EMA Source: Select the source for the trend indicator.
Stop Loss Percentage: Set the stop loss distance from the pivot point as a percentage.
Risk Amount: Define the fixed risk amount for position sizing.
Base Order Size: Set the base order size for position calculations.
Number of Positions: Specify the maximum number of positions allowed.
Time Frame: Adjust the time frame based on the currency pair or asset being traded (e.g., 15-minute for EUR/USD, 30-minute for GBP/USD).
🔸Backtesting and Practice Backtest the strategy on historical data to understand how it performs in various market environments.
Practice using the strategy on a demo account before implementing it in live trading.
Test different time frames and asset pairs to find the most suitable combinations.
🔸Market Awareness Keep an eye on market news and events that might cause extreme price movements. The strategy reacts to price data and might not account for news-driven events that can cause large deviations.
Remember that this strategy is not recommended for stocks due to the A/D line's inability to account for gaps in its calculation.
🔸Visual Customization Visualization Settings: Customize the display of entry price, take profit, and stop loss levels.
Color Settings: Switch to the AlgoFyre theme or set custom colors for bullish, bearish, and neutral states.
Table Settings: Enable or disable the information table and adjust its position.
🔶 CONCLUSION
The Central Pivot Point Cross & Retrace Strategy provides a robust framework for capitalizing on price movements around key pivot levels by combining pivot point analysis with accumulation/distribution indicators. This strategy leverages pivot point crossovers to identify entry points and utilizes the A/D line crossover with its 200 EMA for trend confirmation, ensuring trades align with prevailing market conditions. By incorporating dynamic position sizing based on a fixed risk amount, traders can effectively manage risk and adapt to varying market conditions. The strategy's focus on trading around the central pivot point and its customizable stop-loss and take-profit levels further enhance its risk management capabilities, making it a versatile tool for both trending and ranging markets. With its strategic blend of technical indicators and risk management, the Central Pivot Point Cross & Retrace Strategy offers traders a comprehensive approach to optimizing trade execution and maximizing potential returns across various currency pairs and commodities.

VIDYA ProTrend Multi-Tier ProfitHello! This time is about a trend-following system.
VIDYA is quite an interesting indicator that adjusts dynamically to market volatility, making it more responsive to price changes compared to traditional moving averages. Balancing adaptability and precision, especially with the more aggressive short trade settings, challenged me to fine-tune the strategy for a variety of market conditions.
█ Introduction and How it is Different
The "VIDYA ProTrend Multi-Tier Profit" strategy is a trend-following system that combines the VIDYA (Variable Index Dynamic Average) indicator with Bollinger Bands and a multi-step take-profit mechanism.
Unlike traditional trend strategies, this system allows for more adaptive profit-taking, adjusting for long and short positions through distinct ATR-based and percentage-based targets. The innovation lies in its dynamic multi-tier approach to profit-taking, especially for short trades, where more aggressive percentages are applied using a multiplier. This flexibility helps adapt to various market conditions by optimizing trade management and profit allocation based on market volatility and trend strength.
BTCUSD 6hr performance
█ Strategy, How it Works: Detailed Explanation
The core of the "VIDYA ProTrend Multi-Tier Profit" strategy lies in the dual VIDYA indicators (fast and slow) that analyze price trends while accounting for market volatility. These indicators work alongside Bollinger Bands to filter trade entries and exits.
🔶 VIDYA Calculation
The VIDYA indicator is calculated using the following formula:
Smoothing factor (𝛼):
alpha = 2 / (Length + 1)
VIDYA formula:
VIDYA(t) = alpha * k * Price(t) + (1 - alpha * k) * VIDYA(t-1)
Where:
k = |Chande Momentum Oscillator (MO)| / 100
🔶 Bollinger Bands as a Volatility Filter
Bollinger Bands are calculated using a rolling mean and standard deviation of price over a specified period:
Upper Band:
BB_upper = MA + (K * stddev)
Lower Band:
BB_lower = MA - (K * stddev)
Where:
MA is the moving average,
K is the multiplier (typically 2), and
stddev is the standard deviation of price over the Bollinger Bands length.
These bands serve as volatility filters to identify potential overbought or oversold conditions, aiding in the entry and exit logic.
🔶 Slope Calculation for VIDYA
The slopes of both fast and slow VIDYAs are computed to assess the momentum and direction of the trend. The slope for a given VIDYA over its length is:
Slope = (VIDYA(t) - VIDYA(t-n)) / n
Where:
n is the length of the lookback period. Positive slope indicates bullish momentum, while negative slope signals bearish momentum.
LOCAL picture
🔶 Entry and Exit Conditions
- Long Entry: Occurs when the price moves above the slow VIDYA and the fast VIDYA is trending upward. Bollinger Bands confirm the signal when the price crosses the upper band, indicating bullish strength.
- Short Entry: Happens when the price drops below the slow VIDYA and the fast VIDYA trends downward. The signal is confirmed when the price crosses the lower Bollinger Band, showing bearish momentum.
- Exit: Based on VIDYA slopes flattening or reversing, or when the price hits specific ATR or percentage-based profit targets.
🔶 Multi-Step Take Profit Mechanism
The strategy incorporates three levels of take profit for both long and short trades:
- ATR-based Take Profit: Each step applies a multiple of the ATR (Average True Range) to the entry price to define the exit point.
The first level of take profit (long):
TP_ATR1_long = Entry Price + (2.618 * ATR)
etc.
█ Trade Direction
The strategy offers flexibility in defining the trading direction:
- Long: Only long trades are considered based on the criteria for upward trends.
- Short: Only short trades are initiated in bearish trends.
- Both: The strategy can take both long and short trades depending on the market conditions.
█ Usage
To use the strategy effectively:
- Adjust the VIDYA lengths (fast and slow) based on your preference for trend sensitivity.
- Use Bollinger Bands as a filter for identifying potential breakout or reversal scenarios.
- Enable the multi-step take profit feature to manage positions dynamically, allowing for partial exits as the price reaches specified ATR or percentage levels.
- Leverage the short trade multiplier for more aggressive take profit levels in bearish markets.
This strategy can be applied to different asset classes, including equities, forex, and cryptocurrencies. Adjust the input parameters to suit the volatility and characteristics of the asset being traded.
█ Default Settings
The default settings for this strategy have been designed for moderate to trending markets:
- Fast VIDYA Length (10): A shorter length for quick responsiveness to price changes. Increasing this length will reduce noise but may delay signals.
- Slow VIDYA Length (30): The slow VIDYA is set longer to capture broader market trends. Shortening this value will make the system more reactive to smaller price swings.
- Minimum Slope Threshold (0.05): This threshold helps filter out weak trends. Lowering the threshold will result in more trades, while raising it will restrict trades to stronger trends.
Multi-Step Take Profit Settings
- ATR Multipliers (2.618, 5.0, 10.0): These values define how far the price should move before taking profit. Larger multipliers widen the profit-taking levels, aiming for larger trend moves. In higher volatility markets, these values might be adjusted downwards.
- Percentage Levels (3%, 8%, 17%): These percentage levels define how much the price must move before taking profit. Increasing the percentages will capture larger moves, while smaller percentages offer quicker exits.
- Short TP Multiplier (1.5): This multiplier applies more aggressive take profit levels for short trades. Adjust this value based on the aggressiveness of your short trade management.
Each of these settings directly impacts the performance and risk profile of the strategy. Shorter VIDYA lengths and lower slope thresholds will generate more trades but may result in more whipsaws. Higher ATR multipliers or percentage levels can delay profit-taking, aiming for larger trends but risking partial gains if the trend reverses too early.

Gauss KenJi Robot
Gauss KenJi Trading Robot: Precision and Automation for Traders
The Gauss KenJi robot is a cutting-edge trading solution designed for experienced traders seeking to enhance their decision-making through advanced statistical models and automation. Unlike traditional trading tools that rely on generic indicators prone to false signals, the Gauss KenJi robot offers an innovative approach by utilizing two unique indicators: the Kenji Indicator v.2.0 and the Gauss Indicator .
Kenji Indicator v.2.0
Traditional moving averages and related indicators often fail in flat market conditions, where frequent crossovers lead to confusing signals and false trends. The Kenji Indicator addresses this issue by using a combination of correlation analysis and moving averages to more accurately identify the market’s state. This real-time insight allows for better navigation of local trends, reducing noise and increasing the precision of trade signals.
Gauss Indicator
The Gauss Indicator brings the power of statistical analysis into trading by applying the 3 sigmas rule. It calculates and predicts the likely price ranges for specific time frames (hourly, daily, weekly) with probabilities of 68%, 95%, and 99%. This offers traders an actionable framework for setting stop-loss, take-profit, and identifying key support and resistance levels. By providing a clearer view of potential price movements, the Gauss Indicator improves decision-making, ensuring that traders enter and exit the market at optimal points.
Gauss KenJi Robot: How it Works
The Gauss KenJi robot operates on a statistical algorithm based on the Gaussian function, which uses market volatility as a core indicator of price movements. The robot opens positions in the direction of the trend when the price reaches the predetermined Gauss border. Position sizes are calculated according to the “Initial_lot” parameter, with stop-loss and take-profit levels defined by the “Pips” parameter. Trades are automatically closed either when profit targets or stop-loss limits are reached, or if local trend reversals are detected by the Kenji Indicator.
This highly adaptable algorithm can be applied to any asset class (stocks, forex, crypto, commodities) and any time frame, providing traders with a versatile tool to navigate various markets.
Why Gauss KenJi is Essential for Traders
1. Time Efficiency: The robot operates autonomously, allowing traders to step away from constant chart monitoring while still capitalizing on market movements.
2. Profit Maximization: By leveraging machine learning and advanced statistical models, the robot identifies opportunities faster than human traders, ensuring more profitable trades.
3. Risk Management: The robot strictly adheres to predefined rules, helping traders minimize losses and protect their capital in volatile market conditions.
4. Cross-market Versatility: Whether you’re trading forex, stocks, crypto, or commodities, Gauss KenJi adapts to different markets and time frames, making it a versatile tool for professional traders.
The Gauss KenJi robot is a comprehensive, scientifically driven trading solution designed to eliminate common pitfalls associated with traditional indicators. Its combination of the Kenji Indicator’s trend identification and the Gauss Indicator’s price prediction capabilities makes it an indispensable tool for traders looking to enhance both the precision of their trades and the automation of their strategies. Whether you are aiming for consistent daily profits or optimizing long-term trading strategies, Gauss KenJi offers the efficiency and accuracy required to stay ahead in today’s competitive markets.

Adaptive MA Scalping StrategyAdaptive MA Scalping Strategy
The Adaptive MA Scalping Strategy is an innovative trading approach that merges the strengths of the Kaufman's Adaptive Moving Average (KAMA) with the Moving Average Convergence Divergence (MACD) histogram. This combination results in a momentum-adaptive moving average that dynamically adjusts to market conditions, providing traders with timely and reliable signals.
How It Works
Kaufman's Adaptive Moving Average (KAMA): Unlike traditional moving averages, KAMA adjusts its sensitivity based on market volatility. It becomes more responsive during trending markets and less sensitive during periods of consolidation, effectively filtering out market noise.
MACD Histogram Integration: The strategy incorporates the MACD histogram, a momentum indicator that measures the difference between a fast and a slow exponential moving average (EMA). By adding the MACD histogram values to the KAMA, the strategy creates a new line—the momentum-adaptive moving average (MOMA)—which captures both trend direction and momentum.
Signal Generation:
Long Entry: The strategy enters a long position when the closing price crosses above the MOMA. This indicates a potential upward momentum shift.
Exit Position: The position is closed when the closing price crosses below the MOMA, signaling a potential decline in momentum.
Cloud Calculation Detail
The MOMA is calculated by adding the MACD histogram value to the KAMA of the price. This addition effectively adjusts the KAMA based on the momentum indicated by the MACD histogram. When momentum is strong, the MACD histogram will have higher values, causing the MOMA to adjust accordingly and provide earlier entry or exit signals.
Performance on Stocks
This strategy has demonstrated excellent performance on stocks when applied to the 1-hour timeframe. Its adaptive nature allows it to respond swiftly to market changes, capturing profitable trends while minimizing the impact of false signals caused by market noise. The combination of KAMA's adaptability and MACD's momentum detection makes it particularly effective in volatile market conditions commonly seen in stock trading.
Key Parameters
KAMA Length (malen): Determines the sensitivity of the KAMA. A length of 100 is used to balance responsiveness with noise reduction.
MACD Fast Length (fast): Sets the period for the fast EMA in the MACD calculation. A value of 24 helps in capturing short-term momentum changes.
MACD Slow Length (slow): Sets the period for the slow EMA in the MACD calculation. A value of 52 smooths out longer-term trends.
MACD Signal Length (signal): Determines the period for the signal line in the MACD calculation. An 18-period signal line is used for timely crossovers.
Advantages of the Strategy
Adaptive to Market Conditions: By adjusting to both volatility and momentum, the strategy remains effective across different market phases.
Enhanced Signal Accuracy: The fusion of KAMA and MACD reduces false signals, improving the accuracy of trade entries and exits.
Simplicity in Execution: With straightforward entry and exit rules based on price crossovers, the strategy is user-friendly for traders at all experience levels
