Mutanabby_AI | ATR+ | Trend-Following StrategyThis document presents the Mutanabby_AI | ATR+ Pine Script strategy, a systematic approach designed for trend identification and risk-managed position entry in financial markets. The strategy is engineered for long-only positions and integrates volatility-adjusted components to enhance signal robustness and trade management.
Strategic Design and Methodological Basis
The Mutanabby_AI | ATR+ strategy is constructed upon a foundation of established technical analysis principles, with a focus on objective signal generation and realistic trade execution.
Heikin Ashi for Trend Filtering: The core price data is processed via Heikin Ashi (HA) methodology to mitigate transient market noise and accentuate underlying trend direction. The script offers three distinct HA calculation modes, allowing for comparative analysis and validation:
Manual Calculation: Provides a transparent and deterministic computation of HA values.
ticker.heikinashi(): Utilizes TradingView's built-in function, employing confirmed historical bars to prevent repainting artifacts.
Regular Candles: Allows for direct comparison with standard OHLC price action.
This multi-methodological approach to trend smoothing is critical for robust signal generation.
Adaptive ATR Trailing Stop: A key component is the Average True Range (ATR)-based trailing stop. ATR serves as a dynamic measure of market volatility. The strategy incorporates user-defined parameters (
Key Value and ATR Period) to calibrate the sensitivity of this trailing stop, enabling adaptation to varying market volatility regimes. This mechanism is designed to provide a dynamic exit point, preserving capital and locking in gains as a trend progresses.
EMA Crossover for Signal Generation: Entry and exit signals are derived from the interaction between the Heikin Ashi derived price source and an Exponential Moving Average (EMA). A crossover event between these two components is utilized to objectively identify shifts in momentum, signaling potential long entry or exit points.
Rigorous Stop Loss Implementation: A critical feature for risk mitigation, the strategy includes an optional stop loss. This stop loss can be configured as a percentage or fixed point deviation from the entry price. Importantly, stop loss execution is based on real market prices, not the synthetic Heikin Ashi values. This design choice ensures that risk management is grounded in actual market liquidity and price levels, providing a more accurate representation of potential drawdowns during backtesting and live operation.
Backtesting Protocol: The strategy is configured for realistic backtesting, employing fill_orders_on_standard_ohlc=true to simulate order execution at standard OHLC prices. A configurable Date Filter is included to define specific historical periods for performance evaluation.
Data Visualization and Metrics: The script provides on-chart visual overlays for buy/sell signals, the ATR trailing stop, and the stop loss level. An integrated information table displays real-time strategy parameters, current position status, trend direction, and key price levels, facilitating immediate quantitative assessment.
Applicability
The Mutanabby_AI | ATR+ strategy is particularly suited for:
Cryptocurrency Markets: The inherent volatility of assets such as #Bitcoin and #Ethereum makes the ATR-based trailing stop a relevant tool for dynamic risk management.
Systematic Trend Following: Individuals employing systematic methodologies for trend capture will find the objective signal generation and rule-based execution aligned with their approach.
Pine Script Developers and Quants: The transparent code structure and emphasis on realistic backtesting provide a valuable framework for further analysis, modification, and integration into broader quantitative models.
Automated Trading Systems: The clear, deterministic entry and exit conditions facilitate integration into automated trading environments.
Implementation and Evaluation
To evaluate the Mutanabby_AI | ATR+ strategy, apply the script to your chosen chart on TradingView. Adjust the input parameters (Key Value, ATR Period, Heikin Ashi Method, Stop Loss Settings) to observe performance across various asset classes and timeframes. Comprehensive backtesting is recommended to assess the strategy's historical performance characteristics, including profitability, drawdown, and risk-adjusted returns.
I'd love to hear your thoughts, feedback, and any optimizations you discover! Drop a comment below, give it a like if you find it useful, and share your results.
Análise de Tendência

FFI-Trend Rider ProFFI-Trend Rider Pro is a trend-following strategy designed to help traders make more structured and disciplined entries.
It uses a crossover between the 11 EMA and 21 SMA to detect potential trend shifts, while avoiding premature entries by checking how far the price is from the moving averages. If the price is extended, it waits for a pullback — just like professional traders do.
The indicator also includes:
Auto stoploss based on 21 SMA
Visual background colors based on RSI to help gauge trend strength
A built-in trade info table showing current trade type, entry price, stoploss, and trailing SL
Strategy-enabled functionality for easy backtesting
🔍 Ideal For:
Intraday & Swing Traders
Traders who want fewer, high-quality trades
Anyone looking to reduce emotional decision-making
⚠️ Disclaimer:
This script is for educational purposes only and does not constitute financial advice. Always do your own analysis before making any trading decisions. Past performance is not indicative of future results.


Candlestick Pattern Strategy with Smart Stop-Loss Management🔹 Strategy Overview
This strategy combines candlestick patterns with trend filtering and EMA channel confirmation to identify high-probability trading opportunities. It features a smart stop-loss management system that moves to breakeven once the trade reaches a predefined profit threshold.
📊 Key Features
✅ Multiple Candlestick Patterns – Detects classic reversal patterns like:
Hammer & Hanging Man
Bullish & Bearish Engulfing
Piercing Line & Dark Cloud Cover
Morning & Evening Star
Doji Star (Neutral Signal)
✅ Trend & EMA Channel Filters
Trend EMA (100-period) – Ensures trades align with the broader trend.
EMA Channel (50-period ± % range) – Filters trades within a defined volatility range.
✅ Flexible Trade Management
Fixed Target Points – Take profit at a predefined distance.
Trailing Stop to Cost – Moves stop-loss to breakeven after reaching a specified profit threshold.
✅ Customizable Trade Direction
Long Only / Short Only / Both – Adapt to bullish, bearish, or neutral markets.
✅ Time-Based Execution
Intraday Mode – Trades only within specified session hours.
Positional Mode – Holds trades beyond the session.
⚙️ Input Parameters
Trend Filter – Enable/disable trend alignment with EMA.
EMA Channel Filter – Adjust channel width for volatility control.
Candlestick Patterns – Toggle individual patterns on/off.
Target Points & Trail Trigger – Customize profit-taking and SL management.
Trade Type – Switch between intraday and positional trading.
📈 Entry Conditions
Long Entry:
Bullish candlestick pattern (Hammer, Bullish Engulfing, Piercing Line, Morning Star).
Price above Trend EMA (if enabled).
RSI < 30 (oversold confirmation).
Within EMA Channel (if enabled).
Short Entry:
Bearish candlestick pattern (Hanging Man, Bearish Engulfing, Dark Cloud Cover, Evening Star).
Price below Trend EMA (if enabled).
RSI > 70 (overbought confirmation).
Within EMA Channel (if enabled).
📉 Exit Conditions
Take Profit (TP): Fixed target based on points.
Stop-Loss (SL): Moves to breakeven after hitting the trail trigger.
📊 Visual Indicators
Trend EMA (Orange Line) – Main trend direction.
EMA Channel (Blue Lines) – Volatility range.
Buy/Sell Labels – Entry signals below/above bars.
Doji Star (Gray Cross) – Neutral signal.
🎯 Best Suited For
Swing Traders (Positional Mode)
Intraday Traders (Scalping with tight stops)
Price Action Enthusiasts (Candlestick-based entries)
🔗 Try it out and customize it to fit your trading style! 🚀

Jimb0ws Strategy Trending Info PanelsJimb0ws Strategy — Golden Candles + Bubble Zones
A price-action/EMA strategy built for FX scalping and intraday swings. It colors Golden Candles when strong bodies touch/skim EMA20/50 in trend (“bubble”) and optionally highlights Robin Candles (break of the prior golden body). Signals are throttled per bubble and filtered by multiple higher-timeframe conditions.
How it trades
Trend bubbles: Uses EMA20/50/100/200 alignment on the chart timeframe; also reads 1H & 4H bubbles for context.
Entries: BUY/SELL labels appear only when a golden setup aligns with fractal/structure checks and all active filters pass.
Stops/Targets (strategy mode):
• Longs: SL = EMA100 if EMA200 > EMA100, else SL = EMA200.
• Shorts: SL = EMA100 if EMA200 < EMA100, else SL = EMA200.
• TP = RR × risk (default 2R).
An on-chart SL/TP info label prints the exact prices at each signal.
Risk filter options: disable beyond 1H EMA50, proximity band around 1H EMA50, wick overdrive veto, session filter (toggle on/off), max signals per bubble.
Visuals & tools
Colored EMAs (20/50/100/200), bubble zone background.
4H info panel (state, start time, duration); Prev-Day ATR panel sits above it.
Optional 1H info panel and consolidation warning.
Fractal markers (size selectable).
Alerts
1H bubble state change (Long/Short/Consolidation).
BUY/SELL signals.
Inputs worth checking
Session & timezone, min body size, pip tolerances, proximity/WOD filters, max signals per bubble, RR, SL/TP label offset.
Notes
Best on FX pairs; pip = mintick × 10. Backtest and adjust to your instrument and session. This is not financial advice.

PP_Solstice StrategyThis strategy was developed by Vinay with inputs from Warren, Dodgie and others to replicate TOS AGAIG indicators. It is available for free of use.

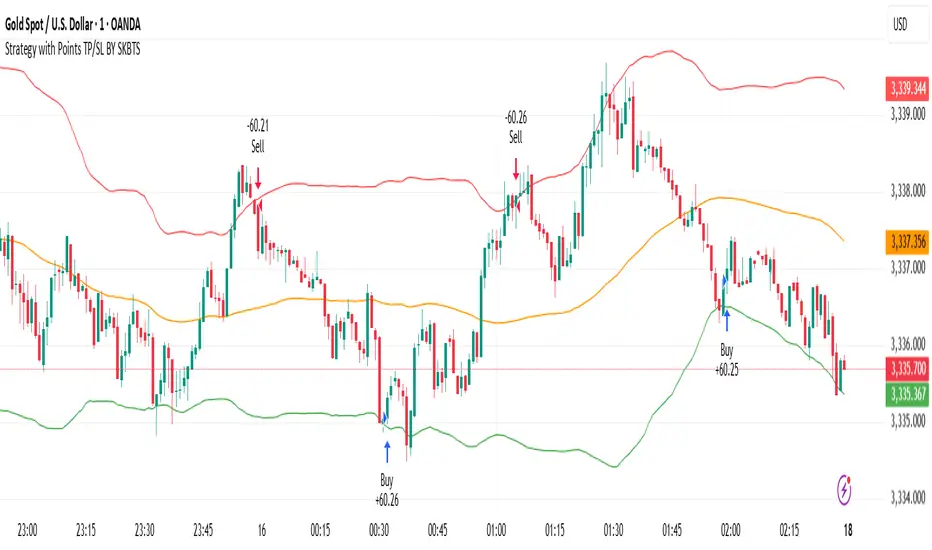
STRATEGY WITH POINT TP/SL BY SKBTSThe formula for the standard middle band is simply a moving average, often set to 20 periods:
Middle Band = 20-period moving average (close)
The upper and lower bands are calculated from the standard deviation, which measures how dispersed the price data is from the average.
Upper Band = Middle Band + (2 standard deviations of 20-period close)
Lower Band = Middle Band - (2 standard deviations of 20-period close)
The key inputs are the 20-period moving average, the number of standard deviations (typically 2), and the 20-period standard deviation. The bands will expand and contract based on the standard deviation value.
Some traders increase the standard deviation multiplier to 2.1 or 2.2 to make the bands looser and more sensitive. Decreasing the number of periods for the moving average and standard deviation will also increase sensitivity.
Institution Accumulation/DistributionLeveraging the Williams%R oscillator, the script has been optimized to pick out key turning point in the market specifically at Resistance (Overbought) or Support (Oversold)
The algo has been programmed to print both buy and sell alerts at extremes/when conditions flip eg a long position will be closed simultaneously opening a short position above resistance.
Best used as a scalping tool targeting 30m and below works well with currency pairs

Valdes Trading Bots - Scaled Profits and DCA — V 12.1Valdes Trading Bots – Scaled Profits and DCA — V 12.1
Overview
This strategy is built for traders who want to capture medium-term swings without getting caught in short-term noise. It is optimized for the 12-hour timeframe, where signals have historically shown stronger consistency across a wide range of market conditions.
Key Features
Trend regime detection – Identifies when momentum flips from bullish to bearish (and vice versa).
Scaled profit targets – Positions automatically reduce across multiple take-profit levels to secure gains progressively.
Risk management – Includes a capped, rules-based averaging (DCA) method during controlled pullbacks. Not martingale, strictly limited.
Directional flexibility – Can operate long or short, depending on market regime.
JSON output included – Adds flexibility for advanced users.
How to Use
Apply primarily on the 12-hour chart for best results.
Use this script for backtesting, research, and simulation before any live application.
No input changes are required; it is designed to run as-is.
Notes & Limitations
This is a strategy script, not a signal service.
Past win rates or backtest results are not predictive of future performance.
All markets carry risk, and losing trades will occur.
Always test extensively in paper trading before deploying to a live account.
Disclaimer
This script is provided for educational and research purposes only. It is not financial advice. The authors and publishers assume no responsibility for losses incurred from using this strategy.

TrendPilot AI v2 — Adaptive Trend Day Trading StrategyOverview
TrendPilot AI v2 is a structured, rules-based day trading strategy that identifies and follows market momentum using a sophisticated blend of technical indicators. Optimized for 15-minute and higher timeframes on high market cap cryptocurrencies (AAVE, SOL, ETH, BCH, BTC) to minimize manipulation risks, it adapts to changing market conditions with dynamic risk management and controlled re-entry logic to maximize trend participation while minimizing noise.
Core Logic
Multiple EMA Trend Confirmation — Uses three Exponential Moving Averages (fast, medium, slow) to detect robust bullish, bearish, or neutral trends, ensuring trades align with the prevailing market direction.
ADX Momentum Filter — Employs an ADX-based filter to confirm strong trends, avoiding entries in choppy or low-momentum markets.
Smart Entry Filter — Optional ATR-based buffer (period 14, multiplier 1.5) around the fast EMA prevents entries at overextended prices, enhancing trade precision.
Flexible Exit System — Offers multiple exit options: fixed take-profit (default 1.7 offset), trend-reversal exits, or ATR-based trailing stops (period 14, multiplier 2.0), with secure modes requiring candle closes for confirmation to gain Max Profit.
Controlled Re-Entry Logic — Allows re-entries after take-profit or price-based stop-loss with configurable wait periods (default 6 bars), max attempts (default 2), and EMA touch requirements (fast, medium, or slow).
State-Aware Risk Management — Tracks trend states and recent exits to adapt entries, with daily trade limits (default 5 long/short) and loss cooldowns (default 2 stop-losses) for disciplined trading.
How to Use & Configuration
Markets & Timeframes
Works with high market cap cryptocurrencies (AAVE, SOL, ETH, BCH, BTC).
Optimized for intraday charts (15m–4h) but adaptable to higher timeframes (e.g., 1h, 4h).
Trade Direction Settings
Dual Trades — Trades both long and short, quickly re-aligning after trend reversals.
Long Only — Ignores bearish signals, ideal for bullish markets or strong uptrends.
Short Only — Ignores bullish signals, suited for bearish markets or downtrends.
Risk Management Settings
Stop Loss Types
Trend Reversal — Closes positions when an opposite trend signal is confirmed (default).
Fixed Offset — Static stop at 3.5 offset from entry price (adjustable).
ATR Based — Dynamic trailing stop using ATR (period 14, multiplier 2.0), adjusting to market volatility.
Secure SL Mode — Optional setting to trigger price-based stops only on candle closes, reducing false exits.
Maximum recommended risk per trade is 5–10% of account equity.
Trade size is configurable (default 20 units) to match individual risk appetite.
Take Profit Options
Fixed Offset — Predefined target at 1.7 offset from entry (adjustable, e.g., 2.5 for SOL).
Secure TP Mode — Exits only when a candle closes beyond the target, ensuring reliable profit capture.
Trend Reversal — Exits on opposite trend signals when fixed TP is disabled, ideal for riding longer trends.
Trade Management Controls
Smart Entry Filter — Optional ATR-based buffer (period 14, multiplier 1.5) prevents chasing overextended prices.
Max Re-Entries — Limits continuation trades per trend cycle (default 2).
Daily Trade Limits — Caps long/short trades per day (default 5 each) for disciplined trading.
Daily Loss Cooldown — Pauses trading after a set number of stop-losses (default 2) per day.
Max Bars in Trade — Closes positions after a set duration (default 1440 bars) to prevent stale trades.
Configuration Steps
Apply the strategy to your chosen symbol (e.g., AAVE/USDT, SOL/USDT) and timeframe (15m or higher).
Select Trade Direction mode (Dual, Long Only, or Short Only).
Set Stop Loss (Trend Reversal, Fixed Offset, or ATR Based) and Take Profit (fixed or trend-reversal).
Adjust Smart Entry Filter, Max Re-Entries, Daily Limits, and Loss Cooldown as needed.
Test across multiple market conditions using the performance panel (top-right, showing Total Trades, Wins, Losses, Win Rate).
Enables automated trading via webhook integration with platforms like Binance Futures.
Set up alerts for long/short entries (🟢 Long, 🔴 Short) and exits (🎯 Max TP, 🛑 Max SL, 🚨 Force Exit).
Backtesting Guidance
Use realistic commission (default 0.01%) and slippage (default 2 ticks) matching your broker and instrument.
Validate performance over long historical periods (e.g., 3–6 months) to ensure >100 trades across different market regimes.
Avoid curve-fitting by testing on multiple high market cap coins (AAVE, SOL, ETH, BCH, BTC) and avoiding over-optimization.
EMA and ATR parameters are set to balanced, industry-standard values for realistic backtesting.
Best Practices, Defaults & Disclaimer
Best Practices
Use consistent and conservative position sizing (default 20 units).
Match commission and slippage to your broker’s actual rates.
Enable secure TP/SL modes for entries and exits to reduce false signals.
Test across different symbols, timeframes, and market phases before live trading.
Keep parameters simple to avoid overfitting.
Default Settings (Recommended Starting Point)
Initial Capital: $10,000
Order Size: Fixed, 20 units
Commission: 0.01%
Slippage: 2 ticks
Take Profit Offset: 1.7 (adjustable, e.g., 2.5 for SOL)
Stop Loss Type: Trend Reversal (default), Fixed Offset (3.5), or ATR Based (period 14, multiplier 2.0)
Smart Entry Filter: ATR period 14, multiplier 1.5 (optional)
Max Re-Entries: 2 per trend cycle
Daily Trade Limits: 5 long, 5 short
Daily Loss Cooldown: 2 stop-losses
Max Bars in Trade: 1440 bars
Subscription Information
TrendPilot AI v2 is an invite-only strategy, accessible only to approved subscribers.
Benefits include full access to all features, priority support, and regular updates.
Access is limited to ensure a high-quality user experience.
Compliance Status
No functional warnings in the script.
The script uses closed candle logic, ensuring no repainting or lookahead issues.
Designed for realistic backtesting with a $10,000 account and sustainable risk (≤5–10% per trade).
Disclaimer
This strategy is intended for educational and analytical purposes only. Trading involves substantial risk, and past performance does not guarantee future results. You are solely responsible for your own trading decisions and risk management.
Developed by: TrendPilotAI Team
For questions, setup guidance, or enhancement suggestions, contact TrendPilotAI Team via TradingView.

EMA20 Anti-Whipsaw Strategy - Clean Entry & Exit LabelsCrypto Strategy named EMA20 Anti-Whipsaw Strategy - Clean Entry & Exit Labels

Recovery Zone Hedging [Starbots]Recovery Zone Hedging Strategy — Advanced Adaptive Hedge Recovery System
This strategy introduces an innovative zone-based hedge recovery approach tailored to TradingView’s single-direction trading model. Designed for serious traders and professionals, it combines multiple technical indicators with dynamic position sizing and adaptive take-profit mechanisms to manage drawdowns and maximize recovery efficiency.
How Recovery Zones Are Calculated
The strategy defines recovery zones as a configurable percentage distance from the last executed trade price. This percentage can be adjusted to suit different market volatility environments — wider zones for volatile assets, tighter zones for stable ones. When price moves into a recovery zone against the open position, the strategy places a hedge trade in the opposite direction to help recoup losses.
Dynamic Take-Profit Calculation
Take-profit targets are not fixed. Instead, they increase dynamically based on any accumulated losses from previous hedge trades. For example, if your initial target is 2%, but you have a $5 loss from prior hedges, the next take-profit target adjusts upward to cover both the loss and your profit goal, ensuring the entire hedge sequence closes in net profit.
Originality & Value
Unlike traditional hedging or recovery scripts that rely on static stop losses and fixed trade sizing, this strategy offers:
- Dynamic Hedge Entry Zones: Uses configurable percentage-based recovery zones that adapt to price volatility, allowing precise placement of hedge trades at meaningful reversal levels.
- Multi-Indicator Signal Fusion: Integrates MACD and Directional Movement Index (DMI) signals to confirm trade entries, improving signal accuracy and reducing false triggers.
- Exponential Position Sizing: Each hedge trade’s size grows exponentially using a customizable multiplier, accelerating loss recovery while carefully balancing capital usage.
- Adaptive Take-Profit Logic: The take-profit target adjusts dynamically based on accumulated losses and profit margins, ensuring that the entire hedge sequence closes with a net gain.
- Capital Usage Monitoring: A built-in dashboard tracks real-time equity consumption, preventing over-leveraging by highlighting critical capital thresholds.
- Fail-Safe Exit Mechanism: An optional forced exit beyond the last hedge zone protects capital in extreme market scenarios.
This strategy’s layered design and adaptive mechanisms provide a unique and powerful tool for traders seeking robust recovery systems beyond standard hedge or martingale methods.
How Components Work Together
- Entry Signals: The script listens for MACD line crossovers and DMI directional crosses to open an initial trade.
- Recovery Zones: If the market moves against the initial position, the strategy calculates a recovery zone a set percentage away and places a hedge trade in the opposite direction.
- Position Scaling: Each subsequent hedge trade increases in size exponentially according to the hedge multiplier, designed to recover all previous losses plus a profit.
- Take-Profit Target: Rather than a fixed target, the TP level is dynamically calculated considering current drawdown and desired profit margin, ensuring the entire hedge sequence closes profitably.
- Cycle Management: Trades alternate direction following the recovery zones until profit is realized or a maximum hedge count is reached. If needed, a forced stop-out limits risk exposure.
Key Benefits for Professional Traders
- Enhanced Risk Management: Real-time capital usage visualization helps maintain safe exposure levels.
- Strategic Hedge Recovery: The adaptive recovery zones and exponential sizing accelerate loss recoupment more efficiently than traditional fixed-step systems.
- Multi-Indicator Confirmation: Combining MACD and DMI reduces false signals and improves hedge timing accuracy.
- Versatility: Suitable for multiple timeframes and asset classes with adjustable parameters.
- Comprehensive Visuals: On-chart recovery zones, hedge levels, dynamic take-profits, and equity usage tables enable informed decision-making.
Recommended Settings & Use Cases
- Initial Position Size: 0.1–1% of account equity
- Recovery Zone Distance: 2–5% price movement
- Hedge Multiplier: 1.5–1.85x growth per hedge step
- Max Hedge Steps: 5–10 for controlled risk exposure
Ideal for trending markets where price retracements create viable recovery opportunities. Use caution in sideways markets to avoid extended hedge sequences.
Important Notes
- TradingView’s single-direction model means hedging is simulated via alternating trades.
- Position sizes grow rapidly—proper parameter tuning is essential to avoid over-leveraging.
This script is designed primarily for professional traders seeking an advanced, automated hedge recovery framework, offering superior capital efficiency and loss management.

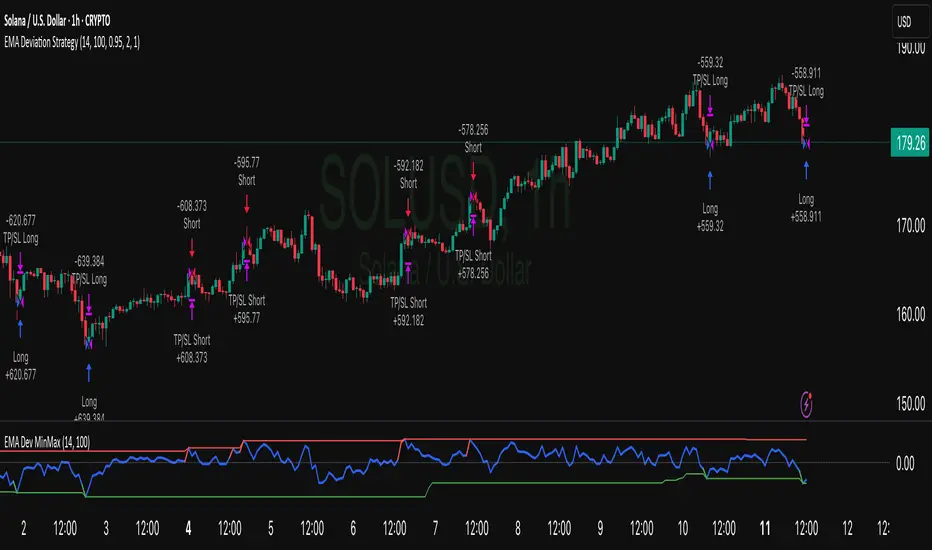
EMA Deviation Strategy📌 Strategy: EMA Deviation Strategy
The EMA Deviation Strategy identifies potential reversal points by measuring how far the current price deviates from its Exponential Moving Average (EMA). It dynamically tracks the minimum and maximum deviation levels over a user-defined lookback period, and enters trades when price reaches extreme zones.
🔍 Core Logic:
• Buy Entry: When price deviates significantly below the EMA, approaching the historical minimum deviation — signaling a potential rebound.
• Sell Entry: When price deviates significantly above the EMA, nearing the historical maximum deviation — signaling a possible pullback.
• Optional Take Profit / Stop Loss: Manage risk with customizable exit levels.
⚙️ Customizable Inputs:
• EMA length and lookback period
• Threshold sensitivity for entry signals
• Take profit and stop loss percentages
📈 Best Used For:
• Mean reversion setups
• Assets with cyclical or range-bound behavior
• Identifying short-term overbought/oversold conditions
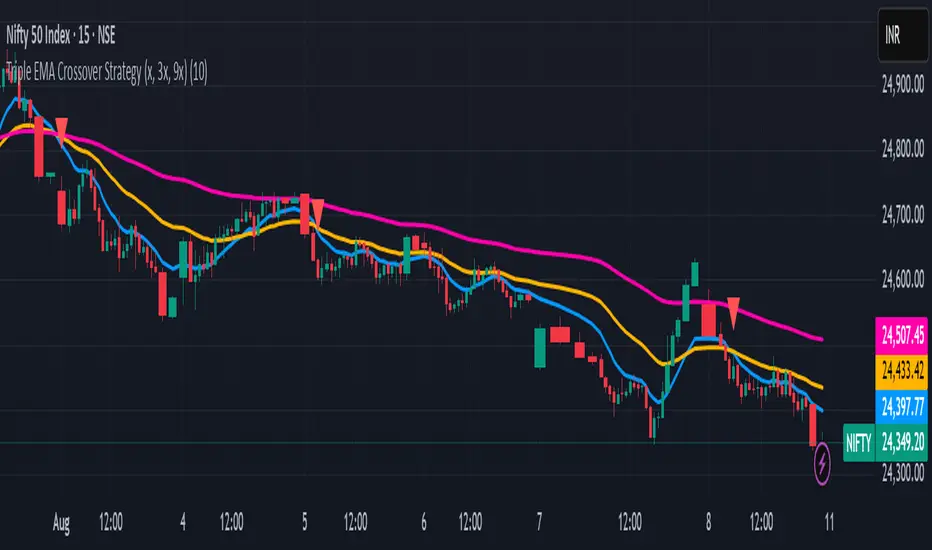
1 Triple EMA Crossover Strategy (x, 3x, 9x)An excellent EMA strategy.
x, 3x, and 9x: These represent the periods of the EMAs. For example, if 'x' is 10, then you would have a 10-day EMA, a 30-day EMA, and a 90-day EMA.
Crossover: The strategy relies on identifying when the price or the shorter-term EMAs cross above or below the longer-term EMAs, signaling potential buy or sell opportunities.
How the Strategy Works:
1. Trend Identification:
The relationship between the three EMAs indicates the overall trend. If the 3x EMA is above the 9x EMA, and the x EMA is above both, it suggests an uptrend. Conversely, if the 3x EMA is below the 9x EMA, and the x EMA is below both, it indicates a downtrend.
2. Buy Signals:
A buy signal might be generated when the shortest EMA (x) crosses above the medium EMA (3x) and then both cross above the longest EMA (9x), suggesting a potential breakout.
3. Sell Signals:
A sell signal might be generated when the shortest EMA (x) crosses below the medium EMA (3x) and then both cross below the longest EMA (9x), suggesting a potential breakdown.
---------------------------------------------------------------------------------------------------------
Unlocking Trends with the Triple EMA Crossover Strategy (x, 3x, 9x)
Welcome to an intuitive yet powerful trend-following strategy designed for clarity and actionable signals: the Triple EMA Crossover. This Pine Script® indicator leverages the Exponential Moving Average (EMA) to help traders identify prevailing trends, potential breakouts, and breakdowns with enhanced precision. Built on a simple, scalable 'x, 3x, 9x' methodology, it provides a dynamic framework for navigating market movements.
Understanding the x, 3x, 9x EMA Foundation
At its core, this strategy utilizes three Exponential Moving Averages, each acting as a distinct lens on price action. Unlike Simple Moving Averages (SMAs) which give equal weight to all data points, EMAs place a greater emphasis on recent prices, making them more responsive to current market conditions—a crucial advantage in fast-paced environments like intraday trading.
The "x, 3x, 9x" nomenclature is elegantly simple:
x EMA (Fast EMA): This is your shortest-period EMA, highly sensitive to immediate price changes. It acts as the leading indicator, quickly reacting to shifts in momentum.
3x EMA (Medium EMA): Calculated with three times the 'x' period, this EMA provides a smoother, yet still responsive, view of the short-to-medium term trend. It often acts as dynamic support or resistance.
9x EMA (Slow EMA): Representing nine times the 'x' period, this is your longest EMA. It filters out much of the market noise, giving you a clear picture of the underlying dominant trend.
The beauty of this setup lies in its adaptability. By simply adjusting the Base EMA Period (x) input in the script settings, you can automatically calibrate all three EMAs to suit different instruments, volatility levels, or even your preferred trading style. A common starting point for 'x' in intraday trading on a 5-minute chart is 10, which translates to 10, 30, and 90-period EMAs.
How the Strategy Works: Signals and Trend Identification
The power of the Triple EMA Crossover lies in the interplay and alignment of these three moving averages.
1. Trend Identification
The relative positioning of the EMAs paints a clear picture of the market's trend:
Uptrend (Bullish): When the emaX (fast) is above the ema3X (medium), and the ema3X is, in turn, above the ema9X (slow), it indicates a strong bullish trend. This "stacked" alignment suggests robust upward momentum.
Downtrend (Bearish): Conversely, if the emaX (fast) is below the ema3X (medium), and the ema3X is below the ema9X (slow), it signals a clear bearish trend.
2. Buy Signals 🟢
A buy signal is generated when the swift emaX crosses above the ema3X, AND simultaneously, the ema3X is already above the ema9X. This combined condition ensures that the shorter-term momentum is shifting upward while the underlying medium-term trend remains strong and aligned with the longer-term direction. This reduces false signals often seen with simple two-EMA crossovers, aiming to capture high-probability upward moves. The script will plot a green upward-pointing triangle below the candle to visually alert you to this entry.
3. Sell Signals 🔴
A sell signal occurs when the quick emaX crosses below the ema3X, AND the ema3X is already below the ema9X. This indicates that the short-term momentum is shifting downwards, confirming a bearish bias within the broader downtrend. This comprehensive confirmation helps identify potential breakdowns and exit points for long positions or entry points for short trades. A red downward-pointing triangle will appear above the candle to mark this signal.
The strategy also includes an intuitive exit mechanism: if a buy signal is active and a sell condition is met, the long position will be closed, and vice-versa for short positions. This ensures you're always aligned with the most recent confirmed trend direction.
Key Advantages for Traders
Clarity: Provides visually clear trend direction and momentum shifts.
Responsiveness: EMAs react faster to price changes compared to SMAs, making them ideal for dynamic markets.
Confirmation: The three-EMA alignment significantly reduces false signals, leading to higher-conviction trades.
Adaptability: The x input allows you to fine-tune the strategy for various assets and market conditions.
Simplicity: Despite its effectiveness, the logic remains straightforward and easy to understand.
Important Considerations for Day Trading
For optimal performance in intraday trading, it's highly recommended to apply this strategy on a 5-minute chart. This timeframe strikes the perfect balance between capturing rapid price action and filtering out excessive market noise, allowing the EMA crossovers to provide meaningful signals. Always combine this technical analysis with sound risk management, including stop-loss orders, and consider other indicators or fundamental analysis for further confirmation.
Customization and Disclaimer
Feel free to experiment with the Base EMA Period (x) input to find the optimal settings that resonate with your trading style and the specific instruments you trade. Remember, no single strategy guarantees profits, and past performance is not indicative of future results. This script is provided for educational and illustrative purposes. Always conduct your own research and risk assessment before trading with real capital. Happy Trading!
POCTraderX Pro— Structure & Precision Algorithm POCTraderX Pro is a market analysis system designed to accurately identify key interest zones and price turning points. It combines advanced Price Action reading with a dynamic filtering process that adapts signals according to market volatility and internal structure.
Methodology
The algorithm analyzes the sequence of relevant highs and lows (HH, HL, LL, LH) along with the price location in relation to Point of Control levels and consolidation ranges.
It uses multi–timeframe confirmations to filter out false breakouts and optimize trade entries.
In high–volatility conditions, it automatically adjusts validation levels to maintain a favorable risk/reward ratio.
Configuration
Recommended timeframes: from 1–minute to daily, depending on the trading style.
Applicable markets: indices, forex, commodities, and cryptocurrencies.
Adjustable parameters:
Structure detection sensitivity.
Enable/disable volatility filters.
Show/hide control zones and previous ranges.
Purpose
Provide a clear reading of market structure and critical zones to help traders execute trades with greater consistency and avoid entries in low–probability areas.
Important Notes
This script is closed–source to protect its internal methodology, but it is based on an original combination of structural analysis and zone validation not available in free indicators.
It does not produce automatic buy or sell signals without context; it is intended to be integrated into a complete trading strategy.
4H RSI + EMA (Fib optional) with 3:1 R:R + Hybrid ExitAs above.
RSI + 50 EMA & 200MA
3:1 R:R
Exit based on RSI extreme or 200MA Opposition or 3:1 R:R

SulCryptoversity_4H_BuySell_CryptoIndicatorThis strategy is designed specifically for the 4-hour timeframe on trading charts. It works primarily for Bitcoin (BTC) but can also be applied to other high-market-cap cryptocurrencies such as Ethereum (ETH), Solana (SOL), Ripple (XRP), Sui (SUI), and even various other coins.
Please note that this is not financial advice—trading involves significant risk, and you should only proceed at your own discretion. We are not liable for any losses incurred from following these signals.
This strategy may be more effective in leverage trading to maximize gains, but leverage trading is highly risky and only recommended for highly skilled traders, as you could lose all your money. For regular purposes, use spot trading.
To use it effectively, focus on the "Buy" and "Sell" signals for your entry and exit points. While an "Exit Buy" signal may appear, rely solely on the main Buy and Sell indicators for decision-making.
-SulCryptoversity aka yo4Q
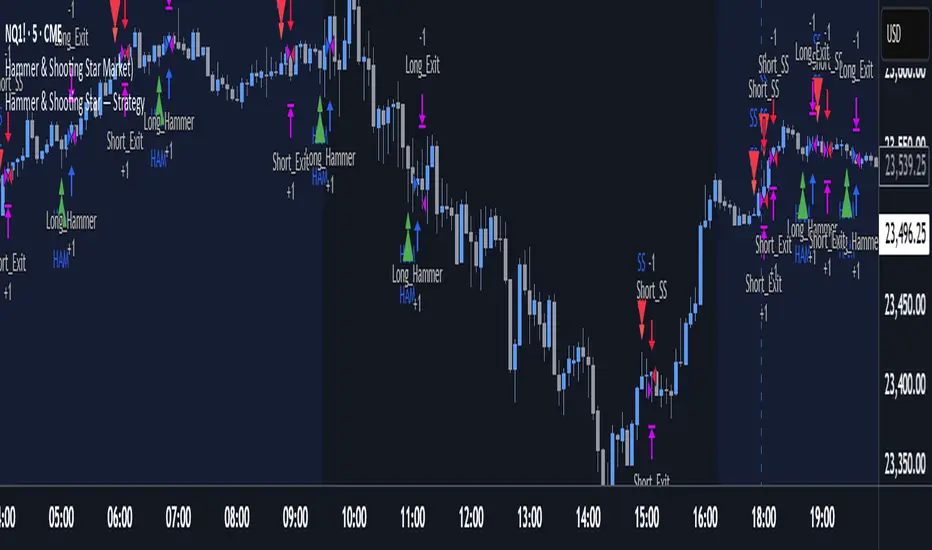
Hammer & Shooting Star — StrategyHammer & Shooting Star Strategy for Intraday Trading
This strategy identifies two candlestick patterns commonly used in technical analysis:
Hammer Candles (a bullish reversal signal):
A hammer candle has a small body at the top with a long lower wick. The strategy goes long on the next bar open when a hammer is detected, with a stop loss at the low of the hammer bar and a target at the high.
Shooting Star Candles (a bearish reversal signal):
A shooting star candle has a small body at the bottom with a long upper wick. The strategy goes short on the next bar open when a shooting star is detected, with a stop loss at the high of the shooting star bar and a target at the low.
RSI-Adaptive T3 [ChartPrime] — Strategy (Long Only, 1D)This trade has been successfully converted from an individual setup to a full strategy, and the results are truly outstanding. I’m currently testing this for Tesla options trading on the 1-day chart, and it appears to be working extremely well.
A special thanks to ChartPrime for creating such a beautifully designed indicator — it’s performing impressively in these tests.
If anyone would like to try it out, feel free to download and see the results for yourself. Thank you!

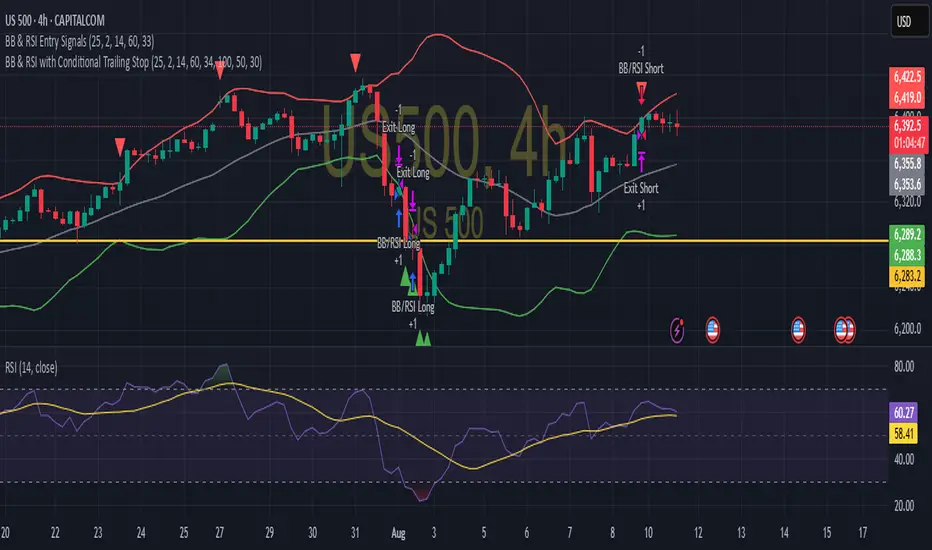
BB & RSI Trailing Stop StrategySimple BB & RSI generated using AI, gets 60% on S&P 500 with the right settings
Gemini Trend Following SystemStrategy Description: The Gemini Trend Following System
Core Philosophy
This is a long-term trend-following system designed for a position trader or a patient swing trader, not a day trader. The fundamental goal is to capture the majority of a stock's major, multi-month or even multi-year uptrend.
The core principle is: "Buy weakness in a confirmed uptrend, and sell only when the uptrend's structure is fundamentally broken."
It operates on the belief that it's more profitable to ride a durable trend than to chase short-term breakouts or worry about daily price fluctuations. It prioritizes staying in a winning trade over frequent trading.
The Three Pillars of the Strategy
The script's logic is built on three distinct pillars, processed in order:
1. The Regime Filter: "Is This Stock in a Healthy Uptrend?"
Before even considering a trade, the script acts as a strict gatekeeper. It will only "watch" a stock if it meets all the criteria of a healthy, long-term uptrend. This is the most important part of the strategy as it filters out weak or speculative stocks.
A stock passes this filter if:
The 50-day Simple Moving Average (SMA) is above the 200-day SMA. This is the classic definition of a "Golden Cross" state, indicating the medium-term trend is stronger than the long-term trend—a hallmark of a bull market for the stock.
The stock's performance over the last year is positive. The Rate of Change (ROC) must be above a minimum threshold (e.g., 15%). This ensures we are only looking at stocks that have already demonstrated significant strength.
The 200-day SMA itself is rising. This is a crucial check to ensure the very foundation of the trend is solid and not flattening out or beginning to decline.
If a stock doesn't meet these conditions, the script ignores it completely.
2. The Entry Trigger: "When to Buy the Dip"
Once a stock is confirmed to be in a healthy uptrend, the script does not buy immediately. Instead, it patiently waits for a point of lower risk and higher potential reward—a pullback.
The entry trigger is a specific, two-step sequence:
The stock price first dips and closes below its 50-day SMA. This signifies a period of temporary weakness or profit-taking.
The price then recovers and closes back above the 50-day SMA within a short period (10 bars).
This sequence is a powerful signal. It suggests that institutional buyers view the 50-day SMA as a key support level and have stepped in to defend it, overpowering the sellers. The entry occurs at this point of confirmed support, marking the likely resumption of the uptrend. On the chart, this event is highlighted with a teal background.
3. The Exit Strategy: "When is the Trend Over?"
The exit logic is designed to keep you in the trade as long as possible and only sell when the trend's character has fundamentally changed. It uses a dual-exit system:
Primary Exit (Trend Failure): The main reason to sell is a "Death Cross"—when the 50-day SMA crosses below the 200-day SMA. This is a robust, albeit lagging, signal that the long-term uptrend is over and a bearish market structure is taking hold. This exit condition is designed to ignore normal market corrections and only trigger when the underlying trend has truly broken. On the chart, this is highlighted with a maroon background.
Safety-Net Exit (Catastrophic Stop-Loss): To protect against a sudden market crash or a company-specific disaster, a "safety-net" stop-loss is placed at the time of entry. This stop is set far below the entry price, typically underneath the 200-day SMA. It is a "just-in-case" measure that should only be triggered in a severe and rapid decline, protecting your capital from an unexpected black swan event.
Who is This Strategy For?
Position Traders: Investors who are comfortable holding a stock for many months to over a year.
Patient Swing Traders: Traders who want to capture large price swings over weeks and months, not days.
Investors using a Rules-Based Approach: Anyone looking to apply a disciplined, non-emotional system to their long-term portfolio.
Ideal Market Conditions
This strategy excels in markets with clear, durable trends. It performs best on strong, leading stocks during a sustained bull market. It will underperform significantly or generate losses in choppy, sideways, or range-bound markets, where the moving averages will frequently cross back and forth, leading to "whipsaw" trades.
