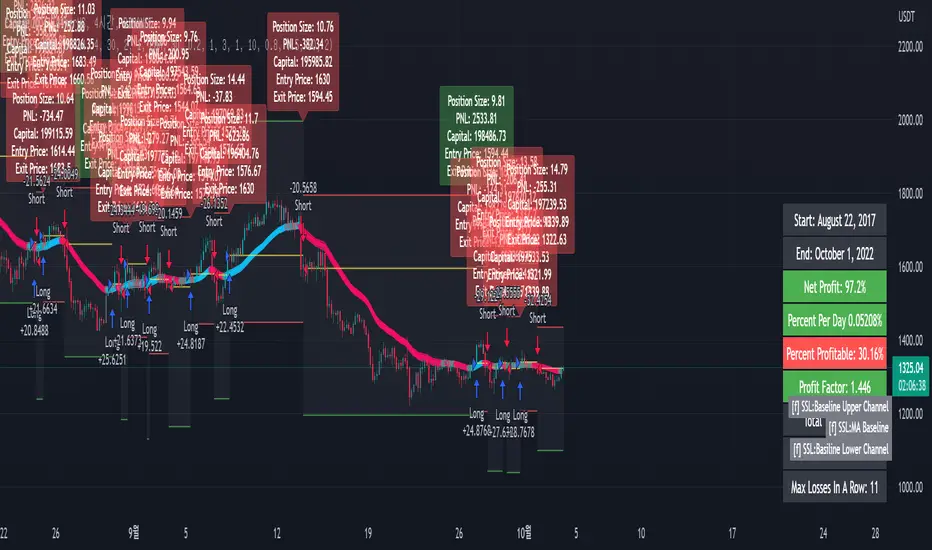
[fpemehd] SSL Baseline StrategyHello Guys! Nice to meet you all!
This is my third script!
This Logic is trend following logic, This detects long & short trends based on SSL Hybrid Baseline.
This fits to the longer time frame like 4hr and 1d.
### Long Condition
1. close > SSL Hybrid baseline upper k
- Baseline is the ma of close price. (You can choose ma type and length)
- Upper k is the upper Keltner Channel.
### Short Condition
1. close < SSL Hybrid baseline lower k
- Baseline is the ma of close price. (You can choose ma type and length)
- Lower k is the lower Keltner Channel.
### Etc
1. Added Stoploss based on highest high or lowest low with lookback.
2. Strategy Template is based on @kevinmck100 template. Thank you!
Trend
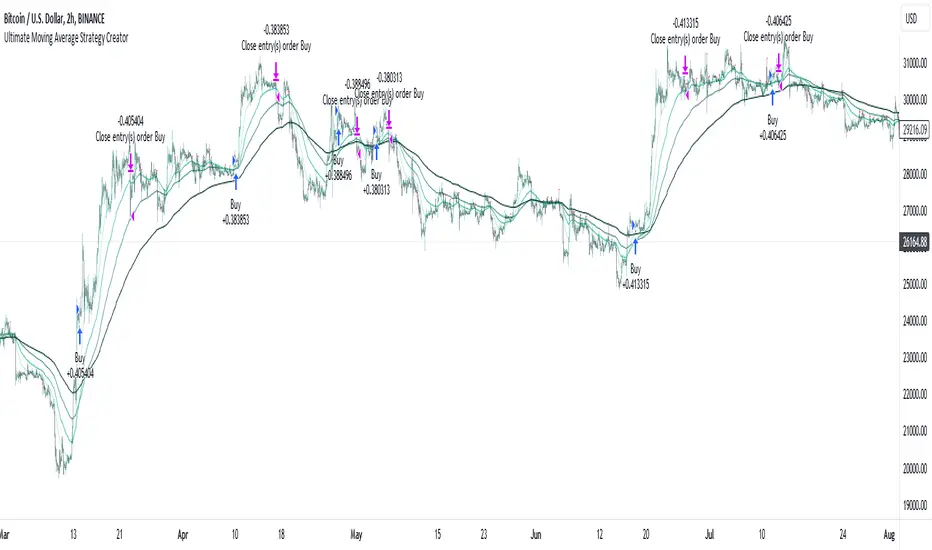
Ultimate Moving Average Strategy CreatorHave you ever wanted to create your OWN strategy, but don't have coding experience? Well now you can.
With simple settings, but millions of potential strategies and combinations, this indicator / strategy lets YOU make ALL the rules.
Start by choosing up to 4 moving averages from all the various types - Simple, Exponential, Hull, Volume-Weighted, etc. Choose the period and choose price source.
Now the fun part.
You select your values to compare and how to compare them. Want to test if the Fast Moving Average crosses over the Slow Moving Average? No problem. Want to add an additional test to check the closing price is greater than the Fast Moving Average? Done.
With additonal options to set take profit % and stop loss %, as well as a date range and the option for 'Long Only' positions, you can instantly see the results of any strategy in the strategy tester, then simply make an adjustment and refine the criteria without having to know or understand any of the complex coding and scripting.
I have tried many popular moving average strategies, but irrespective of the results, the thing that stood out to me was how inflexible they were. If it was designed to test a triple crossover, that's all it could do. With this indicator, literally anything is possible and modifying the parameters couldn't be easier.
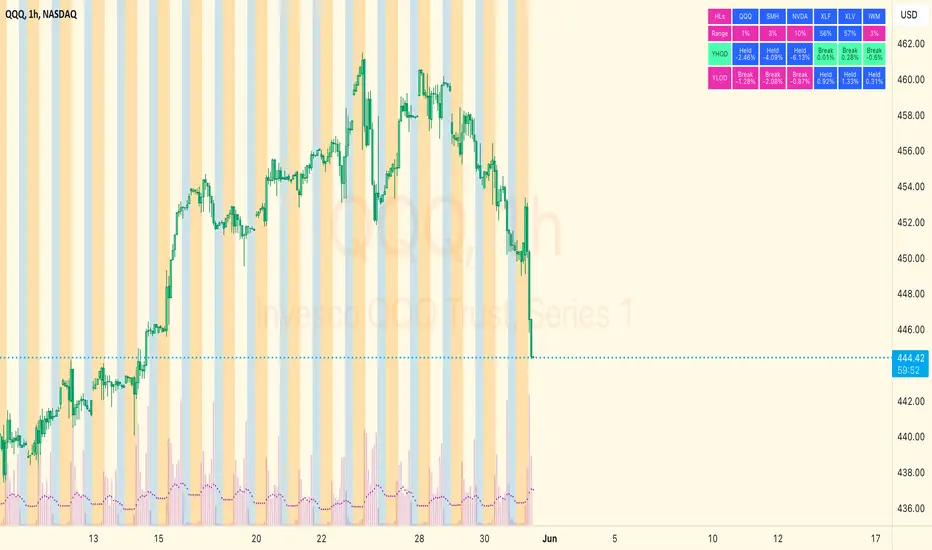
Symbols at Highs & LowsFor the chosen symbols (Defaults to XLV, XLF, IWM, QQQ), this displays a table that indicates (by color) if each symbol is at the high or low of day. When used with the main indexes, If all symbols are at highs or lows together, this can be a great indicator that a trend day is occurring in the market. You can customize the indicator to use up to 8 symbols of your choice. You can also customize the appearance so that it only displays an "All symbols are at the Lows/Highs" message. Finally, you can customize the % threshold to use when measuring how close to the high/low of day price needs to be in order to be considered "at high/low of day".
Dynamically Adjusting EMA Crossing
The Exponential Moving Average is the most commonly used indicator in every market. but no one can predict which pair of exponential moving average crossing will work best together. Every instrument require different EMAs crossing. It can be 2 EMA crossings or 3 EMA crossings.
Dynamically Adjusting EMA crossing tries to solve this issue. Algorithm finds the optimal EMA crossing setting for every instrument across all timeframes based on the EMA lengths provided in the settings. It evaluates the most profitable crossing combination for each instrument. The logic backtests the different combinations of EMA crossing based on the EMA lengths provided in the indicator's settings.
There are 3 EMA options in the settings Fact, Slow and Long. Indicator's Settings have the option to choose 2 EMA crossings or 3 EMA crossings.
Default Settings
Fast : 5 to 10
Slow : 13 to 19
Long : 20 to 60
Please do keep in mind that the performance of the indicator reduces as we increase the default settings range.
Please contact me for access

Wavetrend DivergencesCreated for the MarketCipher Community and friends :)
This indicator is partly based on Wavetrend Oscillator by LazyBear / blue momentum waves on MarketCipher B.
The Wavetrend indicator is a combination of 2 oscillator lines that signals the short term direction of the price once the lines cross. The Wavetrend indicator is useful but only once a divergence has been identified based on the crosses and the price which is what this strategy partly uses to open trades. This indicator signals divergences in the wavetrend, both regular and hidden divergences.
This indicator utilizes support and resistances to make sure that the indicator only signals high probability winning divergences. Supports represents a low level a stock price reaches over time, while resistance represents a high level a stock price reaches over time. Support materializes when a stock price drops to a level that prompts traders to buy. This reactionary buying causes a stock price to stop dropping and start rising and this is where the indicator will be looking for a divergence at a price point of your choosing.
To make it easier i have added a support and resistance drawing indicator that will help you find price points on the chart that the price is likely to get a reaction from. There are right now only 4 support or resistances that can be drawn at one time so make sure to update the levels as the market changes.
I have helped update and modify from the original script. Here it is:
On top of these indicators i have added my own indicator that will signal a short term trend reversal that is based on pivot points and moving averages. This will usually signal reversals earlier than divergences and is very effective when following the trend and using support and resistances and can be used as an extra confirmation that there will be a reaction from the support or resistance and that the divergence will play out like you want it to. These trend reversal dots can also be used to take profit.
Trade setup example:
As seen in the picture below price comes down to a previously drawn support line, then there is a trend reversal dot that signal a potential reversal and finally a divergence is signalled once there is a clear reaction to the support. When all these signals come together there is a high probability that the trade will end up in profit. To take profit in this trade setup you can use the trend reversal dots, the drawn resistances or your own intuition and technical analysis with Marketcipher B and DBSI. A stop loss in this trade setup could be at the swing low, below the blue or teal line.
There are alerts for everything so that you wont miss a trade setup. Hope you like it :)
I have some ideas on how to improve the indicator so there will be updates in the future.

Strategy Myth-Busting #8 - TrendSurfers+TrendOsc - [MYN]This is part of a new series we are calling "Strategy Myth-Busting" where we take open public manual trading strategies and automate them. The goal is to not only validate the authenticity of the claims but to provide an automated version for traders who wish to trade autonomously.
Our 8th one is an automated version of the " 653% Gain Magical 1 Minute Scalping Strategy Tested 100 Times | Become Consistently Huge Profit " strategy from " Fxaccurate US " who claims to have achieved 653% profit scalping GOLD on the 5 minute timeframe. As you can see from the backtest results below, I was unable to substantiate anything close to that that claim on any timeframe or symbol. Myth 10000% busted.
If you know of or have a strategy you want to see myth-busted or just have an idea for one, please feel free to message me.
This strategy uses a combination of 2 open-source public indicators:
Trend Surfers - Premium Breakout + Alerts by TrendSurfersSignals
Mawreez' Trend Oscillator Indicator by Mawreez
Trading Rules:
1 min - 15 min candles
Stop loss middle between high and low Risk 1:2
Long Condition
Trend Surfers Trailing stop line goes below (Crosses) lowest low
Bullish Candle (red)
Mawreeze Trend Oscilator Indicator is green
Short Condition
Trend Surfers Trailing stop line goes above (Crosses) highest high
Bearish Candle (red)
Mawreeze Trend Oscilator Indicator is red

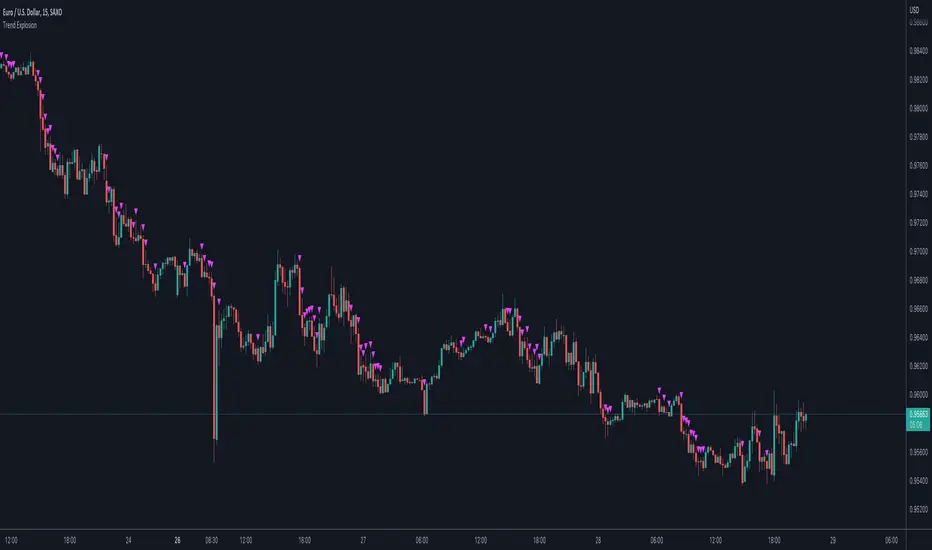
Trend ExplosionThis script features a combination of trend indicators. Upon backtesting various indicators and how price action reacts to past signals, I discovered that using a combination of conditions would allow for a simple, easy-to-use, yet (in my opinion) accurate representation of current market sentiment. I typically use this on the 5/15 minute charts as I reference higher timeframe conditions. If you would like to trade the 1 hour and above timeframes, you would have to manually adjust the timeframe you want under "Resolution". Another thing to note is that this script provides a REFERENCE for trends. It does not provide entry and exit signals and you would have to discretionarily determine those yourself.
Long sentiment = Green triangles below the bar
Short sentiment = Fuchsia triangles above the bar
Due to a large amount of effort and time taken into creating this script, I have decided to protect the source code. If you do have any suggestions, you can feel free to drop me a DM.
Trend BandsThis script is, yet again, another mean reversion indicator. When the trend index touches the upper / lower bands, there seems to be a decent probability that the market might reverse at that area. However, I do emphasise on exercising caution when trading against the current wave of the market as there are instances where the trend index extends past the upper / lower bands for a prolonged period of time. However, in a non-trending semi-consolidated market, this script seems to do quite well for itself. Enjoy!

MA Simple Strategy with SL & TP & ATR FiltersHello Guys! Nice to meet you all!
This is my second script!
This Logic is trend following logic, This detects long & short trends by comparing the value of MAs.
This fits to the longer time frame.
### Long Condition
1. Compare 4 MAs (you can chose MA Type)
- Shortest MA (MA 1)
- Shorter MA (MA 2)
- Normal MA (MA 3)
- Longer MA (MA 4)
2. If MA 1 > MA 2 > MA 3 > MA 4, then Enter Long Position
- ‘The arrangement of MAs in descending orders’ is the proxy of the long trend.
### Short Condition
1. Compare 4 MAs (you can chose MA Type)
- Shortest MA (MA 1)
- Shorter MA (MA 2)
- Normal MA (MA 3)
- Longer MA (MA 4)
2. If MA 1 < MA 2 < MA 3 < MA 4, then Enter Short Position
- ‘The arrangement of MAs in ascending orders’ is the proxy of the short trend.
### Close Condition
1. When trend Changes
- When (MA 1 > MA 2 > MA 3 > MA 4) breaks or (MA 1 < MA 2 < MA 3 < MA 4) breaks.
2. When the price hits the stoploss
3. When the price hits the take profit level (basically 50% of qty will be closed)
### Etc
1. Trend filter (ATR should be bigger than SMA of ATR)
- If the volatility of price is to small (ATR), then there could be false signal. To filter this out, I used the condition ‘ATR should be larger than SMA of ATR’.
2. Stoploss
- Enabled Stoploss based on ATR, Percent, Risk-Reward Ratio,
- Enabled Trailing Stoploss.
3. Choose MA Type
- You can choose MA Type
+ Thanks for the stoploss template @jason5480

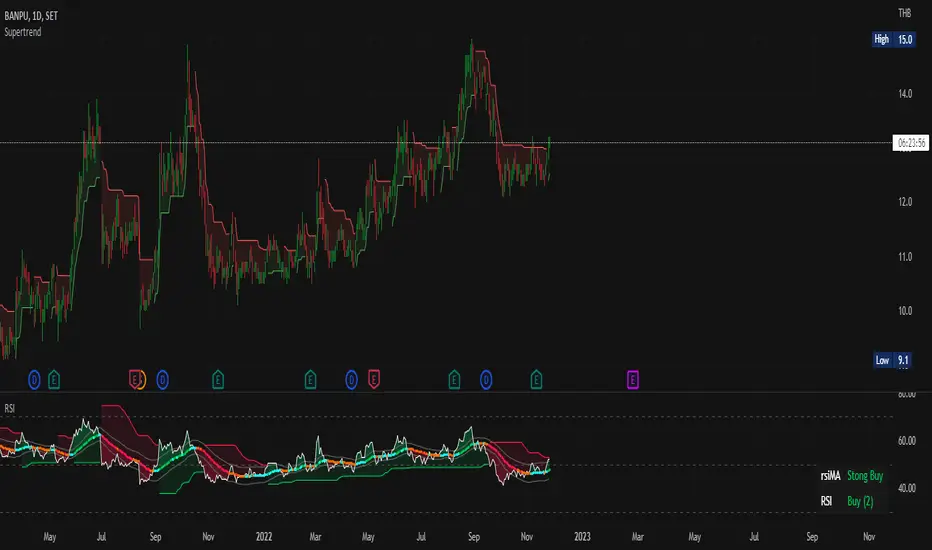
Modified Color Relative Strength IndexThis indicator is old normal RSI, but I have Modified its Color, to make trade able to investigate the trend easier
This indicator uses the concept of:
- RSI Relative Strength Index
- and Many Different MA (For example EMA SMA RMA LSMA WMA etc.)
There are 2 line displays in this indicator
1) Normal RSI line, Default is set as White color
2) MA line which calculates from RSI, a trader can choose the model to calculate RSIMA in setting
How Modified Color Relative Strength Index work?
We use RSI as we normally use, but the RSIMA is a little different in this Indicator
I use the idea that if RSI is over RSIMA, the Trend seems to be Uptrend which will display as a Green color filled. Same as if RSI is lower than RSI MA that trend seems to be a Down Trend.
With this idea, we can identify the trend of the chart but we still don't know whether the trend is strong or not, to satisfy this problem the change rate of RSIMA came into its role.
Now let me reviewing you some of my 5-grade math ideas:
Remember how to calculate the Average value? that's right we sum all of the values and divide it all by the amount of the number
for example, we want to calculate the average value of 1 2 3 4 5 so it should be (1+2+3+4+5)/5 which is the amount of number and then we get the average value of 1 2 3 4 5 = 3
now apply that concept to the change in RSIMA value
There will be 3 stages of the color displayed in RSIMA
1) Green will be displayed if the rate of change or RSIMA is over X time average rate of change of this RSIMA while trader and change X in the setting (Positive value)
2) Red will be displayed if the rate of change or RSIMA is over X time average rate of change of this RSIMA while trader and change X in the setting (Negative value)
3) Light Blue and Orange (Gray) will be displayed if the rate of change or RSIMA is not over X time average rate of change of this RSIMA while trader and change X in the setting if the recently is red the RSIMA line will be orange while it is green, RSIMA will be color in Light Blue
Green and Red can be a help to confirm, how strong the trend is. While Light blue and Orange mean there is a small amount of change so traders should be prepared to Buy/Sell
Use of Modified Color Relative Strength Index
When the area between RSI and RSIMA is Green and RSIMA is colored in Green, That is a Strong Uptrend
Same a Strong Down Trend, area between RSI and RSIMA need to be RED and RSIMA colored in red too,
other than this is considered as a sideway Trend or weak Trend
Apply RSI with other Indicator
- You can use any indicator that can help you enter the trade easier with it
- I personally use it with MACD, BB Band, and UT Bot Alerts
Bollinger BandsThis strategy is inspired from Power of Stock aka Subhasish Panni.
Target is minimum 1:3 when you get this setup right.
Buy when:
1) Low is greater than upper band of BB and next candle breaks high of that candle, SL is Low of previous candle which is has low above upper band.
2) High is lower than lower band of BB and next candle breaks high of that candle, SL is low of previous candle which has high lower than lower band.
Sell when:
1) Low is greater than upper band of BB and next candle breaks low of that candle, SL is high of previous candle which is has low above upper band.
2) High is lower than lower band of BB and next candle breaks high of that candle, SL is high of previous candle which has high lower than lower band.
Disclaimer: this setup will cause many small stoploss hit, you have to accept that loss but you will be profitable because of R:R.

Tradesharpe Session BiasThis script is designed for traders who want help defining their session bias it is for people who trade in sessions which will most likely be 1 4h candle. The way I trade using Price action to get my daily bias, to either look for sells or buys or both I look at the previous daily candle close and previous 4hr candle close before analyzing the structure on the lower time frames to get my session bias of bullish/bearish. so this indicator compares the daily and 4hr candles to develop a bias for example
previous daily bullish + Previous 4hr Bullish = BULLISH BIAS
previous daily Bearish + Previous 4hr Bearish = BEARISH BIAS
if Daily bullish 4hr bearish = MIXED SESSION
if daily bearish 4hr bullish = MIXED SESSION
MIXED SESSION = Can argue both buys and sells
BEARISH SESSION = Best to look for Sells only based on my trading style
BULLISH SESSION = Best to look for Buys only based on my trading style

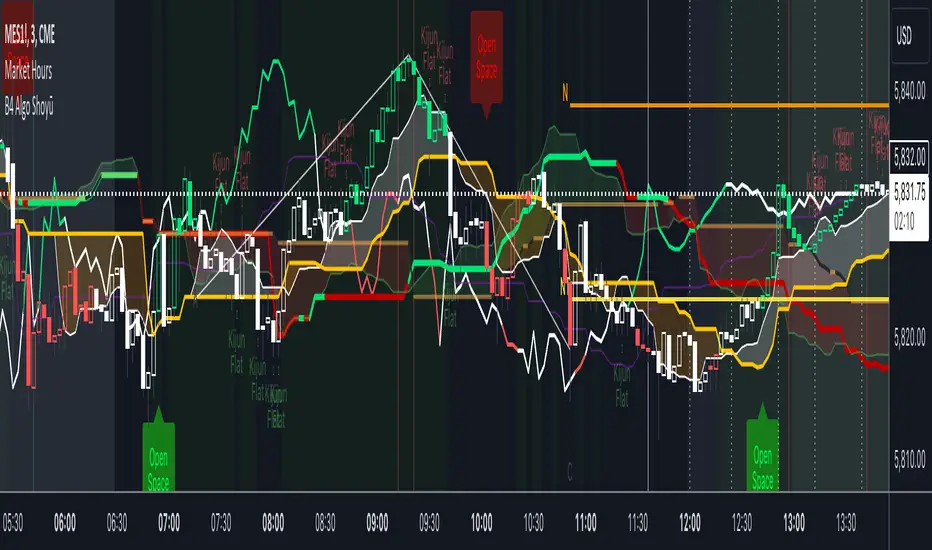
B4Signals Ichimoku Premium Addon ShoyūThis indicator is based on "Ichimoku" with additional and useful features. It is designed to complement B4Signals Ichimoku as an add-on.
FEATURES
The indicator is mainly divided into 5 parts:
* Future Tenkan-sen, Kijun-sen & Kumo Lines: Tenkan-sen next 5 days projection, Kijun-sen next 10 days, Senko Span A next 5 days and Senko Span B next 14 days will be displayed to increase depth of your analysis and help forecast price movements.
* QualityLine + DirectionLine for determining beginning and end of trend as well as a visual to spot Kijun bounces and crosses.
* 9 /26 Tenke-sen/Kijun-sen pullback detection lines, “KISS Lines”, for better entries on pullbacks.
* Flat Kijun-sen signal to determine trend exhaustion and possible reversals.
* Open Space Chikou coloring and confirmation signal for Identifying momentum breakouts and spotting areas of projected consolidation.
* Ichimoku Hosoda Target Price Targets. Simply choose point A,B and C and have 4 Hosoda price targets appear on your chart.
The addition of these features provides traders with a collection of technical metrics capable of outlining directional trend momentum, proposed pullbacks and possible continuations in any financial market. Using multiple plots, this indicator plots a forecast where the Han-ne lines might travel in the future. The Direction line gives you a clear perspective of price in relation to the Kijun. While the Quality Line gauges the health or quality of the Kumo, helping determine entries and exits, while confirming pullbacks and areas of consolidation. The “KISS Lines” help identify Tenken-sen / Kijun-sen 9/26 pullbacks and the Kijun Flat alert signals you when trend exhaustion is identified by a flat Kijun-sen.
Another significant aspect of this indicator is that it identifies the Chikou Span reaching ‘Open Space' by coloring the Chikou Span's line giving you a signal as well. This can help traders identify the market’s dominant trend (bullish or bearish) and determine an appropriate time to enter/exit active positions.
Disclaimer
Copyright by B4Signals.
The information contained in our scripts/indicators/ideas does not constitute financial advice or a solicitation to buy or sell any securities of any type. We will not accept liability for any loss or damage, including without limitation any loss of profit, which may arise directly or indirectly from the use of or reliance on such information.
All investments involve risk, and the past performance of a security, industry, sector, market, financial product, trading strategy, or individual’s trading does not guarantee future results or returns. Investors are fully responsible for any investment decisions they make. Such decisions should be based solely on an evaluation of their financial circumstances, investment objectives, risk tolerance, and liquidity needs.
NSDT MA+ADXThis script combines Moving Averages with ADX Strength, but with an added bonus. Rather than having the Moving Average line always plot on the chart, it will reference the ADX strength based on the settings by the trader.
This way, the Moving Average will not show on the chart unless there is also a strong direction in the trend. This may potentially be used to help with entries when trend trading due to adding the ADX for trend strength.
In the examples below, the ADX settings in the MA+ADX indicator are matched with the settings of a standalone ADX indicator at the bottom of the chart (not included, just for reference).
MA+ADX
prnt.sc
ADX Only
prnt.sc
You will see how the MA only plots when the ADX is over the threshold, currently set at 25. (arrows drawn to indicate confluence)

Volatility Stop with Vwap StrategyFirst the credits goes to @TradingView for their release of the volatility stop mtf indicator.
I have took it, and inside I have added a weekly vwap for a better trend direction and at the same time I have added a dynamic risk managment which is calculated from the distance between the volatility line to the close of the candle.
The rules for entry are simple:
For long:We enter when our close of the candle is above the volatility stop line and at the same time the close of the candle is above weekly vwap
For short we enter when our close of the candle is below the volatility stop line and at the same time the close of the candle is below weekly vwap.
We exit when we either have a reverse signal than the one we enterred, or based on the TP/SL which is calculated with the distance from vwap to the close of the candle.
If you have any questions please let me know !

MACD strategy + Trailstop indicatorWelcome traveler !
Here is my first indicator I made after 3 days of hardlearning pine code (beginner in coding).
I hope it will please you, if you have any suggestion to enhance this indicator, do not hesitate to give me your thoughts in the comments section or by Private message on trading View !
How does it works ?
It's a simple MACD strategy as describe here :
Uses of EMA 200 as a trend confirmer,
For sells :
When above Zero line (MACD) and under EMA200, we go on sell (background color is red)
For buys:
When under Zero line (MACD) and above EMA 200, we go on Buy (back ground color is green)
FILTERS !
I haded one filter to reduce noise on the indicator :
Signals aren't taken if one of the 14 last candles closed on the other side of the EMA 14.
What are the green and red lines ?
The green line is equivalent of a potential stop loss as a buyer side, same for the red one on seller side !
To make the space with the price bigger, please use "ATR multiplier" in the input options of the indicator while on your chart !
Is it timeframe specific ?
Hell no it is not timeframe specific ! You can try to use it on every timeframe !
As usual, I like to remind you that the best way to test an indicator is to go backtest it or to paper trade before using it on real market conditions !
If you find an idea of filter for a specific timeframe, do not hesitate to contact me ! I'll try to do my best to enhance this indicator as the time goes !
Is there repainting ?
There is no repainting on confirmation !
There's only a movement that I don't know how to ignore on the current open candle for the trail stop indicator I built, it should not be a problem if you place alerts to automatise your trading on the close of the candle, and not the high or low !
If you know how to resolve this problem with my code, I would be glad to get your tips to enhance the script ! :)
Example of the indicator in market (backtest, as said, no repaint on confirmation) :

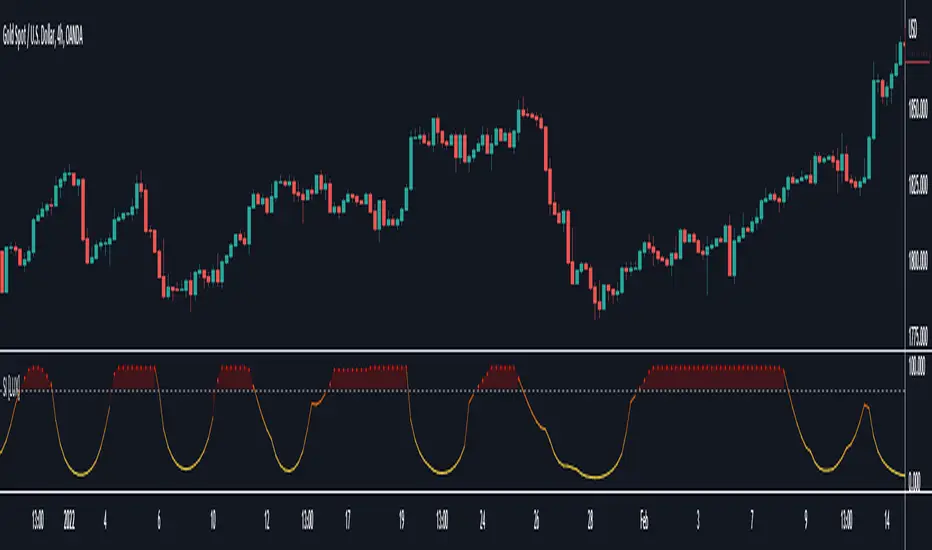
Better DiNapoli Stoch oscillator with buy/sell signals and alertThis version of Joe DiNapoli stochastic oscillator uses only one line for a better overview. Signals are displayed as soon as the line exceeds or falls below the center line. Also the candle color changes with this signal.
Alarms can also be set for these signals.
As long as the current candle is not closed, the line is displayed in yellow.
The following settings can be made:
- Lockback periode for highest high and lowest low
- Smoothing
- Candle Color
- Stochastic line color
This indicator works well with indicators such as EMA or others.
Have fun using it.

ATR Trend FollowingThe script filters stocks on the basis of ATR. If the stock has moved above 7 times the ATR from the lows, the system generates buy signal and continues till the stock drops by 2 ATR. It is a good system in trending markets however in sideways consolidating markets, the system must be avoided. In trending markets it can generate good returns with significant Risk to Reward Ratio. Use it in confirmation with other trend depicting indicators is expected to generate better results.

FDI-Adaptive Non-Lag Moving Average [Loxx]FDI-Adaptive Non-Lag Moving Average is a Fractal Dimension Index adaptive Non-Lag moving Average. This acts more like a trend coloring indictor with gradient coloring.
What is the Fractal Dimension Index?
The goal of the fractal dimension index is to determine whether the market is trending or in a trading range. It does not measure the direction of the trend. A value less than 1.5 indicates that the price series is persistent or that the market is trending. Lower values of the FDI indicate a stronger trend. A value greater than 1.5 indicates that the market is in a trading range and is acting in a more random fashion.
Included
Bar coloring
Loxx's Expanded Source Types

STD-Adaptive T3 [Loxx]STD-Adaptive T3 is a standard deviation adaptive T3 moving average filter. This indicator acts more like a trend overlay indicator with gradient coloring.
What is the T3 moving average?
Better Moving Averages Tim Tillson
November 1, 1998
Tim Tillson is a software project manager at Hewlett-Packard, with degrees in Mathematics and Computer Science. He has privately traded options and equities for 15 years.
Introduction
"Digital filtering includes the process of smoothing, predicting, differentiating, integrating, separation of signals, and removal of noise from a signal. Thus many people who do such things are actually using digital filters without realizing that they are; being unacquainted with the theory, they neither understand what they have done nor the possibilities of what they might have done."
This quote from R. W. Hamming applies to the vast majority of indicators in technical analysis . Moving averages, be they simple, weighted, or exponential, are lowpass filters; low frequency components in the signal pass through with little attenuation, while high frequencies are severely reduced.
"Oscillator" type indicators (such as MACD , Momentum, Relative Strength Index ) are another type of digital filter called a differentiator.
Tushar Chande has observed that many popular oscillators are highly correlated, which is sensible because they are trying to measure the rate of change of the underlying time series, i.e., are trying to be the first and second derivatives we all learned about in Calculus.
We use moving averages (lowpass filters) in technical analysis to remove the random noise from a time series, to discern the underlying trend or to determine prices at which we will take action. A perfect moving average would have two attributes:
It would be smooth, not sensitive to random noise in the underlying time series. Another way of saying this is that its derivative would not spuriously alternate between positive and negative values.
It would not lag behind the time series it is computed from. Lag, of course, produces late buy or sell signals that kill profits.
The only way one can compute a perfect moving average is to have knowledge of the future, and if we had that, we would buy one lottery ticket a week rather than trade!
Having said this, we can still improve on the conventional simple, weighted, or exponential moving averages. Here's how:
Two Interesting Moving Averages
We will examine two benchmark moving averages based on Linear Regression analysis.
In both cases, a Linear Regression line of length n is fitted to price data.
I call the first moving average ILRS, which stands for Integral of Linear Regression Slope. One simply integrates the slope of a linear regression line as it is successively fitted in a moving window of length n across the data, with the constant of integration being a simple moving average of the first n points. Put another way, the derivative of ILRS is the linear regression slope. Note that ILRS is not the same as a SMA ( simple moving average ) of length n, which is actually the midpoint of the linear regression line as it moves across the data.
We can measure the lag of moving averages with respect to a linear trend by computing how they behave when the input is a line with unit slope. Both SMA (n) and ILRS(n) have lag of n/2, but ILRS is much smoother than SMA .
Our second benchmark moving average is well known, called EPMA or End Point Moving Average. It is the endpoint of the linear regression line of length n as it is fitted across the data. EPMA hugs the data more closely than a simple or exponential moving average of the same length. The price we pay for this is that it is much noisier (less smooth) than ILRS, and it also has the annoying property that it overshoots the data when linear trends are present.
However, EPMA has a lag of 0 with respect to linear input! This makes sense because a linear regression line will fit linear input perfectly, and the endpoint of the LR line will be on the input line.
These two moving averages frame the tradeoffs that we are facing. On one extreme we have ILRS, which is very smooth and has considerable phase lag. EPMA has 0 phase lag, but is too noisy and overshoots. We would like to construct a better moving average which is as smooth as ILRS, but runs closer to where EPMA lies, without the overshoot.
A easy way to attempt this is to split the difference, i.e. use (ILRS(n)+EPMA(n))/2. This will give us a moving average (call it IE /2) which runs in between the two, has phase lag of n/4 but still inherits considerable noise from EPMA. IE /2 is inspirational, however. Can we build something that is comparable, but smoother? Figure 1 shows ILRS, EPMA, and IE /2.
Filter Techniques
Any thoughtful student of filter theory (or resolute experimenter) will have noticed that you can improve the smoothness of a filter by running it through itself multiple times, at the cost of increasing phase lag.
There is a complementary technique (called twicing by J.W. Tukey) which can be used to improve phase lag. If L stands for the operation of running data through a low pass filter, then twicing can be described by:
L' = L(time series) + L(time series - L(time series))
That is, we add a moving average of the difference between the input and the moving average to the moving average. This is algebraically equivalent to:
2L-L(L)
This is the Double Exponential Moving Average or DEMA , popularized by Patrick Mulloy in TASAC (January/February 1994).
In our taxonomy, DEMA has some phase lag (although it exponentially approaches 0) and is somewhat noisy, comparable to IE /2 indicator.
We will use these two techniques to construct our better moving average, after we explore the first one a little more closely.
Fixing Overshoot
An n-day EMA has smoothing constant alpha=2/(n+1) and a lag of (n-1)/2.
Thus EMA (3) has lag 1, and EMA (11) has lag 5. Figure 2 shows that, if I am willing to incur 5 days of lag, I get a smoother moving average if I run EMA (3) through itself 5 times than if I just take EMA (11) once.
This suggests that if EPMA and DEMA have 0 or low lag, why not run fast versions (eg DEMA (3)) through themselves many times to achieve a smooth result? The problem is that multiple runs though these filters increase their tendency to overshoot the data, giving an unusable result. This is because the amplitude response of DEMA and EPMA is greater than 1 at certain frequencies, giving a gain of much greater than 1 at these frequencies when run though themselves multiple times. Figure 3 shows DEMA (7) and EPMA(7) run through themselves 3 times. DEMA^3 has serious overshoot, and EPMA^3 is terrible.
The solution to the overshoot problem is to recall what we are doing with twicing:
DEMA (n) = EMA (n) + EMA (time series - EMA (n))
The second term is adding, in effect, a smooth version of the derivative to the EMA to achieve DEMA . The derivative term determines how hot the moving average's response to linear trends will be. We need to simply turn down the volume to achieve our basic building block:
EMA (n) + EMA (time series - EMA (n))*.7;
This is algebraically the same as:
EMA (n)*1.7-EMA( EMA (n))*.7;
I have chosen .7 as my volume factor, but the general formula (which I call "Generalized Dema") is:
GD (n,v) = EMA (n)*(1+v)-EMA( EMA (n))*v,
Where v ranges between 0 and 1. When v=0, GD is just an EMA , and when v=1, GD is DEMA . In between, GD is a cooler DEMA . By using a value for v less than 1 (I like .7), we cure the multiple DEMA overshoot problem, at the cost of accepting some additional phase delay. Now we can run GD through itself multiple times to define a new, smoother moving average T3 that does not overshoot the data:
T3(n) = GD ( GD ( GD (n)))
In filter theory parlance, T3 is a six-pole non-linear Kalman filter. Kalman filters are ones which use the error (in this case (time series - EMA (n)) to correct themselves. In Technical Analysis , these are called Adaptive Moving Averages; they track the time series more aggressively when it is making large moves.
Included
Bar coloring
Loxx's Expanded Source Types

KERPD Noise Filter - Kaufman Efficiency Ratio and Price DensityThis indicator combines Kaufman Efficiency Ratio (KER) and Price Density theories to create a unique market noise filter that is 'right on time' compared to using KER or Price Density alone. All data is normalized and merged into a single output. Additionally, this indicator provides the ability to consider background noise and background noise buoyancy to allow dynamic observation of noise level and asset specific calibration of the indicator (if desired).
The basic theory surrounding usage is that: higher values = lower noise, while lower values = higher noise in market.
Notes: NON-DIRECTIONAL Kaufman Efficiency Ratio used. Threshold period of 30 to 40 applies to Kaufman Efficiency Ratio systems if standard length of 20 is applied; maintained despite incorporation of Price Density normalized data.
TRADING USES:
-Trend strategies, mean reversion/reversal/contrarian strategies, and identification/avoidance of ranging market conditions.
-Trend strategy where KERPD is above a certain value; generally a trend is forming/continuing as noise levels fall in the market.
-Mean reversion/reversal/contrarian strategies when KERPD exits a trending condition and falls below a certain value (additional signal confluence confirming for a strong reversal in price required); generally a reversal is forming as noise levels increase in the market.
-A filter to screen out ranging/choppy conditions where breakouts are frequently fake-outs and or price fails to move significantly; noise level is high, in addition to the background buoyancy level.
-In an adaptive trading systems to assist in determining whether to apply a trend following algorithm or a mean reversion algorithm.
THEORY / THOUGHT SPACE:
The market is a jungle. When apex predators are present it often goes quiet (institutions moving price), when absent the jungle is loud.
There is always background noise that scales with the anticipation of the silence, which has features of buoyancy that act to calibrate the beginning of the silence and return to background noise conditions.
Trend traders hunt in low noise conditions. Reversion traders hunt in the onset of low noise into static conditions. Ranges can be avoided during high noise and buoyant background noise conditions.
Distance between the noise line and background noise can help inform decision making.
CALIBRATION:
- Set the Noise Threshold % color change line so that the color cut off is where your trend/reversion should begin.
- Set the Background Noise Buoyancy Calibration Decimal % to match the beginning/end of the color change Noise Threshold % line. Match the Background Noise Baseline Decimal %' to the number set for buoyancy.
- Additionally, create your own custom settings; 33/34 and 50 length also provides interesting results.
- A color change tape option can be enabled by un-commenting the lines at the bottom of this script.
Market Usage:
Stock, Crypto, Forex, and Others
Excellent for: NDQ, J225, US30, SPX
Market Conditions:
Trend, Reversal, Ranging

Squeeze Index [LuxAlgo]The Squeeze Index aims to measure the action of price being squeezed, and is expressed as a percentage, with higher values suggesting prices are subject to a higher degree of compression.
Settings
Convergence Factor: Convergence factor of exponential envelopes.
Length: Period of the indicator.
Src: Source input of the indicator.
Usage
Prices being squeezed refer to the action of price being compressed within a tightening area. Prices in a tight area logically indicate a period of stationarity, price breaking out of this area will generally indicate the trader whether to buy or sell depending on the breakout direction.
The convergence factor and length settings both play an important role in the returned indicator values. A convergence factor greater than the period value will detect more squeezed prices area, while a period greater than the convergence will return fewer detected squeezed areas.
We recommend using a convergence factor equal to the period setting or a convergence factor twice as high.
The above chart makes use of a convergence factor of 100 and a period of 10.
Due to the calculation method, it is possible to see retracements being interpreted as price squeezing. This effect can be emphasized with higher convergence factor values.
Details
In order to measure the effect of price being squeezed in a tighter area we refer to damping, where the oscillations amplitude of a system decrease over time. If the envelopes of a damped system can be estimated, then getting the difference between the upper and lower extremity of these envelopes would return a decreasing series of values.
This approach is used here. First the difference between the exponential envelopes extremities is obtained, the logarithm of this difference if obtained due to the extremities converging exponentially toward their input.
We then use the correlation oscillator to get a scaled measurement.
SuperTrend Support & Resistance(My goal creating this indicator) : Provide a way to categorize and label key structures on multiple time frames so I can create a plan based on those observable facts.
The Underlying Concept / What is Momentum?
The Momentum shown is derived from a Mathematical Formula, SUPERTREND. When price closes above Supertrend Its bullish Momentum when its below Supertrend its Bearish Momentum. On the first bar bearish momentum is detected a resistance Level is made at the highest point of the previous bullish condition. On the first bar bullish momentum is detected a support Level is made at the lowest point of the previous bearish condition. As I become a better analyst I will find better techniques and this source code may become open-source, but as of now it remains protected. This indicator scans for bullish & bearish Momentum on the Timeframes selected by the user and when there is a shift in momentum on any of those time frames (price closes below or above SUPERTREND ) it notifies the trader with a Supply or Demand level with a unique color and Size to signify the severity of said level.
What is Severity?
Severity is How we differentiate the importance of different Highs and Lows. If Momentum is detected on a higher timeframe the Supply or Demand Level is updated. The Color and Size representing that higher timeframe will be shown. Demand and Supply Levels made by higher Timeframes are more SEVERE then a demand level made by a lower Timeframe.
Technical Inputs
- If you want to optimize the rate of signals to better fit your trading plan you would change the Factor input and ATR Length input. Increase factor and ATR Length to decrease the frequency of signals and decrease the Factor and ATR Length to increase the frequency of signals.
- to ensure the correct calculation of Support and Resistance levels change BAR_INDEX. BAR_INDEX creates a buffer at the start of the chart. For example: If you set BAR_INDEX to 300. The script will wait for 300 bars to elapse on the current chart before running. This allows the script more time to gather data. Which is needed in order for our dynamic lookback length to never return an error(Dynamic lookback length cant be negative or zero). The lower the timeframe the greater the amount of bars need. For Example if I open up a 30 sec chart I would enter 5000 as my BAR_INDEX since that will provide enough data to ensure the correct calculation of Support and Resistance levels.
Time Frame Inputs
- The indicator has 3 Time Frame Displays where you can choose how SEVERE You want the Supply and Demand Levels. For Example: 1min, 3min, 5min, 15 min Levels, 60 min levels Weekly Levels, etc.....The higher the Timeframe Selected the more SEVERE the Level.
- Use the Amount of time Frames input to increase or limit the amount of time frames that will be displayed onto the chart.
Display Inputs
- The toggle (Trend or Basic) option Lets the trend determine the colors of the Support and Resistance Levels or Basic where the color is strictly based on if its a high or a low ( Trend = HH,HL,LL,LH)
- Toggle options (Close) and (High & Low) creates Support and Resistance Levels using the Lowest close and Highest close or using the Lowest low and Highest high.
Toggle on both or toggle off both in order to use both these values when determining the trend of your chart. For Example this would mean (Price has to close higher then the highest high. Not only make a higher high or a
higher close) and the inverse (Price has to close lower then the lowest low. Not only make a lower low or a lower close)
How Trend Is being Determined ?
(Previous Supply Level > Current Supply Level ) if this statement is true then its s LH so the trend is bearish if this statement is false then its a HH so the trend is bullish
(Previous Demand Level > Current Demand Level ) if this statement is true then its a LL so the trend is bearish if this statement is false then its a HL so the trend is bullish
(Close > Current Supply Level ) if this statement is true technically price made a HH so the trend is bullish
(Close < Current Demand Level ) if this statement is true technically price made a LL so the trend is bearish
- Fully customize how you display and label Market Structure in specific timeframes. Line Length, Line Width, Line Style, Label Distance, Label Size, Label Background Size, and Background Color can all be customized.
- Lastly Is the Trend Chart. To Easily verify the current trend of any timeframes displayed by this indicator toggle on Chart On/Off . You also get the option to change the Chart Position and the size of the Trend Chart
*****The Current charts timeframe has to lower then a month to ensure correct calculation of Supply and Demand Levels*****
How it can be used ?
(Examples of Different ways you can use this indicator) : Easily categorize the severity of each and every Supply or Demand Level in the market (The higher the time frame the stronger the level)
: Quickly Determine the trend of any Timeframe
: Get a consistent view of a market and how different time frames are behaving but just use one chart.
: Take the discretion from hand drawing support and resistance lines out of your trading
: Find and categorize strong levels for potential breakouts
: Trend Analysis, Use multiple time frames to create a narrative based on observable facts from these time frames
: Different Targets to take money off the table
: Use labels to differentiate between different trend line setups
: Find Great places to move your stop loss too.
