Directional Movement RibbonWhat makes this different from directional movement index?
The aim is to reduce the amount of data analysis necessary before taking action; currently using DMI requires reviewing the DM+ and DM- plots, and ADX as well as review the overall trend of each one. Also there is the final analysis to determine whether a strong trend hasn’t been established at all.
This indicator condenses the information found from the standard DMI into an intuitive colored ribbon that reveals direction and strength at a glance.
How to use it?
Review the ribbon for sentiment based on color, green being bullish and red being bearish, (if using default color scheme). The brightness of the color determines the strength of the sentiment, brightest being strongest. If no color is represented at all then it is due to weakness and/or lack of direction.
Features
All colors customizable
Toggle display of indecision areas
Adjust levels considered strong, weak trends
Which markets is this meant for?
This can be used in any market, though it’s recommended to use with liquid markets where direction and strength can be found often.
What conditions?
Recommend to utilize with key levels and most commonly utilized moving average periods such as 20, 50, 100 or 200.
Trend

ATR Trend Bands [Misu]█ This indicator shows an upper and lower band based on price action and ATR (Average True Range)
The average true range (ATR) is a market volatility indicator used in technical analysis.
█ Usages:
The purpose of this indicator is to identify changes in trends and price action.
It is mainly used to identify breaking points and trend reversals.
But it can also be used to show resistance or support levels.
█ Features:
> Buy & Sell Alerts
> Buy & Sell Labels
> Color Bars
> Show Bands
█ Parameters:
Length: Length is used to calculate ATR.
Atr Multiplier: A factor used to balance the impact of the ATR on the Trend Bands calculation.

Auto Linear Trend Target x16Experienced traders always tell us that “Never trade against the trend.” or “Trend is our friend.”. Yes sure, no one wants to trade against the trend. However, there are a lot of trends with different types and cycles, then which trend to follow, which trend they are mentioning? This tool (also known as ALTT x16, Laser Net x16) will support us in identifying different linear trends with different cycles. Nearest history-based targets are also added for our convenience of completeness.
Markets: All.
Timeframes: All. Recommendation: 30m and above.
Periods: Up to 16.
Usage: The higher period of a trend, the more strength it has. Enter when price breakouts a trend line and exit at the nearest trend line and target.

RSI Momentum Acceleration by TartigradiaPlots the momentum acceleration oscillators from price and RSI, rescaled and with areas above/below highlighted.
Usage: in a nutshell, when the background is yellow, it's bearish (RSI decelerates faster than price), whereas when the background is green, it's bullish (RSI accelerates faster than price). It appears to detect early some reversals that are otherwise difficult to detect.
Note: it supports using any other indicator's output as the second source input, instead of RSI. PineScript does not allow for more than one source to receive input from other indicators, all the others must only use price as an input.
This indicator uses the core routine to calculate Momentum Acceleration Oscillators by DGT:
This indicator is based on the idea of stinkbug : "RSI is a good momentum indicator showing how excited ppl are on a move, this is why divergences on it work so well. I would like to see the change accelerating or slowing on a move up or down.."

Intraday 5 Day Moving Average for Swing TraderThis indicator helps swing trader to quickly see if a stock or an index is in a short term up- or downtrend.
The 5 Day Moving Average line is shown on all intraday timeframes like 5, 10, 15, 30, 60, 65 and so on.
When an index like SPY or QQQ shows a green 5 DMA line, the index is in a short term uptrend and you can buy stocks for a swing trade,
when the line turns red be careful and stop buying stocks, instead watch out to short stocks.
In addition to the 5 DMA line you can show the percent distance to the 5 DMA and have multiple options to customize the indicator.
Features
■ Use SMA or EMA for the 5 DMA
■ Use different intraday timeframes or show on daily
■ Show the distance in percent
■ Different color modes
■ Multiple customize options

Pierre_crypt0 Medium/Long Term Trend EMAEMA / MA used by pierre_crypt0 to identify the medium / long-term trend
- Green = 100 EMA
- Blue = 200 MA
- Pink = 300 MA
- Black = 200 EMA
These three are used to refer to the short-term trend. The leading indicator he uses alongside horizontal levels to decide on his exposure/positioning.
Everyone keeps asking on Twitter, just compiled them into an indicator.

R2-Adaptive RegressionOVERVIEW
This is an implementation of alexgrover's R2-Adaptive Regression optimized for the latest version of TradingView.
Full details on the indicator are on alexgrover's page here:

Smooth OscillatorThis is a an Oscillator based on RSI .
As you can see, entry signal for long is when the indicator and bar color is green and exit when red.
Entry signal for short is when the bar turns red and exit when green.
You should always trade with the trend, this oscillator helps to know where the trend is going, because as the trend is exhausting the plot waves moves to the oversold or overbought area, which can help to know when a reversal is coming.
This is a test version, use under your own discretion and do the proper backtesting.
Please comment your experience.

Auto Fibonacci Levels + Auto Trend Line generatorAnother indicator for you guys!!!
This indicator consists of the 5 key Fibonacci retracement levels, plotted automatically to user input settings. I also have included an auto support/resistance trend line generator.
What is a Fibonacci retracement?
'Fibonacci retracement is a method of technical analysis for determining support and resistance levels. It is named after the Fibonacci sequence of numbers, whose ratios provide price levels to which markets tend to retrace a portion of a move before a trend continues in the original direction.' - Wikipedia
How to use the Fibonacci retracement?
- The Fibonacci levels are default. These percentiles from price to the average of the high in a sample and low in a sample give you a guideline of where a bottom may be, where a top may be, and where a range is being created.
- Look for the price to reject from 61.8% and 76.4%, and also look for price to bounce from 38.2% and 23.6%. If a lower low/higher high is made, the fib levels will follow and the percentiles within will be recalculated after a 5 candle offset period.
- If you see price trending towards the lower percentiles (38&23) and using the 50% as resistance, look for a break downwards and vice versa.
-This Fibonacci set as all others is subject to fake-out, always use this with another series indicator, or don't use it as a signal for entry at all (unless you have a backdated strategy)
How to use the trend line generator?
-The trend line generator will only plot when a lower low/higher high has taken place within the input amount of candles. It is also offset by a user amount.
-The check box will give the option to have the trend line's plot or not.
- If you see a green/red dot it means that that will be your first coordinate for the trend line, and until the computations are complete it will give you an idea of which direction it will be in (resistance or support)
-When opening this indicator zoom out all the way to connect any trend lines that do not load automatically.
Let me know if you have any questions, suggestions or issues! Thank you everyone!
-Cheatcode1 :)
SP:SPX TVC:DXY BMFBOVESPA:EUR1! CME:BTC1! BINANCE:BTCUSDT

NNFX Exposure UtilityOVERVIEW
This tool allows the user to manually keep track of how much of their account is currently exposed to each currency, and keep that information handy and organized on the chart as a table.
It is specialized for NNFX traders who are trading all the pairs among the 9 major currency crosses: AUD, CAD, CHF, EUR, GBP, JPY, NZD, SGD, USD.
HOW DO I USE THIS INDICATOR?
Before you take a trade, you should open the indicator settings for this indicator and check off which currencies you are about to go long and short on. Here are 3 trades taken as examples:
If you go long on EUR/USD with 2% risk, your exposure is 2% long on EUR and 2% short on USD.
Then if you go short on GBP/SGD with 2% risk, your exposure is 2% short on GBP and 2% long on SGD.
But if you go long on SGD/JPY with 2% risk, your exposure would now be 4% long on SGD and 2% short on JPY. This is against your rules if you are trading the NNFX way. So this tool allows you to see when you are about to accidentally overexpose yourself to any currency pair.

Net New Highs/Lows (With visible code)Basically the same script than Carusolnsights but without hidding the lines of code...
"This indicator displays the net number of stocks on the Nasdaq Composite making 52-week highs or lows. For instance, if there are 60 new 52-week highs and 20 new 52-week lows, the net number will display 40 net new 52 week highs. This indicator is particularty useful in gauging what the breadth is of the Nasdaq.
Three days of net 52-week highs show a healthy market which is conducive to increasing exposure. This condition is highlighted with a green background.
Three days of net 52-week lows show an unhealthy market which is conducive to reducing exposure. This condition is high|lighted with a red background."

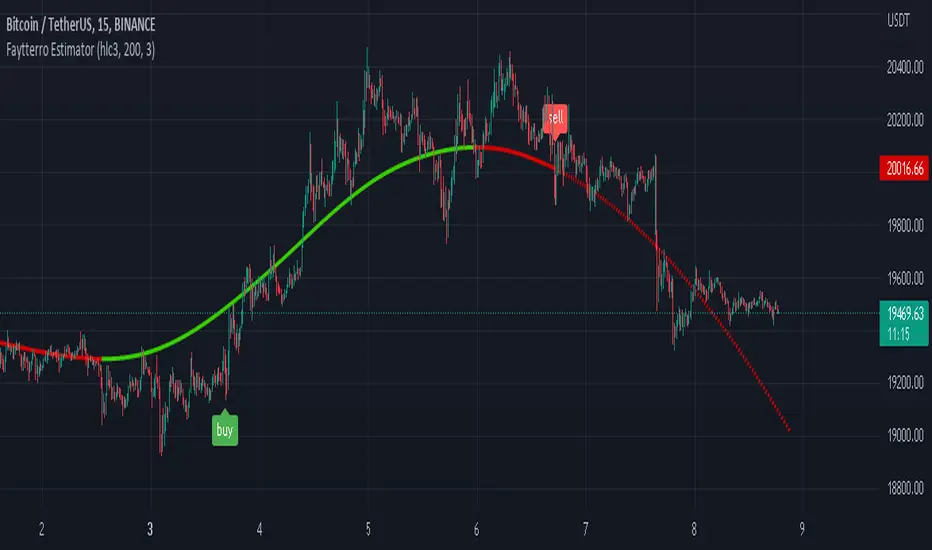
Faytterro EstimatorWhat is Faytterro Estimator?
This indicator is an advanced moving average.
What it does?
This indicator is both a moving average and at the same time, it predicts the future values that the price may take based on the values it has taken before.
How it does it?
takes the weighted average of data of the selected length (reducing the weight from the middle to the ends). then draws a parabola through the last three values, creating a predicted line.
How to use it?
it is simple to use. You can use it both as a regression to review past prices, and to predict the future value of a price. uptrends are in green and downtrends are in red. color change indicates a possible trend change.
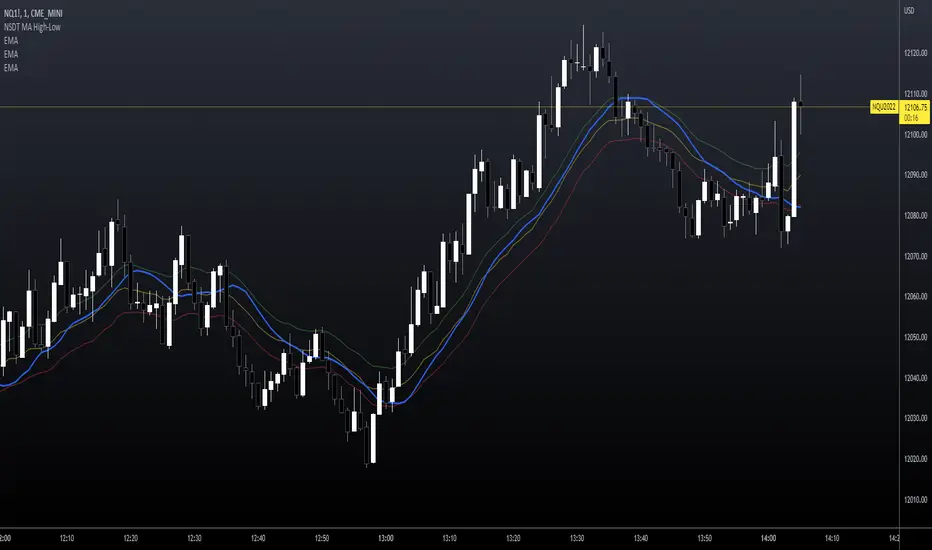
NSDT MA High-LowThis may seem like a pretty basic Moving Average indicator but I haven't seen one that changes the calculation point depending if the market is going up or down.
I've added three EMA's (length of 20) on this sample chart to demonstrate the differences. These are not included with the indicator.
Green, EMA calculated on High
Red, EMA calculated on Low
Yellow, EMA calculated on Close (default)
Blue, EMA calculated on HIGH when rising but on LOW when falling. (looks at 3 candles back to gauge direction)
* * * Note you can choose between 5 different Moving Average types
Notice how the Blue line (when going up it's calculated on the High) is catching up to the Green line (which is already calculated on the High)?
Notice how the Blue line (when going down so it's calculated on the Low) is catching up to the Red line (which is already calculated on the Low)?
This gives a faster response in the direction of the market because it switches between calculating on the High or Low based on market direction.
This script is free and open source.
Pivot Average [Misu]█ This Indicator is based on Pivot Points.
It aggregates closed Pivot Points to determine a " Pivot Average " line.
Pivot Points here refer to highs and lows.
█ Usages:
Pivot Average can be used as resistance or breakout area.
It is also very usefull to find battle zones.
It can also be used as a trend indicator: when the price is below, trend is down, when price is above, trend is up.
Mixed with momentum/volatility indicator it is very powerfull.
█ Parameters:
Deviation: Parameter used to calculate pivots.
Depth: Parameter used to calculate pivots.
Length: History Lenght used to determine Pivot Average.
Smoothing MA Lenght: MA lenght used to smooth Pivot Average.
Close Range %: Define price percentage change required to determine close pivots.
Color: Color of the Pivot Average.

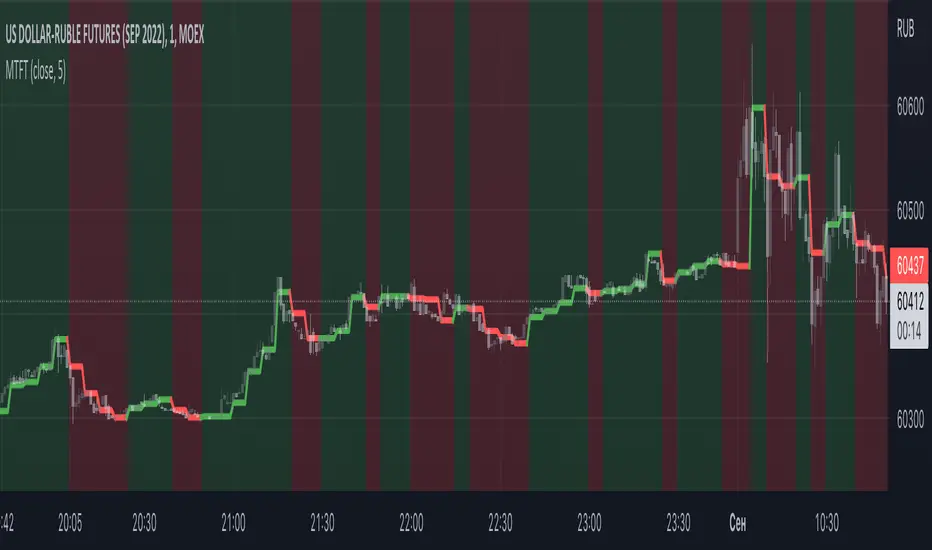
Multi TF Trend Indicator
...Mark Douglas in his book Trading in the Zone wrote
The longer the time frame, the more significant the trend, so a trending market on a daily bar chart is more significant than a trending market on a 30-minute bar chart. Therefore, the trend on the daily bar chart would take precedence over the trend on the 30-minute bar chart and would be considered the major trend. To determine the direction of the major trend, look at what is happening on a daily bar chart. If the trend is up on the daily, you are only going to look for a sell-off or retracement down to what your edge defines as support on the 30-minute chart. That's where you will become a buyer. On the other hand, if the trend is down on the daily, you are only going to look for a rally up to what your edge defines as a resistance level to be a seller on the 30-minute chart. Your objective is to determine, in a downtrending market, how far it can rally on an intraday basis and still not violate the symmetry of the longer trend. In an up-trending market, your objective is to determine how far it can sell off on an intraday basis without violating the symmetry of the longer trend. There's usually very little risk associated with these intraday support and resistance points, because you don't have to let the market go very far beyond them to tell you the trade isn't working.
The purpose of this indicator to show both the major and minor trend on the same chart with no need to switch between timeframes
Script includes
timeframe to determine the major trend
price curve, close price is default, but you can pick MA you want
type of coloring, either curve color or the background color
Implementation details
major trend is determined by the slope of the price curve
Further improvements
a variation of techniques for determining the major trend (crossing MA, pivot points etc.)
major trend change alerts
Thanks @loxx for pullData helper function
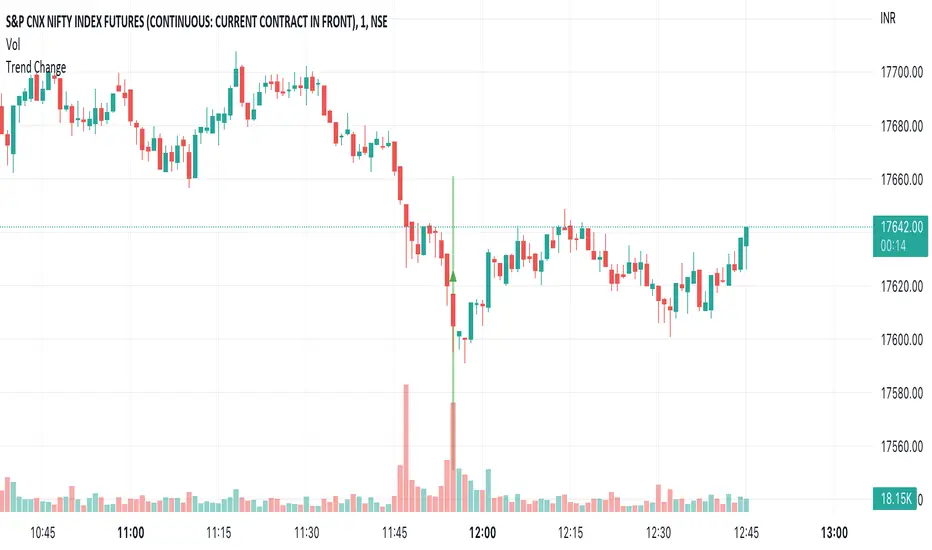
Trend ChangeThis indicator displays a general trend change. It shows an arrow on the candle from where the trend change is expected.
The trend change is calculated based on the previous candle open/close and the corresponding volume.
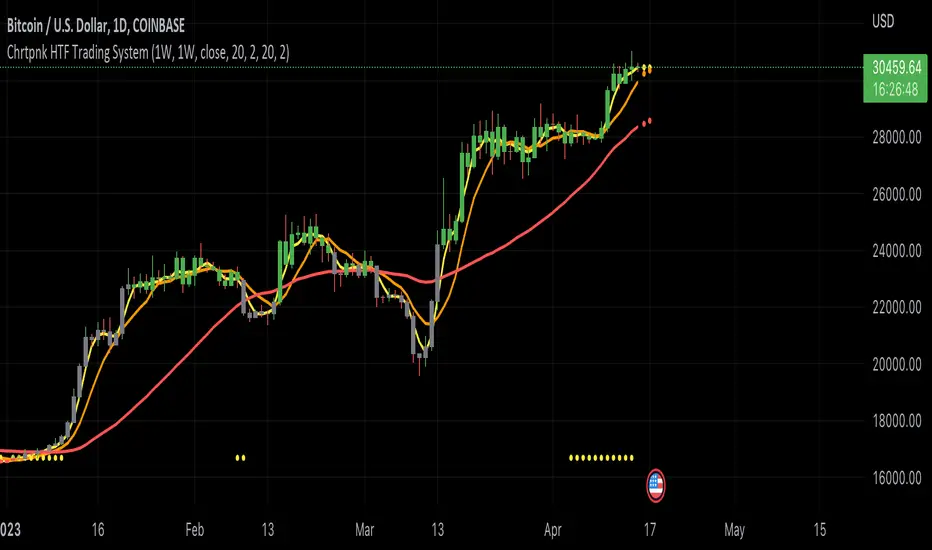
Chartpunk Trading SystemINTRODUCTION
I am happy to present the system which I am using in my daily free market updates.
The system is based on my own trading strategy whereby I am focusing on trend and momentum. I have developed this indicator for my own using, the main purpose was to provide me with a simplified outlook on all parameters that I am following, and make it easier to follow multiple assets.
I am amazed to see my audience growing, and since I have received multiple requests for access to this system, I have decided to publish the indicator on TradingView. I hope it will be useful for many of you in understanding core trend and momentum easier and faster.
TREND STRUCTURE
The moving average based system developed by the late Tyler Jenks has made a big impression to me years ago, and I have started to build my position trading system around his concept. The core idea is that when analyzing trend, the price "is just noise". Tyler declared that instead of the actual price, you should focus on price trends, based on three moving averages, their alignment and crosses. Focusing on the trend structure provides you with a cleaner understanding of the market then being fixated on the actual price. Tyler has used a very short moving average (3) instead of the price, and two longer averages (7 and 30) to identify trend direction. The alignment of these three moving averages provide you with guidance on whether to be short or long, and on the extent of being short or long. Further to the alignment of these moving averages, their direction (ascending or descending) is a further aspect to consider. Try taking off the price from your chart, you will see how these three moving averages provide you with a clean trend structure.
This indicator is plotting the 3,7,30 moving averages accordingly, but you are free to alter the settings according to your own needs.
MOMENTUM (Multi Timeframe!)
Further to the general trend structure, I am using market momentum to confirm my entries and exits. The most important market indicators to me in this respect are the RSI, DMI and Momentum Oscillator values. A bullish confluence of these momentum indicators are a confirmation for me on a long entry, and a bearish confluence may confirm a short entry.
This aspect is where I believe my indicator is a huge help. Instead of having to check for confluence separately, the indicator is simply signaling confluence by painting the bars, thus providing an easy and quick reading of current momentum.
Even further, the indicator is able to analyize the underlying indicators on three timeframes simultaneously, and paint the candles only in case of total confluence. This has been a huge help in my trading, as it provides me with an immediate MTF momentum reading upon opening a chart.
MY PREFERRED USE OF THIS INDICATOR
I am mainly trading Bitcoin, and the core settings of the indicator are preset according to my experience on this market. You may however easily alter the settings according to your own needs and approach.
I am opening and closing positions on the 1-day timeframe, and the candles are showing to me momentum confluence on the 1-day, 3-day and 1-week timeframes. Hence, if on all three timeframes there is a bullish confluence of all momentum oscillators (RSI, Mom, DMI), the candles are green. So easy, as I do not have to browse through timeframes and oscillators individually. The bearish confluence is accordingly signaled by red candles. Grey candles are neutral, showing the lack of confluence.
Whenever I see a momentum confluence change (neutral to bull, neutral to bear etc.), I analyze the trend structure of the moving averages. If the moving average structure is confirming the position, I am opening.
SUMMARY
This indicator is providing a very clean and quick-to-read outlook of an otherwise rather time and focus intensive study. Instead of checking for confluence of three momentum indicators on three timeframes, you immediately see confluence with the candle paint. The moving average structure is promptly there to confirm the read. This is where the real power of this indicator is lying, and I assume this is why the more and more of you have started to daily follow my daily market updates.
Futures Full FS ScreenerFull FS Screener
This indicator allows traders to have a view of multiple pairs and timeframes buy/sell signals and specific information of parameters, based on the Futures FS Indicator also developed by me.
Futures FS Indicator Fundamentals
1. Exponential Moving Average (EMAs): The base indicator is composed of moving averages of 5, 10, 11, 13, 36 and 55 exponential periods.
2. Squeeze Momentum: This indicator allows the signals to go with the trend and not against it.
3. VPVR (Volume Profile Visible Range): It allows to determine the Point of Control (POC) which is the node with the highest volume profile. This can be used as an important retest point or to calculate potential support and resistance.
4. ADX (Average Directional Index): The ADX helps the indicator to estimate the strength of the movement, always considering the DI+ and DI- to not go against the trend.
5. RSI (Relative Strength Index): The RSI helps measuring the speed and magnitude of the recent price changes to evaluate overvalued or undervalued conditions in the price of that security. The indicator considers RSI 5, 13 and 50 as bottom and top, respectively.
6. MACD (Moving average convergence divergence): The MACD is a trend-following momentum indicator that shows the relationship between moving averages. The indicator uses moving averages of 5, 8 and 21).
7. The trend is determined according to these parameters and their different values, which might indicate that we are in a bullish or bearish trend. The trend has a max positive (bullish) value of 6 and a max negative (bearish) value of -6.
Full Screener Panel
This panel allows the trader to monitor multiple pairs at a single screen, giving an immediate vision of possible entries and exits (Long/Short/Strong Long/Strong Short Signals). Moreover, allows traders to have handy all information of the Future FS Indicator that might be analyzed further for each pair. It has the following characteristics:
• It can be placed anywhere on the screen through the main menu of the indicator.
• It can be combined with the same indicator multiple times, as per screener is limited to show 40 pairs, you can select the number of panels being added to adjust position one next to each other.
• It strengthens colors when a pair has changed its signals in order to the trader to know immediate changes and then do the follow up
• The screener shows the pairs, which can be changed within the menus.
• The screener shows the Long, Short, Strong Long and Strong Short Signals in its las column but previously, it shows the parameters that determined the possible position. Therefore, the EMAs, SQZ, ADX, VPVR, RSI and MACD calculated internally, are also summarized in the screener.
For analyzing a specific pair, refer to the TwV Futures Indicator – FS, which is other indicator that might be on my TradingView Profile and that was used as base for the screener.

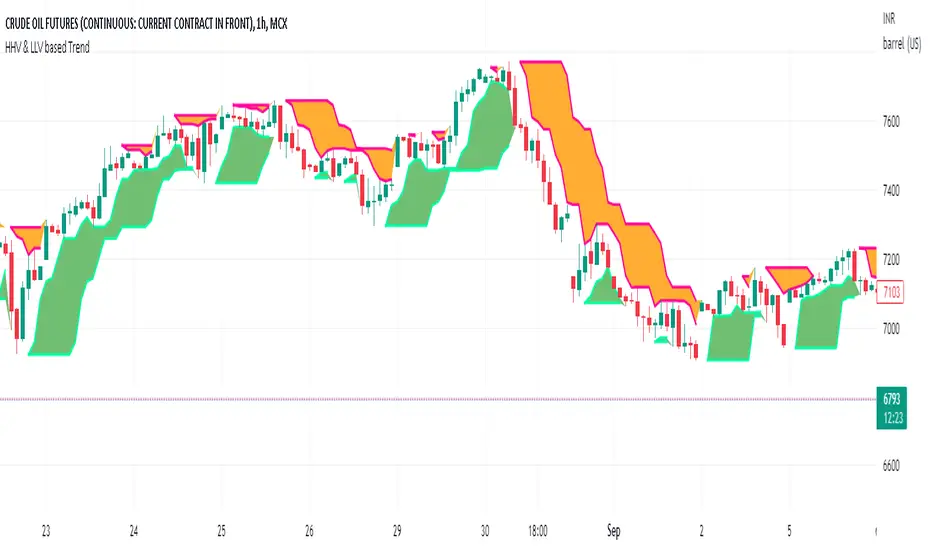
HHV & LLV based TrendHHV and LLV gives good information about the trend.
A trend will be visible when its seen with fast and slow line cross
UP trend: HHV_fastline = HHV Slowline and LLVfastline crossover LLVSlowline
DOWN trend: HHV_fastline crossunder HHV Slowline and LLVfastline !=LLVSlowline
Attempted to plot the same with multiple options to choose fastline length, slowline length, Multi time frame.
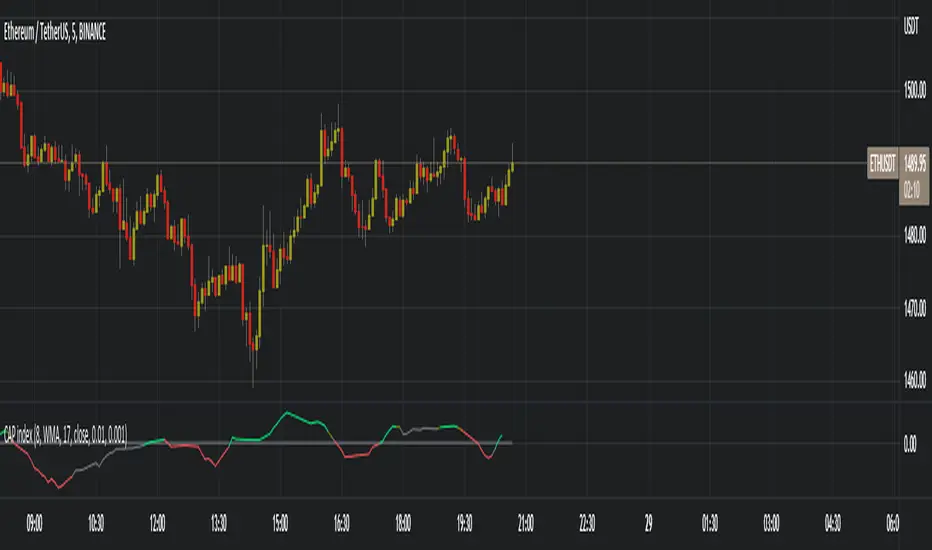
Constantly Applied Pressure Index (CAP index)BINANCE:ETHUSDT
The CAP index is my own homebrew trend indicator made to help traders see the slightly bigger picture, because we all know that as traders we can tend to hyper-focus in on a few candles and end up making a stupid trade because of it, or is it just me ? On a more serious note this indicator helps you find the short term trend by looking at bullish and bearish candles comparing their sizes, volumes and predominance.
The indicator has many technical settings for you to play around with but on the defaults it will render in a few colors which I will explain. Gray means no trend or that the current trend has died, bright green or red mean that a trend has formed, is playing out or that there is a good change a strong trend is about to form. Obviously green means bullish and red means bearish. Finally darker green and red mean a weak or weakening trend, this serves as a warning if you are about to take a trade in the trend direction.
The way I recommend using the indicator is the same way many trend indicators are used, as a filter to either a different indicator creating trading signals or to your own strategy's signals. I would add an illustration here that I prepared but I cannot because of tradingview's reputation rules
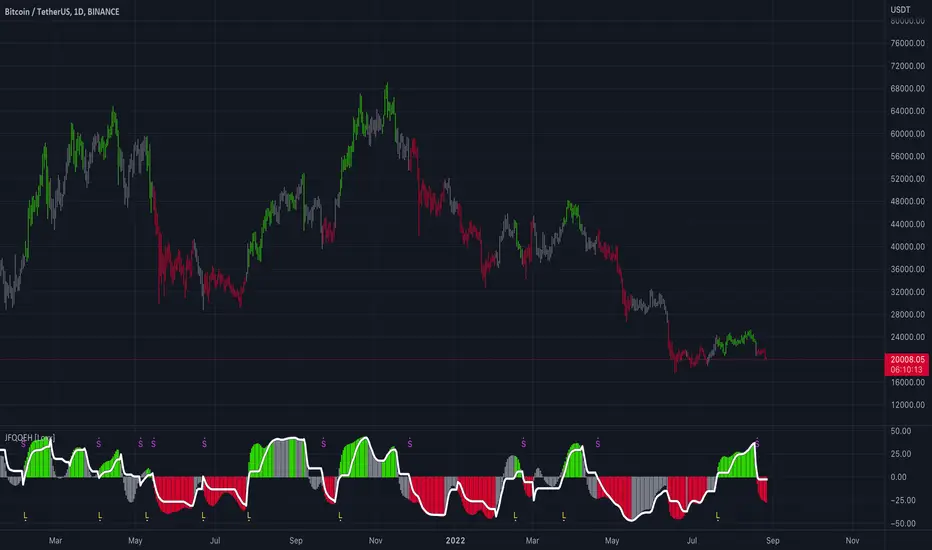
Juirk-Filtered QQE Histogram [Loxx]Juirk-Filtered QQE Histogram is a QQE indicator with 7 different RSI types, Jurik-Filtering with the option of double filtering. 2 types of signals, and Loxx's Expanded Source types. These additions are useful to filter out noise.
What is Qualitative Quantitative Estimation (QQE)?
The Qualitative Quantitative Estimation (QQE) indicator works like a smoother version of the popular Relative Strength Index ( RSI ) indicator. QQE expands on RSI by adding two volatility based trailing stop lines. These trailing stop lines are composed of a fast and a slow moving Average True Range (ATR).
There are many indicators for many purposes. Some of them are complex and some are comparatively easy to handle. The QQE indicator is a really useful analytical tool and one of the most accurate indicators. It offers numerous strategies for using the buy and sell signals. Essentially, it can help detect trend reversal and enter the trade at the most optimal positions.
What is Jurik Volty used in the Juirk Filter?
One of the lesser known qualities of Juirk smoothing is that the Jurik smoothing process is adaptive. "Jurik Volty" (a sort of market volatility ) is what makes Jurik smoothing adaptive. The Jurik Volty calculation can be used as both a standalone indicator and to smooth other indicators that you wish to make adaptive.
What is the Jurik Moving Average?
Have you noticed how moving averages add some lag (delay) to your signals? ... especially when price gaps up or down in a big move, and you are waiting for your moving average to catch up? Wait no more! JMA eliminates this problem forever and gives you the best of both worlds: low lag and smooth lines.
Ideally, you would like a filtered signal to be both smooth and lag-free. Lag causes delays in your trades, and increasing lag in your indicators typically result in lower profits. In other words, late comers get what's left on the table after the feast has already begun.
Included:
Loxx's Expanded Source Types
Alerts
Signals
Bar coloring
Included Libraries
Loxx's Variety RSI
Loxx's Jurik Tools
Loxx's Expanded Source Types
Related indicators:
Natural Market Mirror (NMM) and NMAs w/ Dynamic Zones
RSI/RSX QQE Histogram w/ Discontinued Signal Line
Jurik CFB Adaptive QQE
Adaptive Qualitative Quantitative Estimation (QQE)
Blockchain Fundamentals: 200 Week MA Heatmap [CR]Blockchain Fundamentals: 200 Week MA Heatmap
This is released as a thank you to all my followers who pushed me over the 600 follower mark on twitter. Thanks to all you Kingz and Queenz out there who made it happen. <3
Indicator Overview
In each of its major market cycles, Bitcoin's price historically bottoms out around the 200 week moving average.
This indicator uses a color heatmap based on the % increases of that 200 week moving average. Depending on the rolling cumulative 4 week percent delta of the 200 week moving average, a color is assigned to the price chart. This method clearly highlights the market cycles of bitcoin and can be extremely helpful to use in your forecasts.
How It Can Be Used
The long term Bitcoin investor can monitor the monthly color changes. Historically, when we see orange and red dots assigned to the price chart, this has been a good time to sell Bitcoin as the market overheats. Periods where the price dots are purple and close to the 200 week MA have historically been good times to buy.
Bitcoin Price Prediction Using This Tool
If you are looking to predict the price of Bitcoin or forecast where it may go in the future, the 200WMA heatmap can be a useful tool as it shows on a historical basis whether the current price is overextending (red dots) and may need to cool down. It can also show when Bitcoin price may be good value on a historical basis. This can be when the dots on the chart are purple or blue.
Over more than ten years, $BTC has spent very little time below the 200 week moving average which is also worth noting when thinking about price predictions for Bitcoin or a Bitcoin price forecast.
Notes
1.) If you do not want to view the legend do the following: Indicator options > Style tab > Uncheck "Tables"
2.) I use my custom function to get around the limited historical data for bitcoin. You can check out the explanation of it here:

Autocorrelative Power Oscillator (APO) [SpiritualHealer117]This indicator is very strong in identifying short-term trends, and was made for trading stocks and commodities. When it is green, it indicates an uptrend, and red indicates a downtrend. The transparency of the columns illustrates the strength of the trend, with transparent columns indicating weakness, while solid columns indicate strength.
Basic Explanation of the Indicator
This indicator calculates an asset's Pearson's R coefficient when compared with several different lags of the stock's price. After that, the oscillator checks whether the indicator is in the green or red compared to those correlations, and takes the sum of the correlative periods to predict which direction the market should go based on the relationship of the current price with its past correlations.
