Vervoort SmoothingThis script has both the Triple Exponential Moving Average (TEMA) and zero lag sma written as functions. Both from Capturing Profit with Technical Analysis (24-25) by Sylvain Vervoort.
Best regards,
capam
Média Móvel Exponencial Tripla (TEMA)

TEMA, DEMA and SMA with crosses with alert functionality
Just a crude but functioning ma indicator with bullish and bearish crosses and alert functionality.

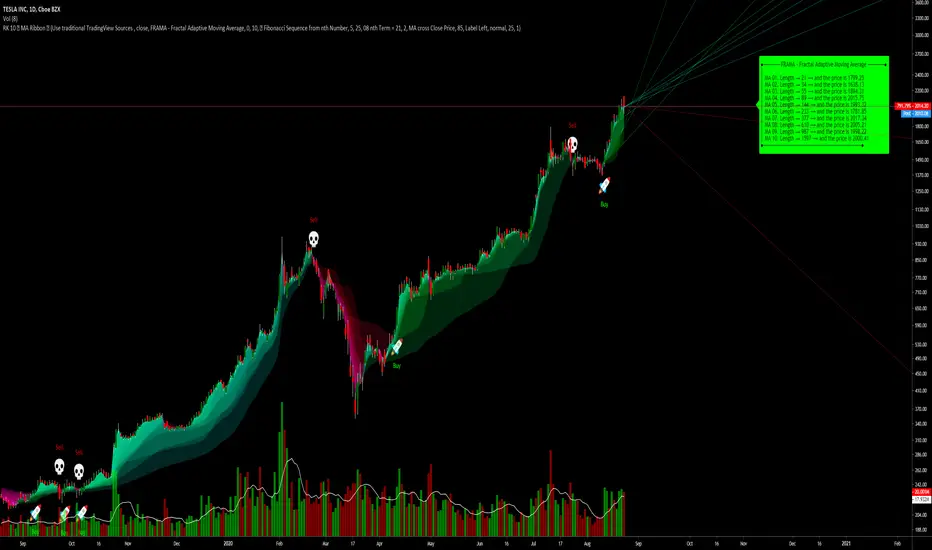
RK's 10 ∴ MA Types Ribbons (Fibonacci, Guppy and others)After some tips in my indicator
RK's 04 - Lots of MA Types Ribbon I Put some time and effort to make it better.
So, I'm sharing with you the results.
This is an up to 10 lines Moving Average Ribbon with an Auto Evaluate Length and a lots of options!!!
Type of Moving Average you can use:
SMA - Simple Moving Average
SMMA - Smoothed Moving Average
EMA - Exponential Moving Average
DEMA - Double Exponential Moving Average
TEMA - Triple Exponential Moving Average
WMA - Weighted Moving Average
HMA - Hull Moving Average
EHMA - Exponential Hull Moving Average
RMA - RSI Moving average
2PSS - Ehlers 2 Pole Super Smoother
3PSS - Ehlers 3 Pole Super Smoother
VWMA - Volume-Weighted Moving Average
ALMA - Arnaud Legoux Moving Average
STMA - Simple Triangular Moving Average
ETMA - Exponential Triangular Moving Average
LSMA - Least Squares Moving Average
ZSMA - Zero-Lag Simple Moving Average
ZEMA - Zero-Lag Exponential Moving Average
COVWMA - Coefficient of Variation Weighted Moving Average
COVWEMA - Coefficient of Variation Weighted Exponential Moving Average
FRAMA - Fractal Adaptive Moving Average
KAMA - Kaufman's Adaptive Moving Average
VIDYA - Variable Index Dynamic Average
If you want to change faster the MA type, in "Moving Average Setup:", Select "🤖 Use numbers to change MA Type", click inside the box in "🤖 Moving Average Type per Number:" and just scroll your mouse wheel. You can check what MA type you are using looking in the info panel label.
There is 4 automatic evaluate length:
Fibonacci Sequence
Arithmetic Progression
Geometric Progression
Guppy Multiple Moving Average (GMMA) without Lengths 03 and 05
And I already put a Manual Length, but I keep it inside the code, so if you want to use different lengths, just change the code, or ask me and I will put as an input.
And attending a request, this indicator can creates alerts when all the colors of the ribbons changes.
Hope you like it!
Any other good idea, just send me.
3MAs & BB, Time-Res, Low-VolTriple MAs with EMA/SMA option, and specific timeframe options.
Very customizable.
Bollinger Bands
If BollingerBand Width is lowest in 100 bars it fills background.

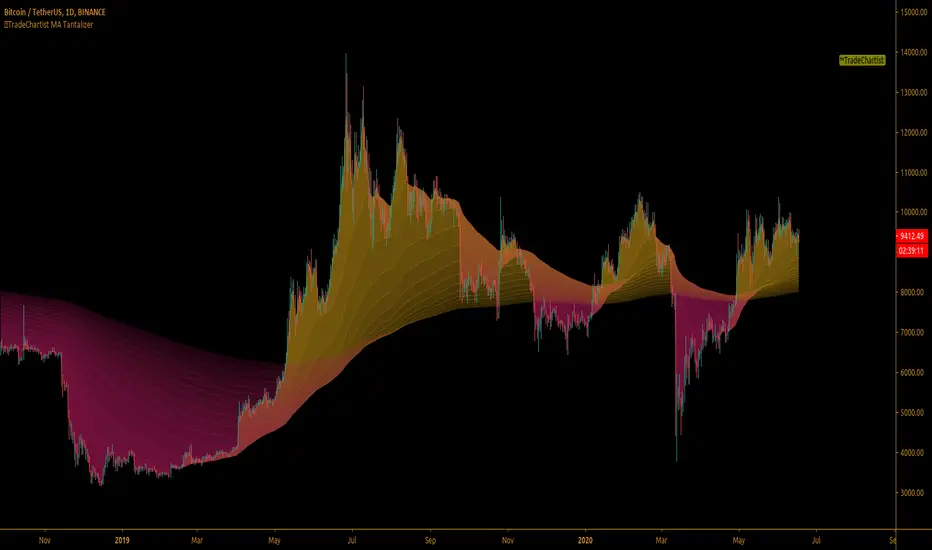
TradeChartist MA Tantalizer ™TradeChartist MA Tantalizer is a free to use, elegantly designed script for MA based traders and it offers a range of useful Moving Averages based plots including MA fishnet/Tantalizer ribbon and custom multi time frame MAs with crosses based on user input. The script's visually appealing design and its functionality offers a pleasing experience for the users, thereby complementing their analysis and helps understand asset's price action better.
What does ™TradeChartist MA Tantalizer do?
1. MA Tantalizer plots Moving Averages Tantalizer (Fishnet or Tantalized) in user preferred color scheme based on selection from a dropdown of 10 MAs ( SMA , EMA , Zero-Lag EMA , SMMA , WMA , DEMA , TEMA , VIDYA ( Variable Index DYnamic Average ), T3 MA (developed by Tim Tillson featured in his article "Better Moving Averages" in 1998), Modified T3 MA ). If length input is 10, Tantalizer plots 15 MA plots ranging from 10 MA to 150 MA. The Tantalized MAs help the traders to visually spot price trends and along with MTF (Multi Time Frame) MA plots with detection of crosses within the script, help traders make an informed trade decision. 15 MA plots can be individually plotted or hidden from the indicator settings.
2. Plots two MAs based on user input length and timeframe which helps detect MA crosses as shown below.
3. Generates Signal for MA crosses that can be plugged as Signal Connector and used with Plug and Trade scripts as below.
The sheer number of interesting things that can be done with this script from plotting visually engaging MA Tantalizer and detecting MA crosses not just on chart Timeframe, but also crosses between MAs of different timeframes, makes this script quite versatile and a real Tantalizer.
ALMA Function [FN] - Arnaud Legoux Moving AverageThis hasn't been done before. People know the ALMA moving average, TradingView, of course, has a built-in function for the ALMA = alma(). But, when you use built-in functions, you can't have a series as a length. Pinecoders put out a bunch of functions for various routines wherein the built-in doesn't allow for a series as a length. I got some help from @everget (awesome dude) to do the dev() function as well... can't find the ALMA anywhere. So, here it is. It seems to match the built-in indicator. To double-check me, just put the ALMA built-in over this and they should match. Let me know if you find an issue.
That's it. ALMA is cool. I'm going to use it as the average for the CCI. Good day.

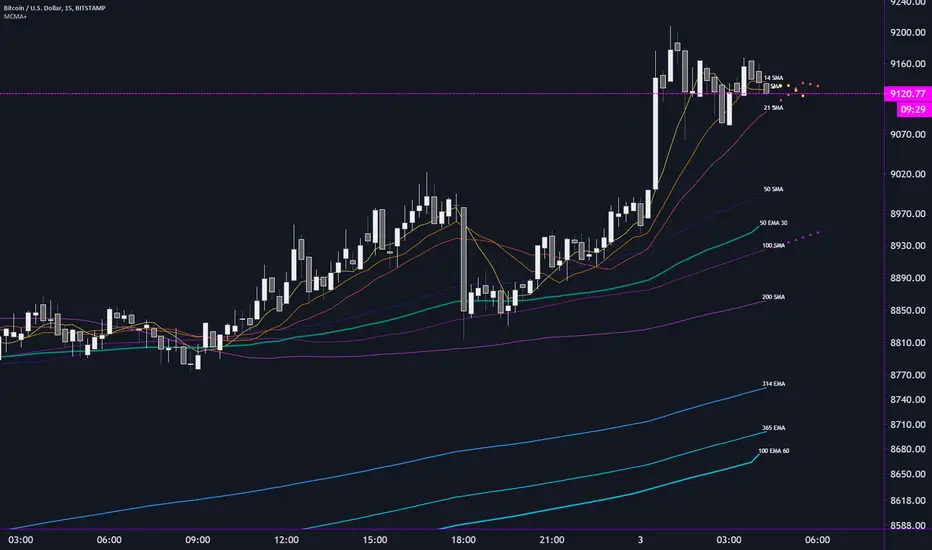
MCMA+ Multi Custom Moving Averages by Flinty + CryptorhythmsLatest release of my Multi Custom Moving Average indicator.
Plot up to 10 moving averages
for each MA, you can customise the following:
Period - from 1 to 1825 days
Type - DEMA, EMA, SMA, TEMA, VMWA or WMA
Source - Open, High, Low, Close, HL2, HLC3,OHLC4
The lowest and highest TF chart each MA will plot on. Only show the MA's you want on any time frame without having to continually adjust settings
Higher Time Frame MA -
Plot up to 3 additional moving averages from higher time frames
Customise each of these with Period, Type, Source, low and high TF plots and finally Time Frame
Time Frame can be a fixed TF or it can be set to always show the interval or period above the currently active TF
Labels can be customised to show the MA number or useful information such as the period, the MA type and the Time Frame where applicable
Another exciting feature is the ability to plot 7 bars ahead by enabling our prediction routine
This can be enabled for any three MA's
Hopefully I will be able to implement crossover alerts in the near future
Bollinger Bands Plus [xdecow]Bollinger bands with the option to use different types of moving averages.
-SMA
-EMA
-RMA
-WMA
-VWMA
-SWMA
-DEMA
-HMA
-SMMA
-T3
-TEMA

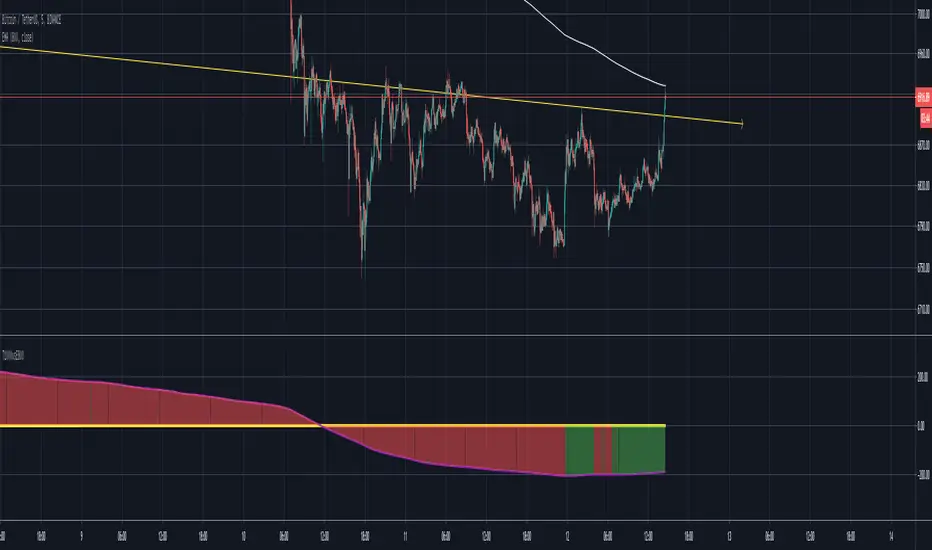
Mioone´s TEMA100vsEMA800(Feat. ACEACEACE)Mioone´s TEMA100vsEMA800(Feat. ACEACEACE)
Inspired by CryptoAman better know as ACEACEACE
TEMA1000 vs EMA800
What does it do?
Shows the TEMA1000 in relation to EMA800.
Shows the Coin in relation to EMA800
If you look at the value of the coins, you will notice that the coin magically moves closer to the EMA800.
That's why I created the indicator with the relation of the Coin to the EMA800 as a addon, so you can see how many bucks the Coin can go up or down when it is looking for the proximity to the EMA800.
Basically:
If the TEMA1000 goes below EMA800 the signal is rather bearish.
If the TEMA1000 breaks up through the EMA800 on larger time frames, this can often produce a DIP or start a run up.
Yelloline = Null Line
Greenline = Coinvalue smoothed with EMA1 in relation to EMA800 (Means if EMA800 = 10.000$ and CoinValue = 10.200$ the Greenline shows the Difference +200 $ over EMA800
Purpleline = TEMA1000 in Relation to EMA800 (TEMA1000 over EMA800 = Bullish , Under EMA800 = Bearish)
Colorfilling
Filling Green if Coinvalue (EMA9) > EMA800 = Bullish
Filling Red if Coinvalue (ema9) < EMA800 = Bearish)
Purple Crossover Yello = Bullcross
Purple Crossunder Yello = Bearcross
Take care of your Trades....
Mioone
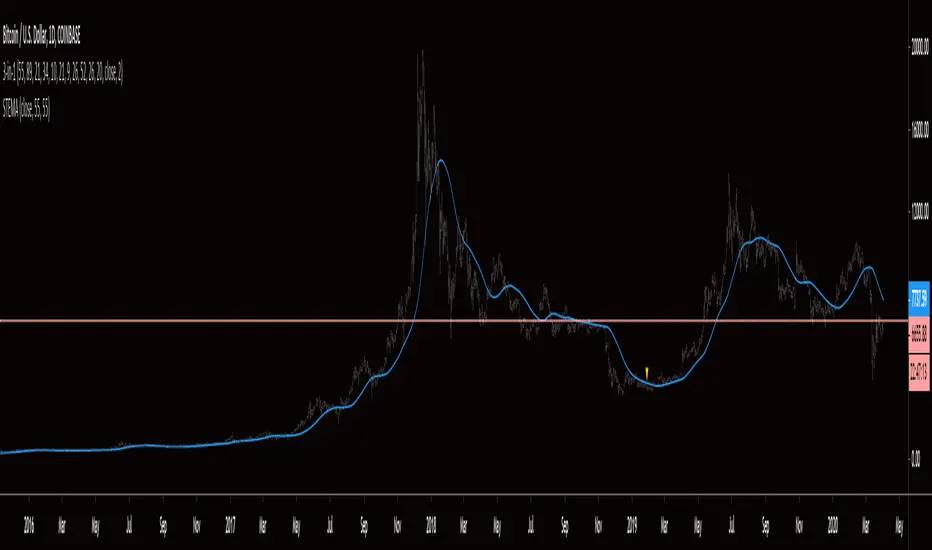
Smoothed Triple EMAThis indicator is exactly as it sounds, a smoothed triple EMA . In my personal use, it is applied to strategies to indicate direction of entries. A simple example would be if price is above the STEMA, look for long entries, if price is below the STEMA, look for short entries. Shortly, I will share a strategy that makes use of this indicator. You are welcome to message me if you have any questions. Thanks for checking it out an may the probabilities be with you!
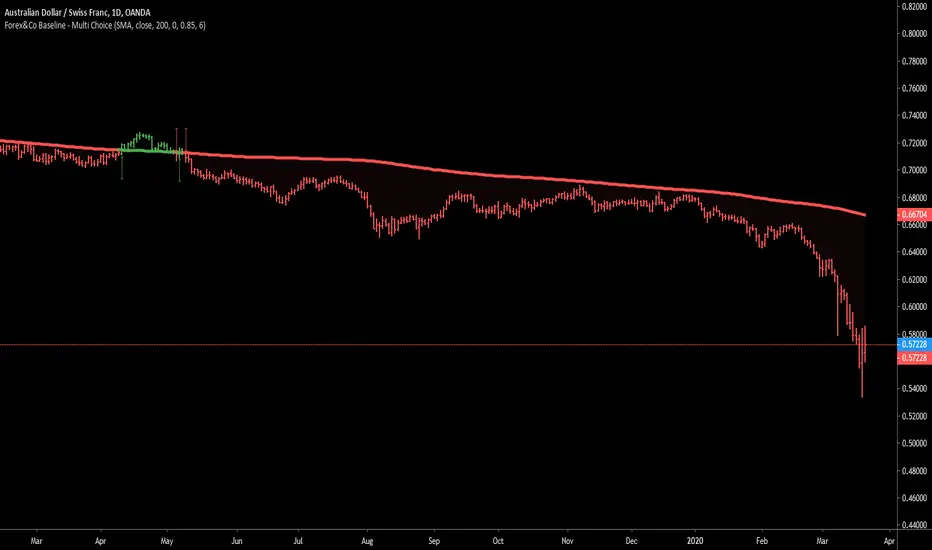
Forex&Co Baseline - Multi ChoiceBest baseline indicator with multiple choice and bar colour. Easy to use and very effective.
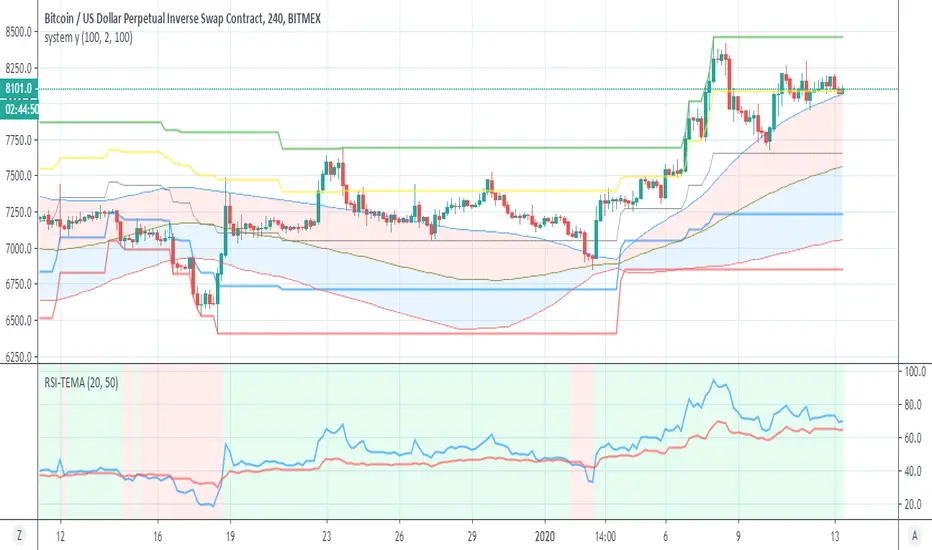
RSI-TEMAJust converted TEMA to RSI type
fast above slow=bullish in lime
slow above fast=bearish in red
fast=blue line
slow=red line
so not so much to write about it but it good as another weapon in arsenal :)
FibMAThis study visually demonstrates Fibonacci moving averages.
The darker the color, the stronger the signal is for either buying or selling.
Buys/Sells only take place when each moving average is above/below the its adjactent fibonacci sequence, i.e 5<8<13<21<34<55<89<144 for buying..
Alerts are provided as BUY ASSET and SELL ASSET.
Multiple moving averages are also provided.

MasterMAThis study demonstrates 15 different common moving averages.
SMA, Double SMA, Triple SMA
EMA, Double EMA, Triple EMA
WMA, Double WMA, Triple WMA
VWMA, Double VWMA, Triple VWMA
Hull, Double Hull, Triple Hull
Buy/Sell alerts are given for crossover/under conditions.
Triangles at the bottom, pointing up are buy signals. Triangles at the top, pointing down, are sell signals

Vol%MAThis study finds buying/selling opportunities on the basis of candlestick and volume percentage changes, prequalified by momentum.
Candlestick percentage changes that are equal to or greater the desired percentage with the momentum range are marked by blue diamonds.
Volume percentage changes that are equal to or greater the desired percentage with the momentum range are marked by red circles.
When candlestick and volume percentage changes aligned with user configurations are under momentum, a buy signal is triggered with BUY ASSET and a black triangle is placed at the bottom of the chart.
When candlestick and volume percentage changes aligned with user configurations are above momentum, a sell signal is triggered with SELL ASSET and a black triangle is placed at the top of the chart.

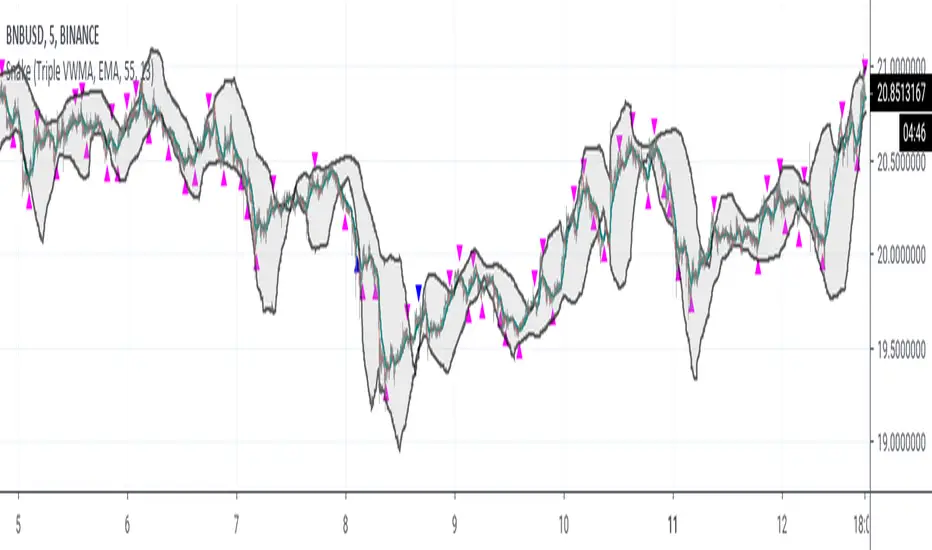
SnakeWhile moving averages are a good way to visualize price action, they are, in general, very poor indicators to trade against. Usually, the lowest prices occur before the cross over of multiple moving averages, while the best profits occur just before the crossunders of the moving averages.
This study captures the buy signals before the cross overs and sells just prior to the cross unders, when prices are lowest and highest respectively.
This is accomplished by treating the moving average as a "snake", specifically looking for the "head" of the snake to turn upwards when buying is most opportunistic. Note the the body must still be trending downward.
For selling, the "snake's head" must be turning down while the body is trending up.
This script uses blue arrows, pointing up, at the bottom, to indicate a buy signal, sending an alert of BUY ASSET.
Blue arrows, point down, at the top, represent sell signals with an alert of SELL ASSET.
The gray bar or strip is momentum. The snake's head must be above momentum for a sell, and below for a buy. This study does NOT work well with stable coins.
The longer the momentum, the more likely weak signals will be weeded out, but also presents less opportunities for buys.
The longer the length of the snake, the more likely cascading down turns will be ignored, but requires a longer trend to identify buy signals.
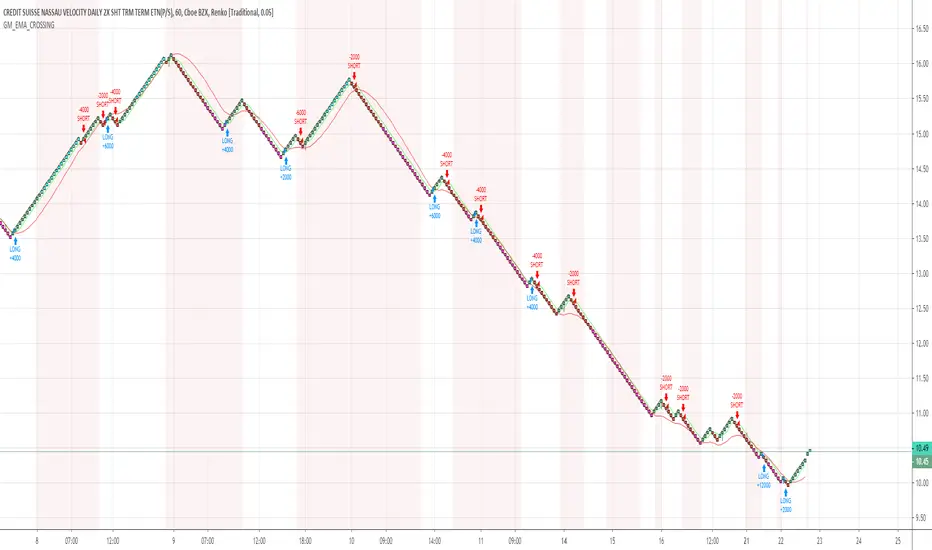
GM_EMA_CROSSINGThis is a simple Renko Strategy. The settings used were for Traditional (1.2) bars, tested on $SPX500USD. Around 70% profitable depending on timeframe, and bar size selected. Adjust the capital and suggested contract system depending on needs. The colored bars seen show blue for overbought conditions and pink for oversold conditions. If you like this strategy, please like and +rep!
Trend-Corrected EMAEMA is a lagging indicator, but we can do better by correcting it with its first and second derivative, which may be more theoretically sound than how DEMA and TEMA are trying to achieve the same.

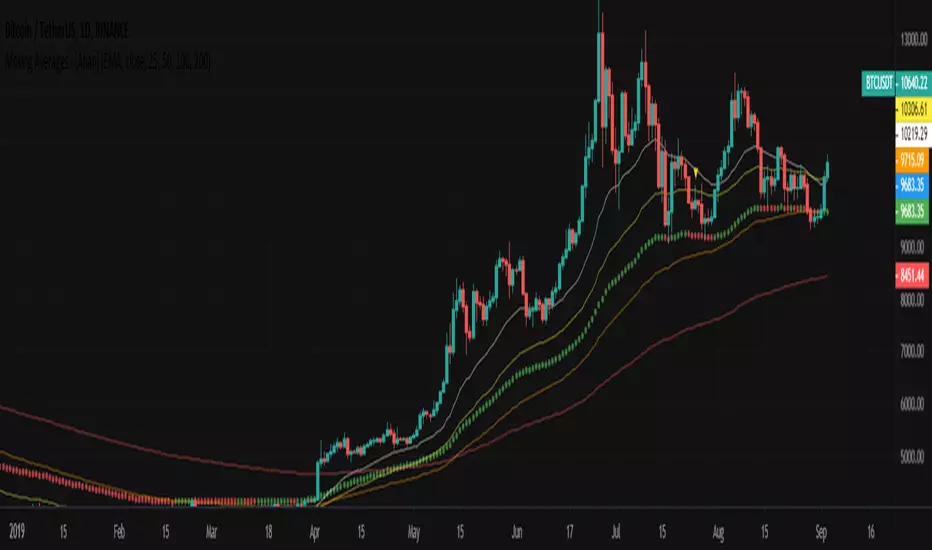
Moving Averages - [Anan]Hello Friends,,
This is my own Moving Averages indicator :
- V4 Pinescript
- 4 Plots Moving Average on the same chart
- 12 Moving Average types !
- Types:
- Lenght: optional
- Source: optional
- Combined Moving averages ! (try it with EMA and thank me later ;D)
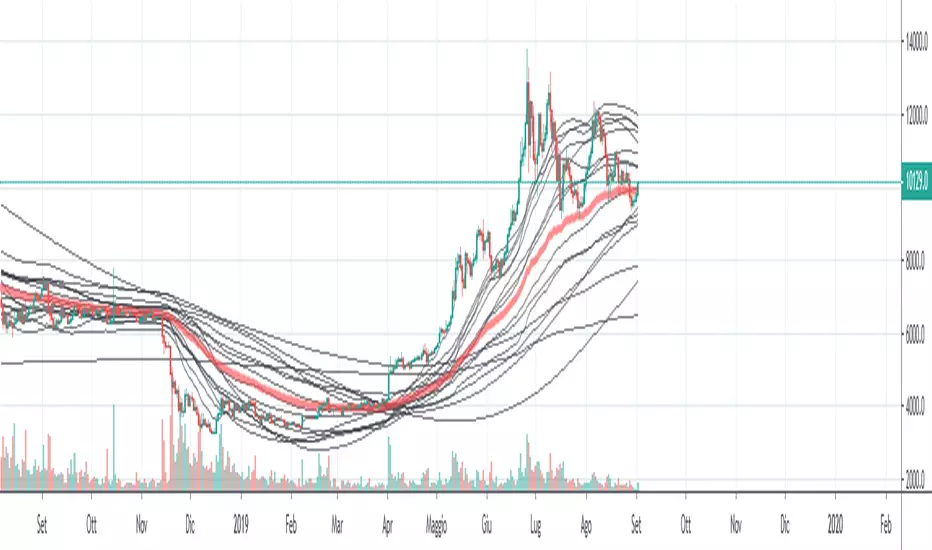
Comparing different types of moving averagesA Study of Moving Average Types
// SMA Simple
// WMA Weighted
// VWMA Volume Weighted
// EMA Exponential
// DEMA Double EMA
// ALMA Arnaud Legoux
// HMA Hull MA
// SMMA Smoothed
// LSMA Least Squares
// KAMA Kaufman Adaptive
// TEMA Triple EMA
// ZLEMA Zero Lag
// FRAMA Fractal Adaptive
// VIDYA Variable Index Dynamic Average
// JMA Jurik Moving Average
// T3 Tillson
// TRIMA Triangular


Triple Moving Average ExponentialHere is a very simple script for Triple EMA that adds 3 EMA's of your choice to the chart consuming the space for only one indicator.
This is especially helpful to free users with a limit of 3 indicators per chart.
