Larsson AcademyThe L.A. Indicator supports:
- Trend trading (not range trading) of
- Tech assets, such as tech stocks and bitcoin/cryptocurrencies (not commodities) over
- Long timeframes, e.g. daily, weekly and monthly candles (not hourly candles or less).
By distilling all data down to one of 3 states, up, down or inconclusive, the indicator can aid in the decision making over long time periods, together with a rule based trading process. It works by measuring trend consistency.
Technical

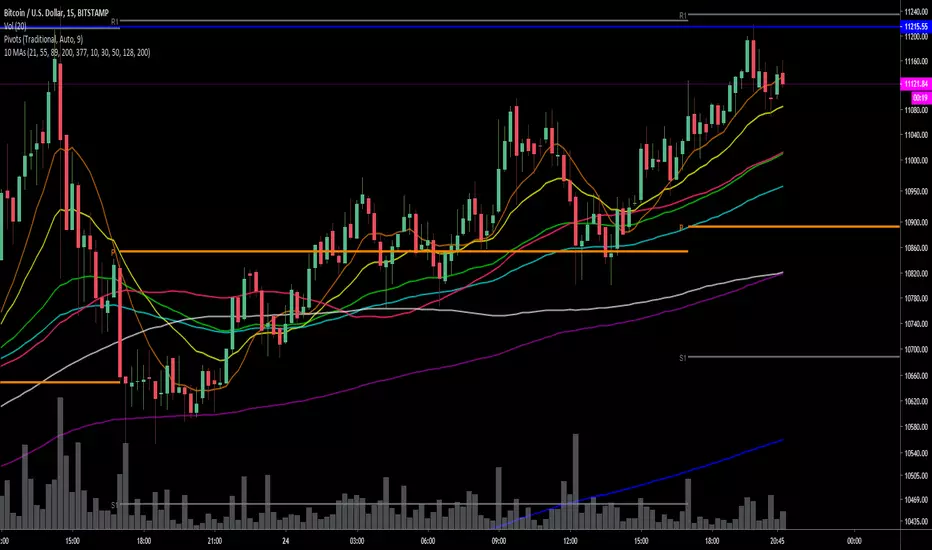
Krowns 10 PACK Combo (5 EMAs, 5 SMAs) - v2Version 2 - Krowns Crypto 10 pack moving average set - written by "Kick Back Time" also known as Mr.Scrogers Neighborhood
...after receiving a lot of likes from the first version I thought I would go ahead and put out the updated version that I've been using
There's a few things I've changed to make it easier to adapt to.
This set is very similar to what Krown uses - I rarely look at the 100 SMA, but I do like the 128 SMA, so I made it default over the 100...
It's all adjustable in values, colors, line thicknesses, etc... it's all good
Tweeks/Improvements:
1) now has a shorter overlay title so it takes up less space on the chart and is less distractive
2) the 30, 50 and 128 SMA's are now default pink which stand out well and are easier to associate as SMA's
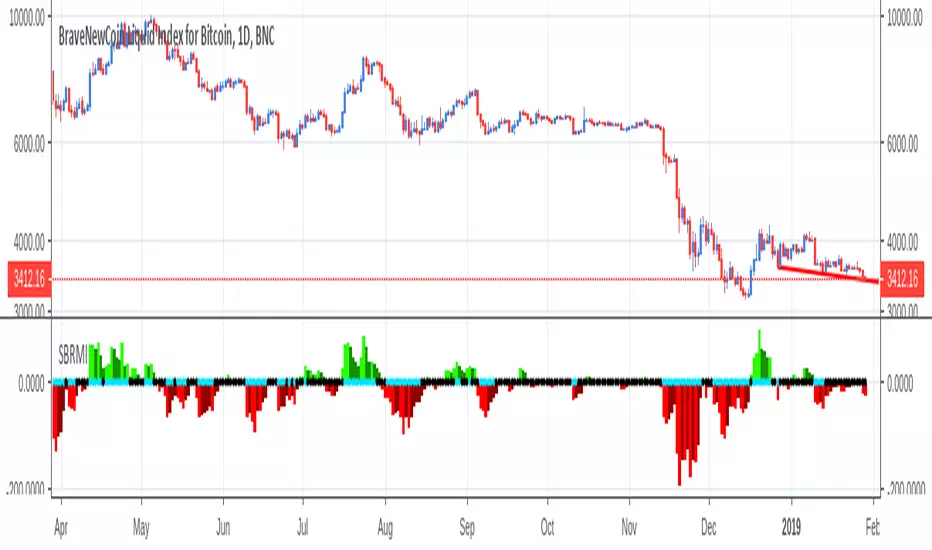
Saracino Bitcoin Relative Momentum IndexThis is a technical indicator developed by Andrea Saracino. It gives buy and sell signals and works best on the daily charts.
This indicator is better suited for Bitcoin. In fact, throughout the history, it gave very consistent buy and sell signals on this asset. Could also be used in other cryptocurrencies.
It consists of two components: the histogram and the dots.
HISTOGRAM
The histogram shows the actual momentum of a given price trend and can be used to check if the trend is strong or if it's getting weaker overtime. When the momentum is to the upside it is green, while it is red if the momentum is to the downside.
DOTS
This is the actual signal part. It consists of a series of dots that become blue if there is a clear signal in either way.
For example: if the momentum is going up and the dots become blue it is a buy signal, or a sell signal if momentum goes down.
DISCLAIMER
This is NOT the Saint Grail indicator. You must not open any trade using just this indicator. Create a strategy instead.
Simple Moving ModeIntroduction
While this indicator is the first of it's type and has never been built before, it is as fundamental as a moving average!
The code complexity was very high which is the primary reason this has not been done before.
The indicator operates in real-time and does not change after it has been plotted as it has been coded in the latest Pinescript V3 meaning that it is fully functional for trading!
Understanding the Simple Moving Mode (SMMO)
By definition, the mode is the value within a set of data that occurs the most often. This makes it different to an average or median. In this context, the “Period” of the moving mode defines how many candlesticks should be used in the data set.
Once the period of data has been defined, the most commonly occurring price within that set must be determined. Unfortunately, the event of any high, low, or closing value of a time stamp being the same is infrequent as many securities trade to the precision of at least two decimal places. To overcome this, the middle value represents each candlestick in the data set and a user defined precision factor has been created labelled, Range .
Setting this value to zero will mean that each value within the period must be the same, while setting this value to “1” will allow for +/-0.5% between the values, making modal occurrences more common. If a mode does not occur within a set, the indicator will automatically plot the candle value.
Indicator Utility
The Simple Moving Mode has many different applications. While price action can be used as a point of reference when trading with the indicator, it is recommended to pair the SMM with other indicators to create points of interest.
Remember, the mode will only change when another more commonly occurring value presents itself. For this reason, the SMM appears as a Step-Line. This indicator works as a perfect representation of a Moving Mode with a defined period. Any indicator that is plotted as a smoothed or curved line is NOT MODAL.
Don't forget to give it a like!
Right now, the script only caters to a period length of 1 to 50. If there is enough interest, I will continue to finish up to a period length of 200 (this will probably be another 1000 lines of code).
Happy Trading!

Ultimate Bar Analysis Emiliano MesaMy most complex script as a gift to you @TradingView.
Simple price action analysis. Look at the chart and the indicator will do everything else for you. This indicator is based in a combination of several indicators, including ADX, EMA, and concepts by the book "Bar by Bar" by Al Brooks. You can use it any way you like.
Its been tested in 5 minute stock charts, anything else is not assured to work.
Key:
Yellow/Pink ===> Buyer / Seller pressure (Bears/Bulls are gaining momentum)
Green/Orange ===> Up Trend / Down Trend, this is based on ADX, change the values if you wish.
Red ===> High reversal chance, based on Al Brooks book.
Grey Bars ===> No man land. (No trend is taking place)
Hope you enjoy! Leave your feedback down below.
---------------------------------------------------------------------
Want your own indicator? Email me at : emilianomesauribe2000@live.com
Prices starting at 100$
Kovach OBVThe Kovach OBV measures sustained buying pressure. It features advanced signal processing algorithms to minimize lag and filter the effects of volatility. Consider using it with the Kovach Chande indicator and Kovach Momentum indicator.

Ichimoku PanOptic TM-V1Modified Ichimoku indicator with signals from PanOptic Method by User Ichimoku_Trader.

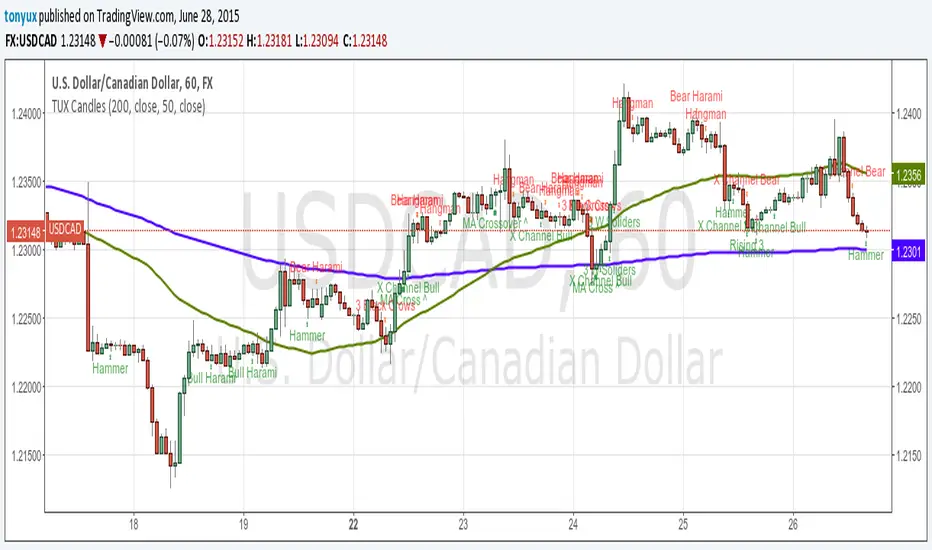
TUX CandlesThis indicator has a lot of information. This is the first version so stay tuned for updates, and please let me know of any bugs.
Candlestick Indicators:
Doji
Shooting Star
Evening Star
Hammer
Hanging Man
Candlestick Formations
Tri-star
Bearish Harami
Bullish Harami
Bearish Harami Cross
Bullish Harami Cross
Bullish Engulfing
Bearish Engulfing
Rising Three
Falling Three
Bearish Abandoned Baby
Bullish Abandoned Baby
Three Black Crows
Three White Soldiers
Technical Indicators:
(You can set you MA periods)
Moving Average Cross
Move Average Crossover