Drip's 11am rule breakout/breakdown (OG)This indicator is based on Drippy2hard's 11:30 am (EST) rule.
In simple terms the rule states that:
If a trending stock makes a new high after 11:15-11:30am EST, there is a 75% chance of closing within 1% of High of day (HOD). Same applies for downtrend.
Please note:
Not all stocks will abide by this, this is backtested on stocks with avg daily volume > 2M and mostly mega cap stocks which have liquid option chains. The backtesting results show very promising results on $SPY/ $SPX so it is advised to trade $SPY/ $SPX using this indicator over any other stocks.
Although the name suggests 11 AM rule, the backtesting shows higher win rate for 11:30 AM so please select that option in the settings.
As always, no indicator is perfect and please follow your risk management and understand that indicators are tools to aid your trading and by no means they are supposed to work as intended in all scenarios
How the script works
1. A HOD/LOD zone is identified based on regular session (9:30am-11:30am) EST. Users can select cut off time to 11AM in the settings. These will be indicated on chart after 11/11:30pm depending on what user selected
2. If the stock breaks above the HOD and the ADX is showing strong momentum to upside then the candlesticks will start showing neon color, if the trend based on moving averages and candle closing is also bullish then the indicator will show trend arrows under the candle indicating to stay in the trade. Same applies for break below LOD, only the colors will change to represent downtrend.
3. An optional cloud is also shown if the trend is developed. The cloud can be used as trail stop or re entry point as long as it is displayed on chart
How to use the indicator in trading
In general, there are three scenarios which are trade worthy
1. If the stocks breaks out above the HOD zone and up trend develops or the stocks breaks below the LOD zone and downtrend develops. See images below
2. You can also use the LOD/HOD zone as demand/ supply if the Price action is range bound like this example below
Thanks for reading, please give thumbs up if you like using it! Please post comments on how to use it.
Swing

Swing Indicator (2 before, 1 after) v2 with Dong-DangFeatures
Detection Swing (swing HIGH is the highest bar among 2 bars before and 1 bar after, and swing LOW is the lowest bar among 2 bars before and 1 bar after)
Dong-Dang (The line plot switch between a swing HIGH and LOW ==> represents the price movement)
Fixes
fix swing detection from the last version when there are 2 or more bars that have the same high or low price
======== ======== ========
ฟีเจอร์
การจับสวิง (จะเป็นสวิง HIGH ก็ต่อเมื่อแท่งนั้นสูงกว่า 2 แท่งก่อนหน้า และ 1 แท่งด้านหลัง, และจะเป็นสวิง LOW ก็ต่อเมื่อแท่งนั้นต่ำกว่า 2 แท่งก่อนหน้า และ 1 แท่งด้านหลัง)
ด๊องแด๊ง (คือเส้นที่ลากสลับไปมาระหว่างสวิง High และ Low ==> ใช้เพื่อดูการเคลื่อนที่ของราคา)
สิ่งที่แก้ไข
แก้ไขการจับสวิงจากเวอร์ชันก่อนหน้า ในกรณีที่มีแท่งเทียน 2 แท่ง หรือมากกว่า มีค่า high หรือ low เท่ากัน
======== ======== ========
Credit: Bravo Trade Academy

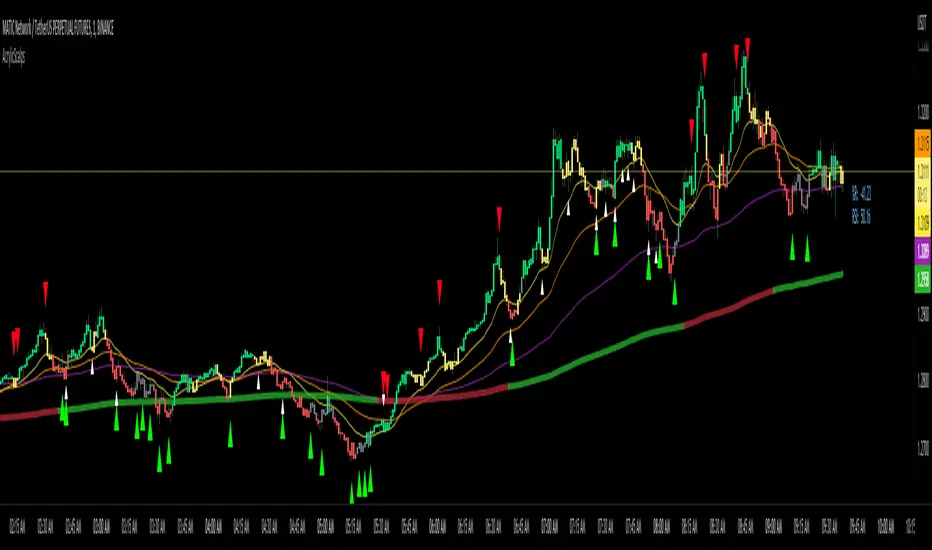
Acrylic's 1m/3m Scalper Buy/Sell SignalsAcrylic's Scalper Signals uses a combination of RSI / Stochastic / Williams %R to calculate the perfect entry signals. The script(with it's default settings) has been optimized and thoroughly tested on BTC & ETH 1 and 3 minute time frames. It's intended for quick in and out trades that should only last a few minutes unless a strong trend is caught. Basic knowledge of market structure is needed, as you will not be taking every signal generated by the script.
You also have the option to display all signals regardless of the short term trend that has been confirmed by RSI. This can be good if you're looking for reversal entries at resistance/support levels.
-Large triangle signal: Strongest signal that was confirmed with RSI & Williams %R optimized calculations. (prints at current candle close)
-Small triangle signal: Fractal signal can be used as a late entry signal/continuation. (prints after 2 candle closes)
-Candle colors are matched to stochastic strength for added confluence to enter trades. (Must hide default trading view candles to see these)
-233SMMA color is matched to the extreme short term trend based off of RSI calculations.
Perfect Long Entry Setup Image :
1) EMA21 > EMA55 > EMA100 > SMMA233(Colored green for added confluence) - All pointing up indicating strong trend
2) Enter on pullback to short term EMA after signal candle closes. (Do not take entry if candles closed below 100EMA)
Perfect Short Entry Setup Image :
1) EMA21 < EMA55 < EMA100 < SMMA233(Colored red for added confluence) - All pointing down indicating strong trend
2) Enter on pullback to short term EMA after signal candle closes. (Do not take entry if candles closed above 100EMA)
Feel free to ask questions or leave feedback in the comments, I'm always looking to improve! Thanks!
Generalized Smooth StepHello, folks. Sorry for not posting anything for a long time, just busy with my university studies for the moment.
Quick script for today — Smooth Step.
You can search for it in Wikipedia, but saying shortly and informatively, this is just an advanced type of oscillator, used as momentum indicator.
In the codes across the Internet everybody uses the 3rd order equation, BUT I found it kinda boring to use indicator this simple, so I made an option to choose the order of the equation in the settings — parameter "Order of the equation". This why it is called generalized smooth step, as it makes possible to use equation of virtually any order.
It is limited to 18 because very strange behaviour that you get after passing 18th order (it jsut becomes not tradeable any longer).
As I've mentioned above, it is an advanced version of classical oscillator, used as momentum indicator .
How to use it?
If smooth step is above 50, then the price momentum is bullish;
If smooth step is below 50, then the price momentum is bearish.
As simple as it is, it becomes useful enough on the higher timeframes (>=1H), so feel free to play with it and find optimal settings for yourself.
Hints
Try perform different smoothing and leading methods (developed by Ehler) to get better results;
You can use smooth step as confirmation/filter for trend-following trades.
Hope you will find it valueable.
Take your profits!
- Tarasenko Fyodor
RU:
Привет, ребята. Извините, что долго ничего не выкладывал, просто сейчас занят учебой в университете.
Быстрый скрипт на сегодня — Smooth Step.
Вы можете поискать его теоретическое обоснование в Википедии, но если говорить кратко и информативно, то это совершенствованный тип классического осциллятора, используемый в качестве моментум-индикатора .
В кодах в интернете все используют уравнение 3-го порядка, НО Мне было скучно пользоваться таким простым индикатором, поэтому я сделал возможность выбирать порядок уравнения в настройках — параметр " Порядок уравнения». Поэтому он называется обобщеннымsmooth step, так как позволяет использовать уравнение практически любого порядка.
Я ограничил порядок уравнения 18 , потому что индикатор показывает начинается очень странное поведение, когда вы делаете порядок больше 18 (индикатор просто начинается вести семя хаотично, что ли).
Как я уже упоминал выше, это усовершенствованная версия классического осциллятора, используемого в качестве моментум-индикатора .
Как им пользоваться?
Если smooth step выше 50, то импульс цены бычий;
Если smooth steз\p ниже 50, то импульс цены медвежий.
Хоть это и очень простой индикатор, он может оказаться достаточно полезным на старших таймфреймах (>=1H), так что не стесняйтесь играть с ним и находить оптимальные настройки для себя.
Советы
Попробуйте использовать различные методы сглаживания и лидирования (разработан Джоном Элером (John Ehler)), чтобы получить лучшие результаты;
Вы можете использовать smooth step в качестве подтверждения/фильтра для сделок, следующих за трендом.
Надеюсь, этот скрипт будет вам полезен.
Получите прибыль!
- Тарасенко Фёдор

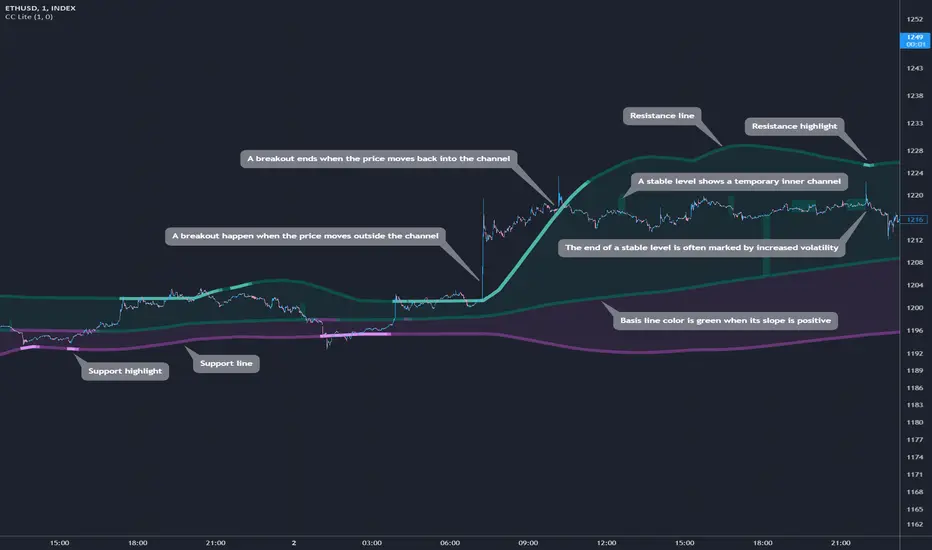
Cosmic Channel LiteCosmic Channel Lite ( CC Lite) draws dynamic non-repainting trendlines and helps
⭐ know when a breakout is about to begin
⭐ predict the position and timing of the next swing reversal
⭐ predict sudden changes in volatility
⭐ recognize whether the price is in bearish or bullish territory
👀 HOW IT WORKS
Cosmic Channel Lite draws a dynamic channel consisting of a support line, basis line and resistance line. These are calculated by applying the Reduced Median Method to groups of moving averages of different type over several periods each, effectively taking 20 data points and reducing them to 3. In between, 6 internal levels are left to give context inside the channel with stable levels, the extremes of which help highlight the SR lines (see chart). The basis line color is determined by its smoothed angle with positive angles in green and negative in purple. The aim of this indicator is to provide a consistent and generic price context that works out-of-the-box and accordingly the settings have been stripped to the bare minimum with no need to continually adjust them.
📗 HOW TO USE IT
The Cosmic Channel Lite plots are meant to be used as a guide for entering and exiting positions and setting stop-loss and take profit levels. The indicator is deemed effective for any particular timeframe as long as the price stays within the maximum bounds of the indicator's plots. For this reason it is recommended to use Cosmic Channel Lite in a multi-chart layout where each chart has a different timeframe. The 5 primary strategies are:
long when the price reverses off of the support line and short when the price reverses off of the resistance line
long when the support line is highlighted and short when the resistance line is highlighted
long when the price breaks above the resistance line and short when the price breaks below the support line
long when the price moves above the basis line after being below it for a prolonged period and visa-versa (short when the price moves below the basis line)
long/short in the direction the price takes after a stable level ends
🔔 SMART ALERTS
Get notified at the most critical times by settings just one alert. Simply select CC Lite and Any alert() function call as the conditions when creating an alert and you will be tipped-off on bar-close as follows:
R─ (resistance line is highlighted)
S─ (support line is highlighted)
For example, an alert such as CC Lite 6h R─ would mean that during the last 6-hour bar the resistance line has been highlighted. The highlight lasts at least 15 bars from the first highlight bar regardless of price action.
Theory Affinity TrendlinesThis indicator is perfect for traders who want to identify trend lines on a chart. It draws higher low uptrends and lower high downtrends, making it easy to see where the trend is going. You can also customize the settings to fit your needs, making it the perfect tool for your trading arsenal.
With this new tool, you can easily customize your experience to get the most out of your trading and analysis. With options like max lines, strength multiplier, pivot plots/text, and more, you can easily create the perfect trading analysis environment.
So why wait? Try it out today!
Leave feedback and let me know what you think.
// ############################################################################################## Input Descriptions
Pivot Left ----------------- look left n bars
Pivot Right ---------------- look right n bars
Strength ------------------- Pivot multiplier (Higher = Wider Trend lines)
Max Lines ------------------ Number of lines for each Uptrend and Downtrend
Structure Text ------------ Show HH, LL, etc. on chart
Structure Markers -------- Dots at the Pivot Highs and Lows
Plots ------------------------ Draw a line at Pivot Highs and Lows
Last Up Width ------------- Width of the current Uptrend line
Historical Up Width ------ Width of previous Uptrend lines
Last Down Width --------- Width of the current Downtrend lines
Historical Down Width --- Width of previous Downtrend lines
Line Offset ---------------- Shift trend lines right or left
* Lines may or may not "repaint". For use to identify trends that are more than likely already established and to identify trend line breaks.

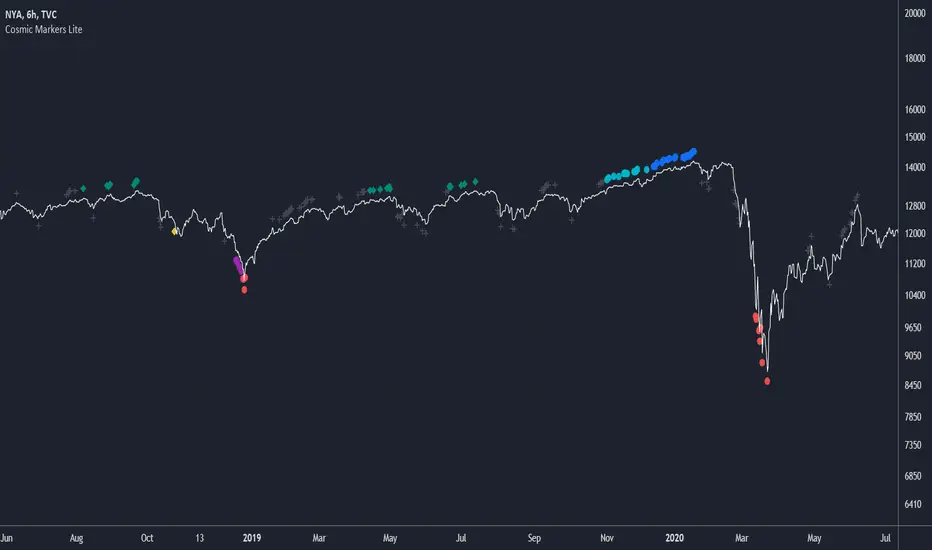
Cosmic Markers LiteThis marker-only indicator traces highest and lowest bars using 5 different periods (the first 3 in aggregation and the rest as is) for a total of 10 support and resistance signals of varying strength. Use Cosmic Markers Lite on its own or add on top of existing chart patterns or other line indicators.
Mark Structure ShdwMark Structure Show is building the market swing structure, minor and sub structure and marks all possible insignificant pivots
This indicator is the alternative version of Mark Structure indicator, I had to create another indicator in order to avoid programming limitation of TreadingView.
This version uses confirmation approach as confirming by body, it means every swing low/high is confirmed when the body (of newly creating swing low/high correspondingly) takes place and intercepts it. the same behaviour is with breaking structure its confirmed only by body.
From trading prospective with this kind of approach we can easily detect manipulations (caused by sweeps) and disregard those manipulation as elements which are breaking the structure. so its extremely useful for those who are trading smart money price actions and basing on swing structure POI
it supports:
- Marking all pivots with labels or join them continuously with trend lines.
- Marking minor and sub structured swings with labels or join them continuously with trend lines. Marking last actual CHoCH and BOS. Minor and substructure are structures inside swing structure and it can differ from the structure of lower timeframe
- Marking swings of swing structure with labels or join them continuously with trend lines.
- Changing bullish and bearish colors of each kind of structures
- Changing pivot labelings
- Changing colors
Remarks:
- Don't expect to have minor and sub structure in each swing waves, its totally fine when you don't have them at all
- Swing structure is the most significant structure and shows real price direction.
- The last swing is not able to be confirmed it tries to build 2 swings that most likely would be either substructure or SMS BOS

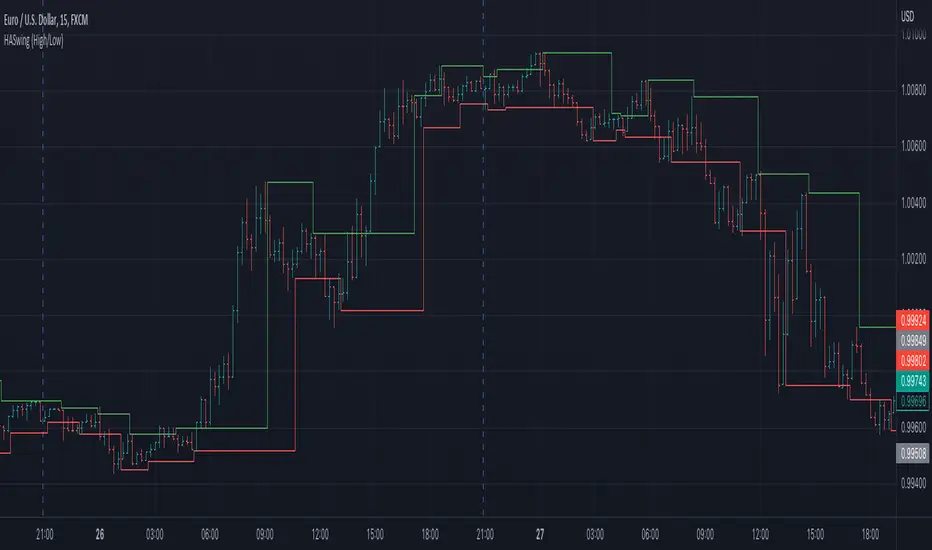
Heiken Ashi Swing High/LowIt uses Heiken Ashi candles to detect recent swing high and low.
It can be used as a stop-loss or support/resistance indicator.
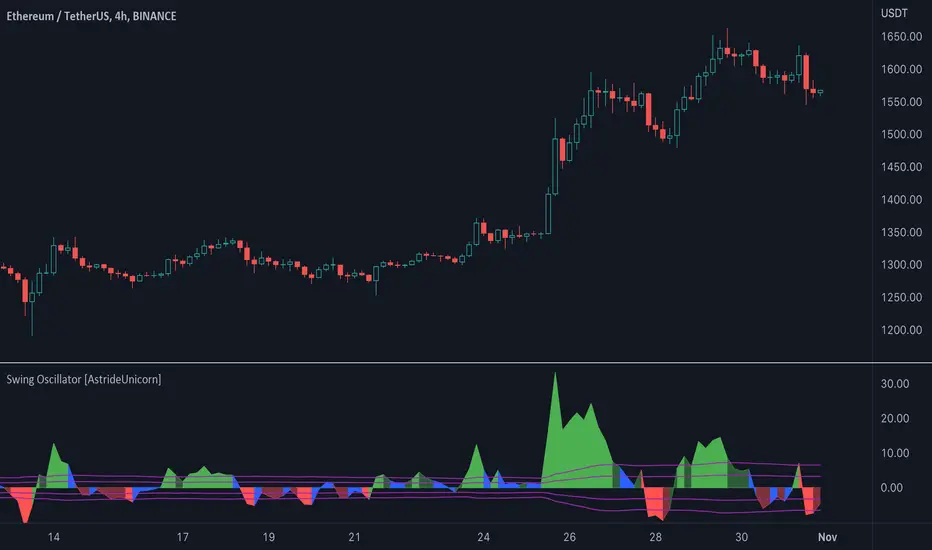
Swing Oscillator [AstrideUnicorn]The Swing Oscillator is an indicator that can help you catch small price movements, called swings. Swings are minor trends that occur when price moves between the highs and lows of a trend or range. Because of the short-term nature of swings, a new movement should be identified as soon as possible.
The indicator is based on our original formula, which averages the length of candlestick bodies and compares the result to several thresholds. This allows the algorithm to determine the direction and strength of the price movement.
HOW TO USE
When the indicator is above the zero level and colored green, it means that the price is in an upward swing. When the indicator is below the zero level and colored red, the price is in a downward swing. When the indicator is blue, the price swing is slowing down or the market is moving sideways. The amplitude of the oscillator shows the price volatility.
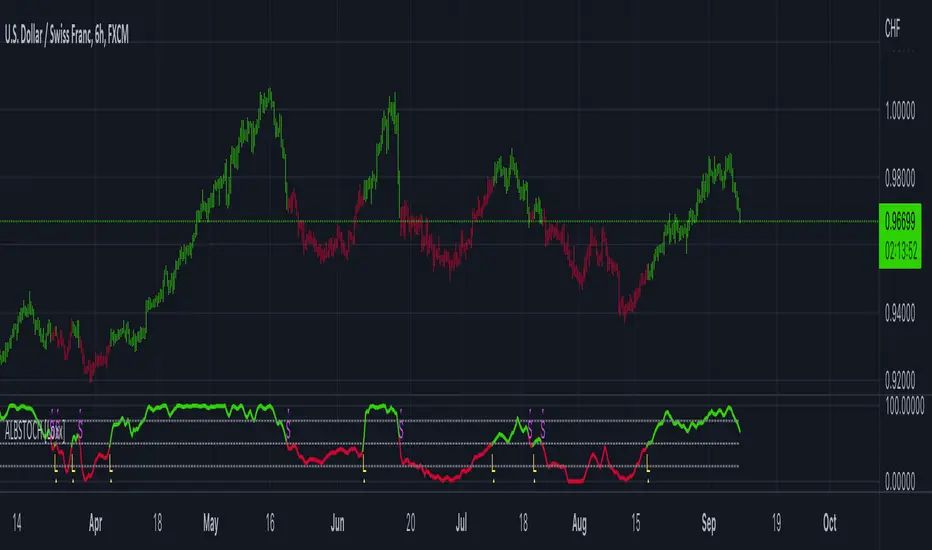
Adaptive-Lookback Stochastic [Loxx]Adaptive-Lookback Stochastic is an adaptive stochastic indicator.
The Adaptive lookback is truly a market-driven period input used to determine the variable lookback period for many different indicators, instead of a traditional, fixed figure.
It is based on the frequency of market swings - the time between swing highs or swing lows. A swing high is defined as two consecutive higher highs followed by two consecutive lower highs; a swing low is defined by two consecutive lower lows followed by two consecutive higher lows. As swing points typically accompany reversals, they occur more frequently in choppier and volatile markets than in trends.
Adaptive lookback period is determined as :
Determine the initial number of swing points (swing count parameter) to use in the calculation.
Count the number of price bars it takes for the n swing points to form.
Divide step 2 by step 1 and round the result.
As an addition, adjust the "speed" of the produced period using the speed parameter - the smaller the speed parameter, the "slower" the average, and vice versa
Included
Bar coloring
Loxx Expanded Source Types
3 types of signals: levels crosses, slope, and middle crosses
Alerts
Intraday 5 Day Moving Average for Swing TraderThis indicator helps swing trader to quickly see if a stock or an index is in a short term up- or downtrend.
The 5 Day Moving Average line is shown on all intraday timeframes like 5, 10, 15, 30, 60, 65 and so on.
When an index like SPY or QQQ shows a green 5 DMA line, the index is in a short term uptrend and you can buy stocks for a swing trade,
when the line turns red be careful and stop buying stocks, instead watch out to short stocks.
In addition to the 5 DMA line you can show the percent distance to the 5 DMA and have multiple options to customize the indicator.
Features
■ Use SMA or EMA for the 5 DMA
■ Use different intraday timeframes or show on daily
■ Show the distance in percent
■ Different color modes
■ Multiple customize options

Mark StructureMark Structure is building the market swing structure, minor and sub structure and marks all possible insignificant pivots
Building such structure is really complex task to do, that has a lot of obstacles and challenges. I'm doing my best to develop this indicator behaving in absolutely expectable and right way. Fill free to leave any comments or bug reports.
it supports:
- Marking all pivots with labels or join them continuously with trend lines.
- Marking minor and sub structured swings with labels or join them continuously with trend lines. Marking BOS or SMS BOS, which are mbos. Minor and substructure are structures inside swing structure and it can differ from the structure of lower timeframe
- Marking swings of swing structure with labels or join them continuously with trend lines. Marking BOS or SMS BOS of swing structure
- Changing bullish and bearish colors of each kind of structures
- Changing pivot labelings
- Changing colors of BOSs
Remarks:
- As I told you guys before, it has a lot of challenging cases. eg we have swing low and high on the same candle and in order to decide which pivot goes first I take lower time frame data to figure out what pivot is the first, but it happens that on lower time frame the same issue takes place, due to limitation of TradingView I can't go infinitely to lower timeframes to solve this issue, so I mark those cases with labels
- Another issue is very beginning of the trend its hard to detect swing structure there due to missing historical data. so skip a few waves in the very beginning
- Don't expect to have minor and sub structure in each swing waves, its totally fine when you don't have them at all
- Swing structure is the most significant structure and shows real price direction. Trend change is confirmed when for bull->bear the last HLbull LH>HH and HH-HL-HH are confirmed. You can change labelling for unconfirmed swing trend in the settings. By default its already done

Swing PointsEnglish:
The indicator shows the fractals where stop-losses may be located and can be used to trade from their taking.
You can adjust the length of the fractal (the number of bars with which it is surrounded on both sides, to confirm the validity).
You can also display lines from fractal points for clarity.
To keep the chart clean, you can enable deletion of already taken fractals.
Example of use with deleted fractals and without lines:
Русский:
Индикатор показывает фракталы где могут находиться стоп-лоссы и его можно использовать для торговли от их снятия.
Можно настраивать длину фрактала (количество баров, которыми он окружен с обеих сторон, для подтверждения валидности).
Так же можно выводить линии от фрактальных точек для наглядности.
Для сохранения чистоты графика можно включить удаление уже снятых фракталов.
Пример использования с удалением снятых фракталов и без линий:
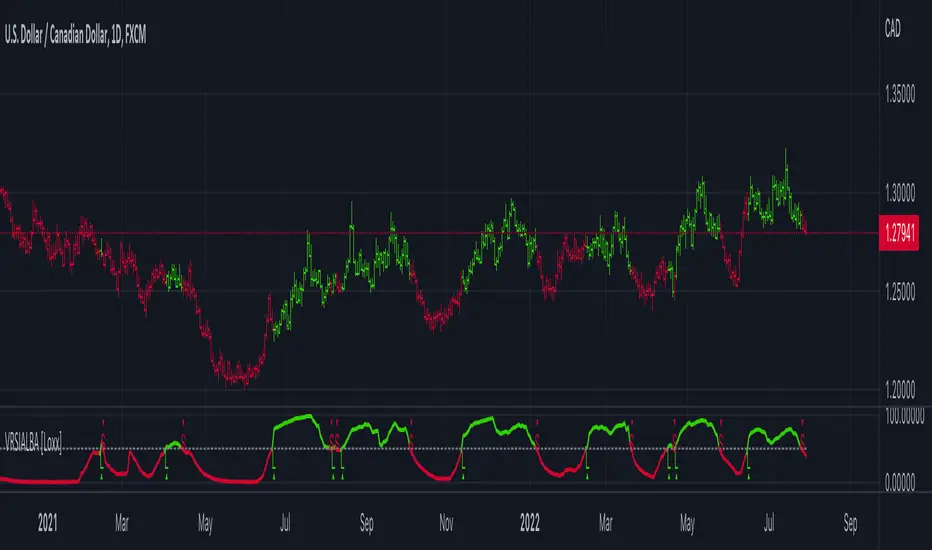
Variety RSI of Adaptive Lookback Averages [Loxx]Variety RSI of Adaptive Lookback Averages uses an adaptive lookback algorithm in order to determine dynamic length inputs to get used to smooth the input price source before calculating your choice of 6 different types of RSI. This ALB algorithm counts bars back until X many swing counts are reached.
Included:
Bar coloring
2 signal variations w/ alerts
Regression Channel Alternative MTF█ OVERVIEW
This indicator displays 3 timeframes of parallel channel using linear regression calculation to assist manual drawing of chart patterns.
This indicator is not true Multi Timeframe (MTF) but considered as Alternative MTF which calculate 100 bars for Primary MTF, can be refer from provided line helper.
The timeframe scenarios are defined based on Position, Swing and Intraday Trader.
█ INSPIRATIONS
These timeframe scenarios are defined based on Harmonic Trading : Volume Three written by Scott M Carney.
By applying channel on each timeframe, MW or ABCD patterns can be easily identified manually.
This can also be applied on other chart patterns.
█ CREDITS
Scott M Carney, Harmonic Trading : Volume Three (Reaction vs. Reversal)
█ TIMEFRAME EXPLAINED
Higher / Distal : The (next) longer or larger comparative timeframe after primary pattern has been identified.
Primary / Clear : Timeframe that possess the clearest pattern structure.
Lower / Proximate : The (next) shorter timeframe after primary pattern has been identified.
Lowest : Check primary timeframe as main reference.
█ EXAMPLE OF USAGE / EXPLAINATION

Price Pivots for NSE Index & F&O StocksPrice Pivots for NSE Index & F&O Stocks
What is this Indicator?
• This indicator calculates the price range a Stock or Index can move in a Day, Week or Month.
Advantages of this Indicator
• This is a Leading indicator, not Dynamic or Repaint.
• Helps to identify the tight range of price movement.
• Can easily identify the Options strike price.
• The levels are more reliable and authentic than Gann Square of 9 Levels.
• Develops a discipline in placing Targets.
Disadvantages of this Indicator
• The indicator is specifically made for National Stock Exchange of India (NSE) listed index and stocks.
• The indicator is calculated only for index NIFTY, BANKNIFTY, FINNIFTY, MIDCPNIFTY and Stocks listed in Futures and Options.
• The indicator shows nothing for other indexes and stocks other than above mentioned.
• The data need to be entered manually.
• The data need to be updated manually when the F&O listed stocks are updated.
Who to use?
Highly beneficial for Day Traders, it can be used for Swing and Positions as well.
What timeframe to use?
• Any timeframe.
• The highlighted levels in Red and Green will not show correct levels in 1 minute timeframe.
• 5min is recommended for Day Traders.
When to use?
• Wait for proper swing to form.
• Recommended to avoid 1st 1 hour or market open, that is 9.15am to 10.15 or 10.30am.
• Within this time a proper swing will be formed.
How to use?
Entry
• Enter when the Price reach closer to the Blue line.
• Enter Long when the Price takes a pullback or breakout at the Red lines.
Exit
• Exit position when the Price reach closer to the Red lines in Long positions.
What are the Lines?
Gray Lines:
• Every lines with price labels are the Strike Prices in the Option Chain from NSE website.
• Price moves from 1 Strike Price level to another.
• The dashed lines are average levels of 2 Strike Prices.
Red & Green Lines:
• The Red and Green Lines will appear only after the first 1 hour.
• The levels are calculated based on the 1st 1 hour.
• Red Lines are important Resistance levels, these are strong Bearish reversal points. It is also a breakout level, this need to be figured out from the past levels, trend, percentage change and consolidation.
• Green Lines are important Support levels, these are strong Bullish reversal points. It is also a breakdown level, this need to be figured out from the past levels, trend, percentage change and consolidation.
What are the Labels?
• First Number: Price of that level.
• Numbers in (): Percentage change and Change of price from LTP(Last Traded Price) to that Level.
How to use?
Entry:
• Enter when price is closer to the Red or Green lines.
• Enter after considering previous Swing and Trend.
• Note the 50% of previous Swing.
• Enter Short when price reverse from each level.
• If 50% of swing and the pivot level is closer it can be a good entry.
Exit:
• Use the logic of Entry, each level can be a target.
• Exit when price is closer to the Red or Green lines.
Indicator Menu
Source
• Custom: Enter the price manually after choosing the Source as Custom to show the Pivots at that price.
• LTP: Pivot is calculated based on Last Traded Price.
• Day Open: Pivot is calculated based on current day opening price.
• PD Close: Pivot is calculated based on previous day closing price.
• PD HL2: Pivot is calculated based on previous day average of High and Low.
• PD HLC3: Pivot is calculated based on previous day average of High, Low and Close.
"Time (IST) (Vertical)"
• This is a marker of every 1 hour.
• Usually major price movement happen between previous day last 1 hour (2:15 pm) to today first 1 hour (10:15 pm).
• Two swings can happen between first 2 hour of current day.
• At the end of the day last 1 hour from 2.15 pm another important movement will happen.
• Usually rest of the time won't show any interesting movement.
To the Users
• Certain symbols may show the levels as a single line. For such symbols choose a different Source or Timeframe from the indicator menu.
• Please inform if any of the Symbol's price levels don't react to the pivots, include the Symbol a well.
• Also inform if you notice any wrong values, errors or abnormal behavior in the indicator.
• Feel free to suggest or adding new features and options.
General Tips
• It is good if Stock trend is same as that of NIFTY trend.
• Lots of indicators creates lots of confusion.
• Keep the chart simple and clean.
• Buy Low and Sell High.
• Master averages or 50%.
• Previous Swing High and Swing Low are crucial.

Support and Resistance Multiperiod (Zig Zag Based)Support and Resistance Multiperiod (Zig Zag Based)
What is the indicator?
• The indicator is a multi period (up to 5 lengths) Support and Resistance indicator calculated based on Zig Zag.
Who can use?
Scalpers to Long term investors
What timeframe to use?
• Any timeframe
What are the lines?
• Green lines are Support levels.
• Orange lines are Resistance levels.
How to use?
• Buy Low and Sell High.
• Brighter zones means strong Support or Resistance.
• Weaker zones appear lighter.
• Brighter zones are formed by overlapping of lines from multiple levels of support or resistance.
Indicator Menu
• The indicator can input 5 different Lengths.
• The default settings uses 13, 21, 52, 100 & 200.
• Every option are customizable.

Volume Profile, Pivot Anchored by DGTVolume Profile (also known as Price by Volume ) is an charting study that displays trading activity over a specified time period at specific price levels. It is plotted as a horizontal histogram on the finacial isntrumnet's chart that highlights the trader's interest at specific price levels. Specified time period with Pivots Anchored Volume Profile is determined by the Pivot Levels, where the Pivot Points High Low indicator is used and presented with this Custom indicator
Finally, Volume Weighted Colored Bars indicator is presneted with the study
Different perspective of Volume Profile applications;
Anchored to Session, Week, Month etc : Anchored-Volume-Profile
Custom Range, Interactive : Volume-Profile-Custom-Range
Fixed Range with Volume Indicator : Volume-Profile-Fixed-Range
Combined with Support and Resistance Indicator : Price-Action-Support-Resistance and Volume-Profile
Combined with Supply and Demand Zones, Interactive : Supply-Demand-and-Equilibrium-Zones
Disclaimer : Trading success is all about following your trading strategy and the indicators should fit within your trading strategy, and not to be traded upon solely
The script is for informational and educational purposes only. Use of the script does not constitutes professional and/or financial advice. You alone the sole responsibility of evaluating the script output and risks associated with the use of the script. In exchange for using the script, you agree not to hold dgtrd TradingView user liable for any possible claim for damages arising from any decision you make based on use of the script

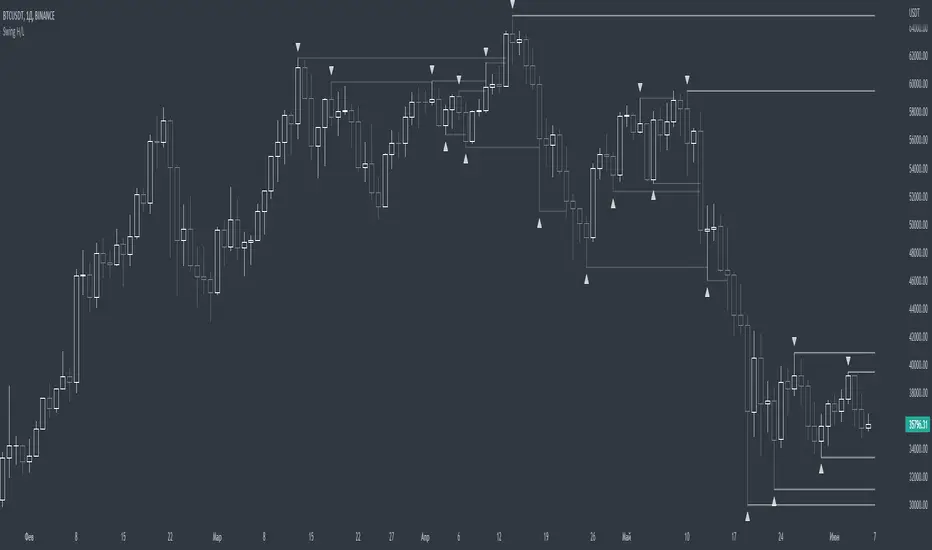
NhaDuHanhFX - Gann SwingsThe swings indicator follows the smallest movements of price action. Can monitor and analyze the context of the market, trying to find bias of each timeframe.
If there is a candlestick completely above the previous swinghigh. It shows a good bullish momentum. The market is favoring the upward direction. If the candlestick is still in the previous swinghigh range, it shows a weak bullish momentum. The market is reluctant to go up.
If there is a candlestick completely below the previous swinglow. It presents a good bearish momentum. The market is favoring the downward direction. If the candlestick is still in the previous swinglow range, it shows a weak bearish momentum. The market is reluctant to go down.

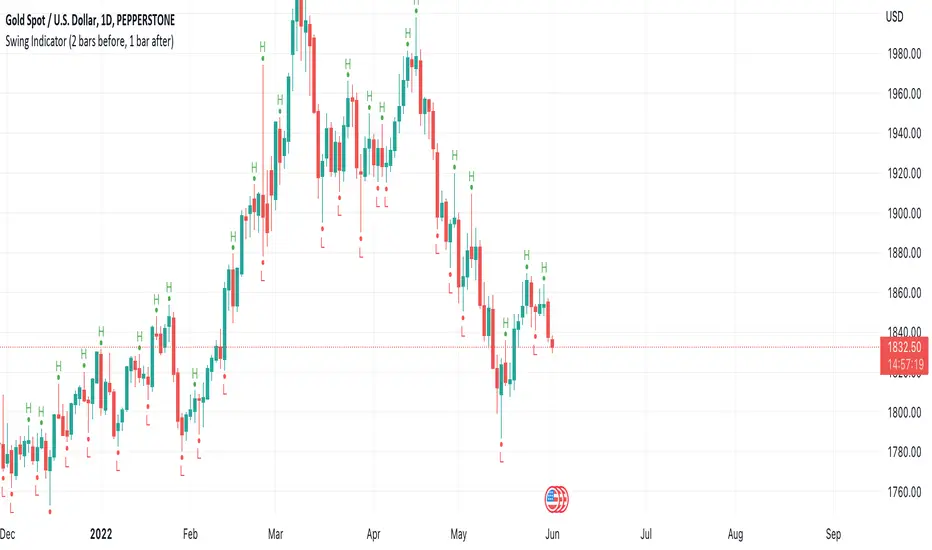
Swing Indicator (2 bars before, 1 bar after)This swing indicator is created to mark swing high and low followed by the condition of Bravo Trade Academy.
Conditions for being a Swing High
- The high price of swing high bar has to be higher than the high price of 2 bars before and 1 bar after
Conditions for being a Swing Low
- The low price of swing low bar has to be lower than the low price of 2 bars before and 1 bar after
=========================================================================
Swing Indicator นี้สร้างขึ้นเพื่อช่วยในการมาร์ค Swing High และ Swing Low ตามเงื่อนไขการเป็น Swing หน้า 2 หลัง 1 ของ Bravo Trade Academy
เงื่อนไขการเป็น Swing High
- ราคา High ของแท่งที่เป็น Swing High จะต้องสูงกว่าราคา High ของแท่งก่อนหน้า 2 แท่ง และแท่งหลัง 1 แท่ง
เงื่อนไขการเป็น Swing Low
- ราคา Low ของแท่งที่เป็น Swing Low จะต้องต่ำกว่าราคา Low ของแท่งก่อนหน้า 2 แท่ง และแท่งหลัง 1 แท่ง
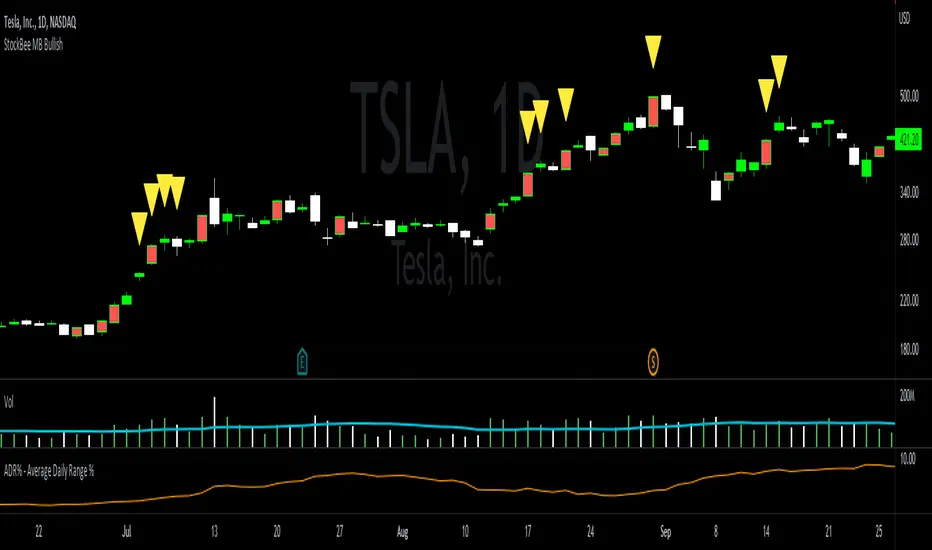
StockBee MB BullishStockBee Bullish Momentum Burst & 20% Plus Study Tool
The Stockbee bullish momentum burst study tool is helpful for practitioners of the momentum burst method who want to easily find historical momentum bursts and/or 20% plus gainers using Trading View. This script finds three specific breakouts that meet the below criteria:
4% Breakouts (Colors Candle Body)
1. Volume of the candle is greater than the previous candle volume.
2. The percent change of candle's price is greater than 4% from the previous candle close.
3. Current candle close is less than 30% from candle's high.
**Users can toggle 4% Breakouts on/off and also change candle body color in settings**
Dollar Breakouts (Colors Candle Body)
1. The change of candle's price is greater than $0.90 from the previous candle close.
2. Current candle close is less than 30% from candle's high.
** Dollar Breakout does not take volume into consideration **
**Users can toggle Dollar Breakouts on/off and also change candle body color in settings**
20% Plus Gainers (Displays Yellow Triangle Icon)
1. The change over five candles is greater than 20%.
**Users can toggle 20% plus label on/off, cannot change the label color**
This script also filters out any candle that gaps up and breaks down with a close above 4% the previous candle (Eliminates gap-ups that fade). This tool is meant to find and filter possible candidates. Not every marked candle is a great momentum burst trade. Users can look at 4% Breakouts, Dollar Breakouts, 20% Plus Gainers individually or any combination of the three.
This is helpful for Trading View users trading this specific setup.
StockBee 4% BreakoutThe Stockbee 4% Breakout script is a study tool for users who wants to do a deep dive on StockBee's 4% Breakout momentum burst method. This script will assist a specific group of traders who trade this method easily find historical momentum bursts. This script finds and colors red any candle body that meets the following criteria:
1. Volume of the candle is greater than the previous candle volume.
2. The percent change of candle's price is greater than 4% from the previous candle close.
3. Current candle close is less than 30% from candle's high.
This script also filters out any candle that gaps up and breaks down with a close above 4% the previous candle (Eliminates gap-ups that fade). This tool is meant to find and filter possible candidates. Not every marked candle is a great momentum burst trade.
This is very helpful for Trading View users trading this specific setup.
