Support and ResistanceThis indicator shows three types of support and resistance lines: Horizontal, Parallel (using linear regression) and Fibonacci Retracement. Lines can be adjusted or turned on and off in settings. A great tool for setting up entries, exits and locating pivot points.
Support

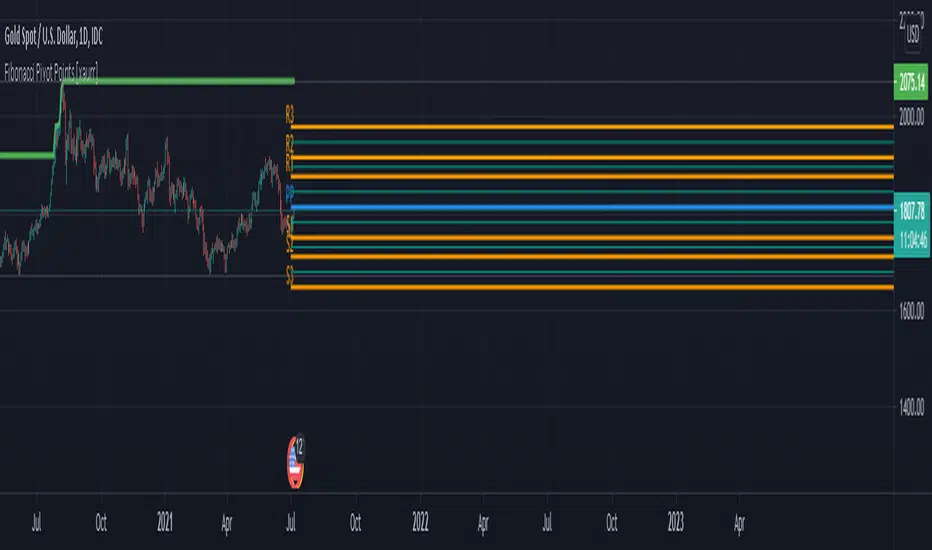
Fibonacci Pivot Points [xaurr]This script is the enhanced version of my previous script Ath Atl Fibonacci Pivot Points
It has standart fibonacci pivot points with auto time frame, you can also choose custom time frame too.
Good Luck!
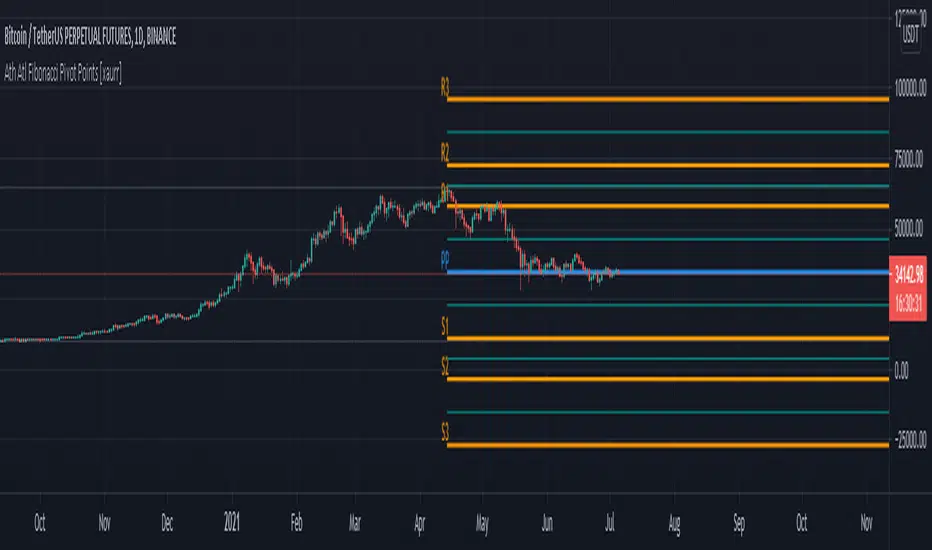
Ath Atl Fibonacci Pivot Points [xaurr]This script draws fibonacci support and ressistance lines according to all time high and low values.
BTC > bull market supportPlots the natural log of the price divided by the 20w SMA and 21w EMA, color coded by the Bitcoin price (green if above, red if below). Use this when comparing Altcoins to Bitcoin's performance. Works in daily & weekly timeframes only!

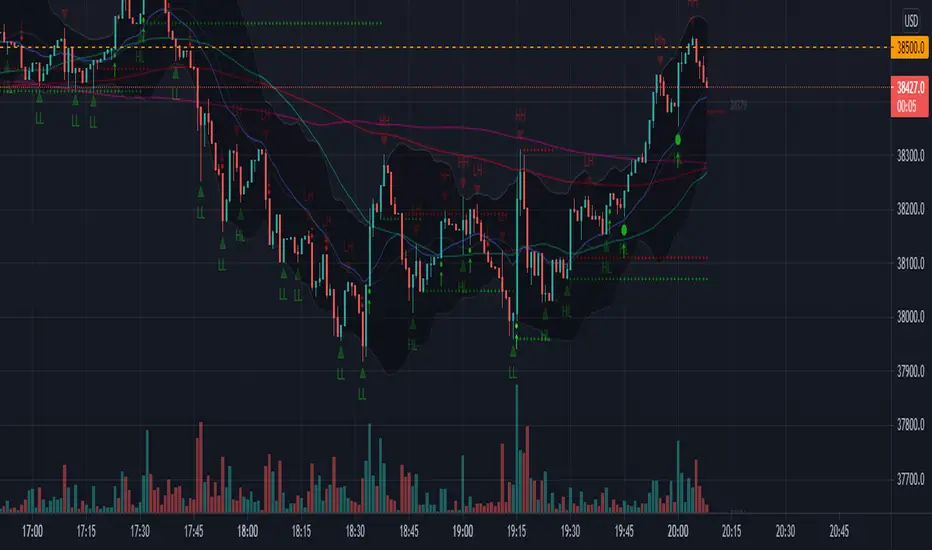
FullPac4Trader (I.Denis)The script combines the three most important indicators on the chart.
1. A set of six moving averages ( EMA and SMA ), which can be turned on and adjusted at your discretion.
2. Indication of support and resistance levels, calculated according to the Bollinger scheme.
3. Pivot Point and the nearest goals using the Floor method with the possibility of selecting a time period.
The script version is v.1 (beta)
The development of this script will continue. Feedback and suggestions are welcome.
Cup FinderHello All,
This script finds the Cups and you can use it while analysing the symbols. it creates circle and channel for the potential Cups and checks the number of bars included by the channel, if included bars is equal or greater than the value you set then it shows the cup.
The Options:
"Number for Bars to search" : Maximum length of a Cup
"Channel Width of the Cup" : Tate by the channel width of highest/lowest levels in last 300 bars, by default it's 5%
"Check for Breakout" : if there is Cup then it checks Close or High/Low is used a source for breaokuts, usuful while cheking historical bars
"Contained Bar Rate %" : after channel is created the script checks number of bars included by the channel of the Cup, you can set rate of included bars by this option
"S how Channels of Cups ": if you enable this option then you can see the channels around the Cups and set it as you wish
and there are some other options for labeling/removing old Cups and for coloring
Here you can see how channel looks like:
Cup with different colors:
P.S. This is an experimental work and sorry for no explanation in the script.
in the future if I have time I will try to write a script for Cup&Handle
This script is also an example to calculate and draw circles :)
Enjoy!

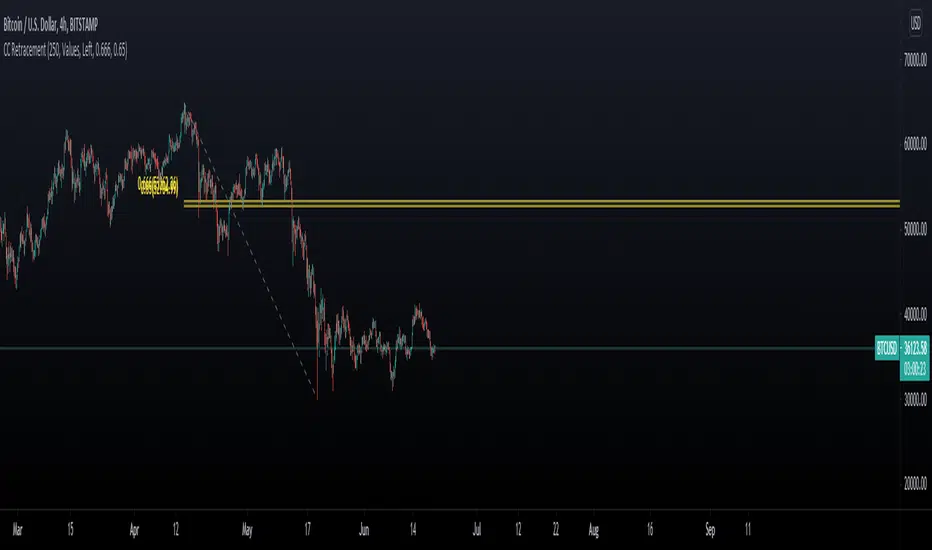
Chart Champions CC Pocket 0.65 -0.666 Fib levels or commonly know as the CC pocket
Marks Strong Support/Ressitance, Use with conflunce.
Lookback Length is adjustable
Let me know any suggestions or ideas which could help improve
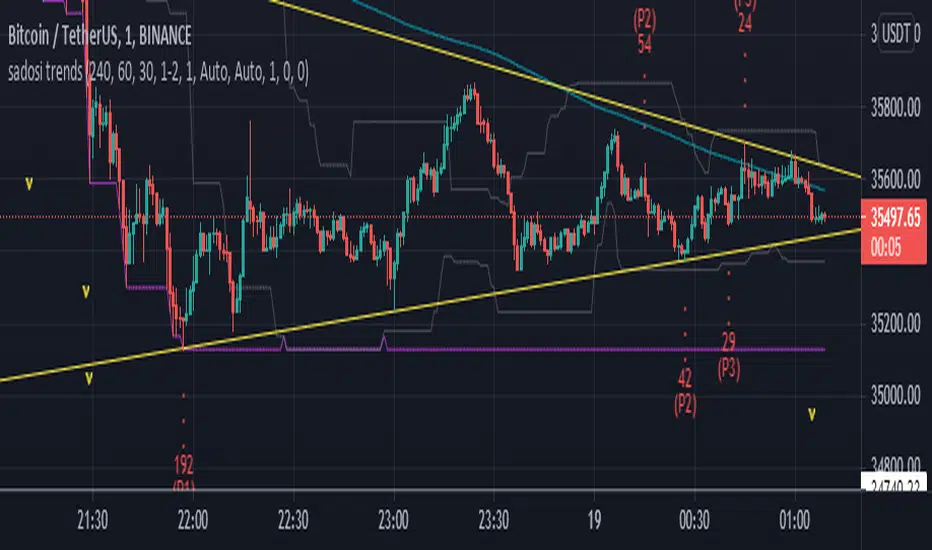
sadosi trends and barrierThis indicator should be used for give ideas.
what they can do?
draw up and down trend lines
draw support and resistance lines
to inform about the current price
signal for high and low prices
how can?
By analyzing the prices in the 3 selected periods, 3 highs and 3 lows prices are marked. With the marked points, trend and resistance lines are drawn. The current price is analyzed and useful calculations displayed in the info box. Finaly adding moving averages. After all these transactions, the trend and resistances become easily visible on the chart.
You can fine-tune the angle of the trend using high and low extensions
you can catch different trend lines by changing the high and low trend points
By changing the periods, you can set position the trend lines more accurately.
When the price is too low or too high, the information box will warn you by change color.
The trend lines to be created are for the purpose of giving an idea and convenience. It can be used on all timeframes, including horizontal trends.
Breakout FinderHelo All,
I got many requests for a Breakout script and here it's. This script searches the breakouts/breakdowns and draw square if there is one.
The options:
"Period" is used to find Pivot Points
"Max Breakout Length" is the maximum length to search breakouts
"Threshold Rate %" is channel width of the breakout area. calculated using highest/lowest of last 300 bars.
"Minimum Number of Tests" is the minimum number of tests that the Price tried to break the S/R level
and some options for coloring and linestyle
Lets see some examples:
in this example "Minimum Number of Tests" is 2 so the Price must have tested to break resistance area 2 times and then it breaks it as seen in the screenshot:
in following example Threshold rate is %10, so the channel width is very big:
as you can see in followinf screenshot you can choose different colors and line styles:
Alerts added ;)
Enjoy!

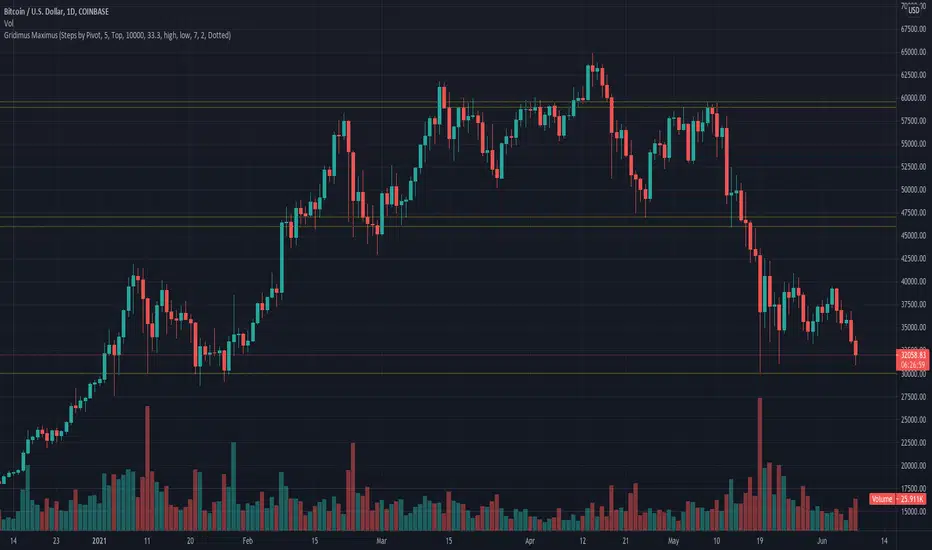
Gridimus MaximusGridimus Maximus draws N grid lines stepping by price or percent in chosen direction from set price, or draws N grid lines stepping by pivots.
The queue function method used is adapted from an example provided on the PineCoders website, much gratitude to LucF for this gem!
To prevent grid lines out of range from causing chart to rescale right click on chart's price column and enable Scale Price Chart Only.
Pictured example above is using Type Of Increment: Steps By Pivot, Number Of Steps: 5.
Pictured example below is using Type Of Increment: Steps By Price, Number Of Steps: 6, Starts From Price: $10k, Steps By Percent Or Price: $10k.
Pictured example below is using Type Of Increment: Steps By Percent, Number Of Steps: 7, Starts From Price: $10k, Steps By Percent Or Price: 33%.
NOTICE: This is an example script and not meant to be used as an actual strategy. By using this script or any portion thereof, you acknowledge that you have read and understood that this is for research purposes only and I am not responsible for any financial losses you may incur by using this script!
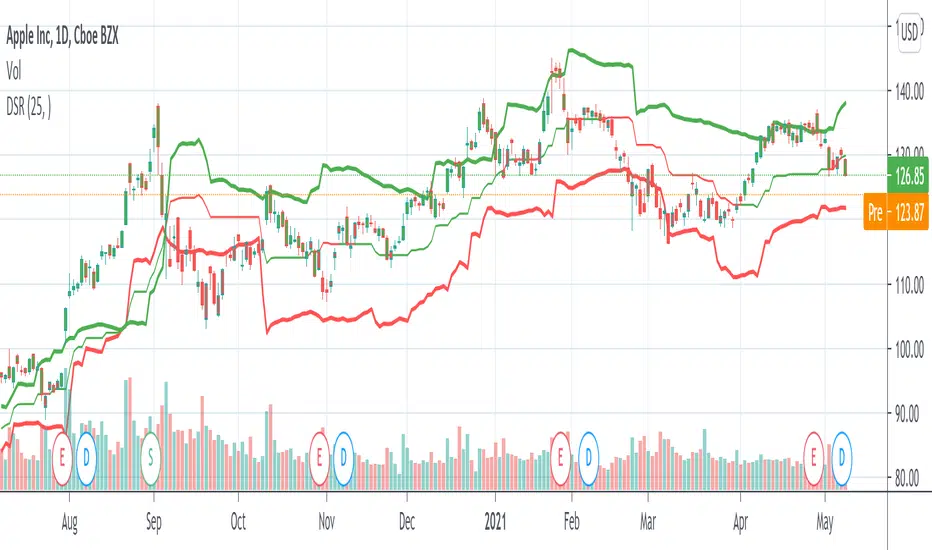
SMA 200 Ribbon MTF - Support and ResistanceThe SMA 200 is one of the most important and strongest support/resistance lines on any timeframe. This script pulls the SMA 200 line from multiple timeframes so traders can visually see price action bounce between support and resistance . The current timeframes SMA 200 is displayed in white and turns yellow to signify "pressure". Can be used on higher timeframes to find bull action. This indicator can also be used to filter out pumps and dumps as shown in example 3 and 4.
Example of indicator on 5 min timeframe. Candles bounce along SMA200 lines.
Example of indicator on daily timeframe . Lines turn green and price action pumps. Lines turn red and price action dumps.
Example 3: A clean crossover of lines usually signals a bullish pump.
Example 4: Tangled or messy lines tend to result in a dump as price action struggles to cross resistance. A pullback is required to "clean" the lines.
EMA Band can be turned on using "tickbox" in settings menu.

Bitcoin Daily Support/ResistanceA new indicator for tradingview.
Indicator Overview
The 2-Year MA Multiplier is intended to be used as a long term investment tool.
It highlights periods where buying or selling Bitcoin during those times would have produced outsized returns.
To do this, it uses a moving average (MA) line, the 2yr MA, and also a multiplication of that moving average line, 2yr MA x5.
Note: the x5 multiplication is of the price values of the 2yr moving average, not of its time period.
Buying Bitcoin when price drops below the 2yr MA (green line) has historically generated outsized returns. Selling Bitcoin when price goes above the 2yr MA x 5 (red line) has been historically effective for taking profit.
Why This Happens
As Bitcoin is adopted, it moves through market cycles. These are created by periods where market participants are over-excited causing the price to over-extend, and periods where they are overly pessimistic where the price over-contracts. Identifying and understanding these periods can be beneficial to the long term investor.
This tool is a simple and effective way to highlight those periods
MA 50/100/150 was historically good support and resistance. When we cross them we have a new trend that is established.

EMA 730 Ribbon MTF - Support and ReistanceThe EMA 730 line is a great way to show dynamic support and resistance . Price action travels "through" this line on each timeframe. This script pulls the EMA 730 Line from multiple timeframes so a trader can visually see price action bounce between support and resistance lines. Lower bands (white lines) can be turned off using "tickbox" in settings. EMA length can also be adjusted in settings. Some charts may work better with a length of 750.
Example of EMA Bands on lower timeframe.

Crypto EMA Bands - Support and ResistanceEMA Bands for crypto markets shows support and resistance lines. Helps identify bull and bear market trends. SMA200 is white and turns yellow to signal pressure. Can also be useful for identifying Elliot waves and breakouts.

Average Band by HarmanUsually, Moving Averages (Simple & Exponential) consider "close" of each candle to form a line for a particular period. In this indicator, we have considered all the parameters (Open, Close, Low & High) of each candle to form a Band or a wave which act as a zone to provide support & resistance. It works well on all the time frames. It perfectly works on lower time frames of 15 min & 5 min for intraday trades and even for scalping. There is a line that moves very near to candles known as "Candle Line" provide support & resistance to each individual candle and a leading line which moves ahead also acts as support & resistance and helps in determining trend direction.
How to use the indicator ?
Indicator consists of 3 components :
1) A Band or wave of 3 lines (upper, middle & lower line)
2) A "Candle Line" which moves along with the candles
3) A Leading line which moves ahead of the candles
Method 1 : When candles are being formed above the candle line (line near to candles) and it crosses the band or wave from below to upside, then long trade can be initiated. Similarly, When candles are being formed below the Candle line and it crosses the band or wave from upside then short trade can be initiated. Stop loss can be maintained below the band for Long trade and above the band for short trade. Candle line can be used to trail the stop loss.
Method 2: If candles moves above and below of the band very often and frequently and candle line is in the middle of candles then it is NO TRADING ZONE. If you still want to trade, then select a higher time frame and check the price movement. If there is a stability in the higher time frame, then take the trade in the higher timeframe with stable movement.
Method 3 : Candle line acts as "First line of Defence". In a uptrend, all the candles are formed above the candle line and in case of down trend, all the candles are formed below the candle line. When a newly formed candle cross the candle line then you can book profit. For Example : In uptrend , candles are being formed above the line, when a new candle started forming below the line and when the complete candle is formed below the line, profit can be booked. Vice-versa in case of downtrend.
Method 4: Direction of leading line, band and candle line helps in determining the trend. If all these three components are in upward direction, price trend is upward and if all these three components are in downward direction, then price trend is downward. When, leading line and band cross each other from opposite direction for consecutive 2-3 times, then price movement is sideways.
Method 5 : Thickness of band play an important role in determining price action. If band is narrow, it means small candles are being formed and no any huge price movement is observed in this period. When band started expanding, it signifies that big candles are begin to form and there is a more price movement than before. Similarly, If contraction of band started, it means that small candles are being formed and there is low price movement as compared to the price movement when Band was expanded. If Band is expanded (wider) and volumes are high, It means the Band will act as strong Support or Resistance than usual. In case, candles and candle line cross the expanded Band, you can enter the Long or Short trade.
Method 6: When the Band, leading line and candle line collides or meet at a single point, then it is either strong support or resistance.
Method 7 : Usage in Scalping : Select the shorter time frame of 1 min or 5 min. If the candles are crossing the band very frequently in 1 min, then select 5 min time frame or wait for few minutes for stability. Now, when candles started forming above the candle line and it crosses the band from below then take a long position and book profit after few candles above the band. Place stop loss below the Band. Similarly, when candles started forming below the candle line and it crosses the band from above, then enter into short trade and book profit after few candles. Place stop loss above the band in the case of short trade.
You can combine above methods to give a sharp edge to your trade and increase the probability of your winning in the trade.
Indicator Settings : Default period selected is 50 for both the Band and leading line. You can change the period to 26 or 100 or 200. Select the period and check the chart, if the indicator looks fine and smooth, then you can use your settings. For most of the time, default settings work perfectly.
Proudly Developed by :
Harmandeep Singh
Graduate in Computer Science with Physics & Mathematics
MBA in Business Marketing and Finance
Experienced Computer programmer & Software developer
Stock Market & Crypto Trader

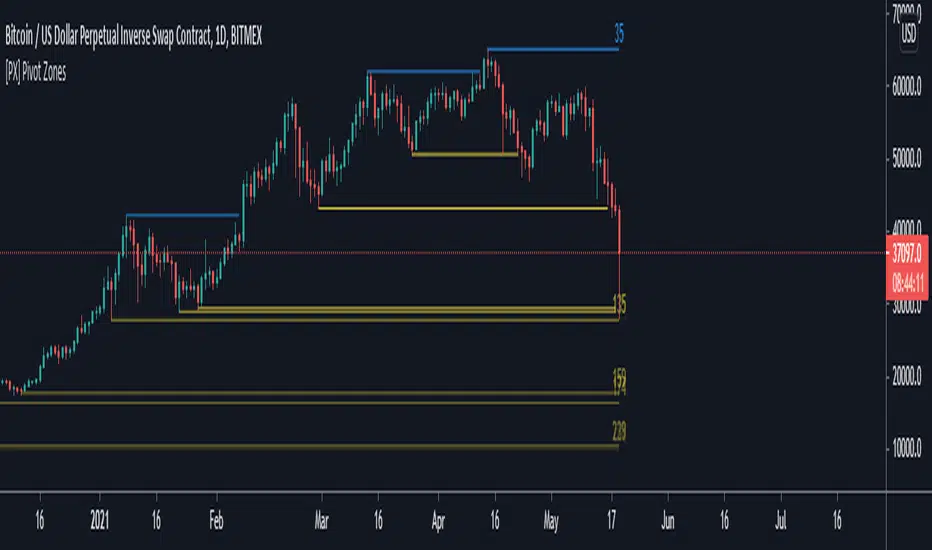
[PX] Pivot ZonesHello everyone,
I was having some fun with the new gradient function, arrays and pivots. Decided that i would publish my little playground :)
This script basically draws lines or zones for detected pivot high and lows and counts the number of candles those levels have been untested.
Tested levels will stop at the candle, which breaks them.
How does it work?
- Define the number of candles that make up the pivot point with the "Pivot Left" and "Pivot Right" parameter (I took more extreme values to showcase the indicator).
- Select your "Layout Type": This can be either a line at the pivot point, a zone between the pivot point and its body or the average of the two.
- You can in-/decrease the number of lines with the "Number of Lines/Zones" parameter.
The older a line becomes the more it will lose of its original transparency.
Hope that might be useful to some of you :)
Please click the "Like"-button and follow me for future open-source script publications.
If you are looking for help with your custom PineScript development, don't hesitate to contact me directly here on Tradingview or through the link in my signature :)
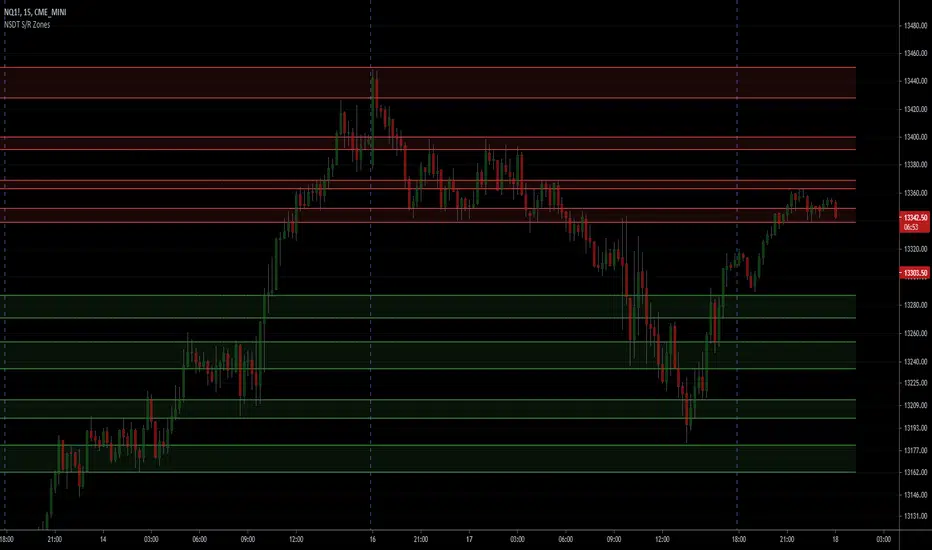
NSDT Support/Resistance ZonesA simple script that allows you to plot 8 different zones of support and resistance. Enter the high and low of a support/resistance zone, and the script will fill the range for easier viewing. Open source and all settings can be customized.
Dynamic Support And Resistance [CC]The Dynamic Support And Resistance Indicator was created by Mike Siroky (Stocks and Commodities pgs 14-18) and this is a handy indicator that will show you useful support and resistance levels no matter how the stock is doing right now. I have color coded the middle line to show buy and sell signals so buy when the line turns green and sell when it turns red.
Let me know if there are any other indicators you want me to publish!
Projected Support And Resistance [CC]Projected Support And Resistance is a custom indicator of mine loosely based on the work done by Ketan Asher (Stocks and Commodities Bonus Issue 2021 pgs 12-14) and generally speaking this does a pretty good job of telling you what the future behavior of the stock will be. As the lines widen apart, there will be either upward or downward momentum. Buy when the line turns green and sell when it turns red.
Let me know what other indicators you would like to see me publish!

Support Resistance ChannelsHello All,
For Long time I was planning to make Support/Resistance Channels script, finally I had time and here it is.
How this script works?
- it finds and keeps Pivot Points
- when it found a new Pivot Point it clears older S/R channels then;
- for each pivot point it searches all pivot points in its own channel with dynamic width
- while creating the S/R channel it calculates its strength
- then sorts all S/R channels by strength
- it shows the strongest S/R channels, before doing this it checks old location in the list and adjust them for better visibility
- if any S/R channel was broken on last move then it gives alert and put shape below/above the candle
- The colors of the S/R channels are adjusted automatically
You can set/change following settings:
- Pivot Period
- Source : High/Low or Close/Open can be used
- Maximum Channel Width %: this is the maximum channel width rate, this is calculated using Highest/Lowest levels in last 300 bars
- Number of S/R to show : this is the number of Strongest S/R to show
- Loopback Period: While calculating S/R levels it checks Pivot Points in LoopBack Period
- Show S/R on last # Bars: To see S/R levels only on last N bars
- Start Date: the script starts calculating Pivot Point from this date, the reason I put this option is for visuality. Explained below
- You can set colors/transparency
- and You can enable/disable shapes for broken S/R levels
Examples:
You can change colors as you wish:
here " Show S/R on last # Bars " set 100:
Sometimes visuality may corrupt because of old S/R levels, to solve it you need to set "Start Date" in the options to start the script in visual part (last 292 bars)
here in first screenshot it doesn't look good (shrink), then on second screenshot I set the "Start Date" it looks better, if you change time frame don't forget to set it again :)
Enjoy!

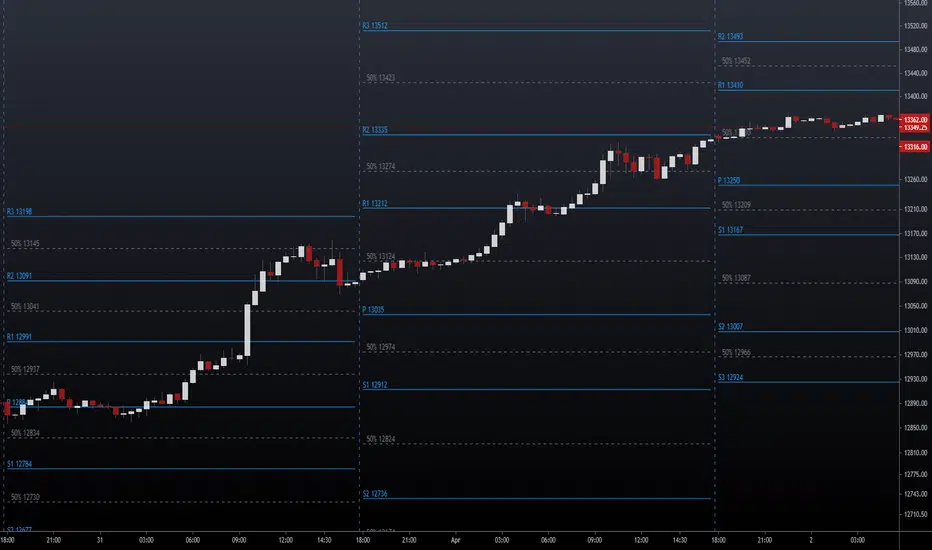
NSDT Pivot Points PlusThis script uses the Traditional Pivot Points but includes the price levels and the 50% line between levels. We added the ability to change the line color of the major levels and the minor levels independently, for better clarity. Added alerts - used code from QuantNomad.
Pivot Points description from TradingView default indicator:
Pivot Point analysis is a technique of determining key levels that price may react to. Pivot points tend to function as support or resistance and can be turning points. This technique is commonly used by day traders, though the concepts are valid on various timeframes. There are several methods of identifying the exact points. Common types of pivot points are Traditional, Fibonacci, Woodie, Classic, Camarilla and DM and each type has its own calculation method.
Most use a variation of significant prices such as established highs, lows, opening and closing prices and then apply a calculation to determine these points. They all calculate additional support and resistance levels alongside the pivot points. They can be used to determine when to enter or exit trades or to determine the range of a market. Conservative traders look for additional confirmation before entering a trade. Whether pivot points are used alone or in combination with other techniques, they are a useful tool in a technical trader's toolbox.
[RickAtw] O1 Opening Market LineThis indicator helps to identify current support and resistance based on the opening of the Asian, London and New York sessions.
Function
You can make good trade entries based on these lines. Shows daily and weekly openings of each session
It will also help you to look at which session you are currently trading)
Purple ----> Asian session
Red ----> London session
Blue ----> New York session
Key Signal
buy ---> A strong buy signal is a bounce from the low and the presence of a weekly or day open line.
sell ---> A strong sell signal is a bounce from the maximum and the presence of a weekly or day open line.
P.S. Be sure to test on your pair!
Remarks
This will help you determine the approximate area of support and resistance.
Since we cannot look into the future, it does not inform you about the exact records, but a possible change in trends.
Readme
In real life, I am a professional investor. And I check each of my indicators on my portfolio and how effective it is. I will not post a non-working method. The main thing is to wait for the beginning of trends and make money!
I would be grateful if you subscribe ❤️

NSDT Pivot ZonesThis is a new take on Traditional Pivot Points. By modifying the calculations, we were able to create "pivot zones" with a decent degree of accuracy.
