TSF 20What kind of traders/investors are we?
We are trend followers. We look for assets that are outperforming the market. Our scripts are designed to be used on the higher timeframes (weekly/daily) to catch the large moves/trends in the market.
Our scripts have been designed to help you follow the trend in an asset.
What does this script do?
This script is designed to colour candles on a chart based on their position relative to two sets of Bollinger Bands. Here's a breakdown of how it functions:
Bollinger Bands Setup:
The script uses two sets of Bollinger Bands, both with a length of 20 and based on the closing prices of candles.
The first set of Bollinger Bands uses a standard deviation (StdDev) of 1.
The second set uses a standard deviation of 2.
Neither set of bands is displayed on the chart.
Coloring Candles:
Green Candle: A candle is coloured green if its close is above the upper Bollinger Band with StdDev 1 but below the upper Bollinger Band with StdDev 2. This indicates a moderately bullish sentiment.
Dark Green Candle: A candle is colored dark green when its close is above the upper Bollinger Band with StdDev 2. This implies a stronger bullish sentiment.
Red Candle: A candle is coloured red if its close is below the lower Bollinger Band with StdDev 1 but above the lower Bollinger Band with StdDev 2. This indicates a moderately bearish sentiment.
Dark Red Candle: A candle is colored dark red if its close is below the lower Bollinger Band with StdDev 2, indicating a stronger bearish sentiment.
Grey Candle: A candle is coloured grey if it closes between the upper and lower Bollinger Bands with StdDev 1. This usually signifies a neutral market condition or periods of consolidation.
In summary, this script is an analytical tool that visually represents the market's bullishness or bearishness relative to the Bollinger Bands, without displaying the bands themselves. It's designed to help investors quickly assess market conditions and sentiment based on the colour-coded representation of price action in relation to these volatility bands.
What makes this script unique?
Innovative Color-Coding System: Candles are colored in varying shades of green and red, providing an immediate visual cue about the market's bullish or bearish tendencies. A neutral grey is also used, offering a quick assessment of market indecision or consolidation phases.
Dual Bollinger Band Analysis: Utilizes two sets of Bollinger Bands (StdDev 1 and StdDev 2) to gauge market volatility and sentiment. This dual-band approach enhances the precision of sentiment analysis compared to using a single standard deviation.
Customizable and Non-Obtrusive: Designed to keep your charts clean and readable. The Bollinger Bands themselves are not displayed, reducing visual clutter and allowing for a focus on price action.
Versatile and Adaptable: Suitable for various trading styles and timeframes. Whether you are a short-term or long-term investor, this indicator can be seamlessly integrated into your analysis toolkit.
Valuable Addition to Market Analysis: Enhances traditional candlestick analysis and complements other technical indicators and strategies. It offers an additional layer of understanding market dynamics and can be used to confirm or question other signals.
How It Adds Value:
Enhanced Visual Analysis: By colour-coding candles based on Bollinger Band positioning, it simplifies the interpretation of market sentiment and volatility, making it easier to spot trends and reversals.
Strategic Decision Making: Helps traders make more informed decisions by clearly highlighting bullish and bearish strength, or lack thereof, in the market.
Time Efficiency: Reduces the time spent analyzing charts by providing an immediate visual representation of market conditions.
Originality: Offers a fresh perspective and an innovative approach to using Bollinger Bands, making it a unique addition to the community's toolbox.
Sublimetrading

PB wTF50What kind of traders/investors are we?
We are trend followers, always on the lookout for the next big move in the market. Our scripts are meticulously crafted for higher timeframes (daily, weekly, monthly) aiming to capture the large market trends.
What does this script do?
The Pb wTF50 script simplifies the complex world of investing by colour-coding bars to indicate the trend direction. Green bars signify a bullish trend, red indicates a bearish trend, and a combination of both signifies a sideways market. This visual representation ensures investors can quickly gauge the market's direction and act accordingly.
How is the PB wTF50 produced?
The PB wTF50 script employs the simple moving averages (SMAs) as its backbone. Bars positioned above both the SMAs turn green, indicating a bullish trend. Conversely, bars below these SMAs turn red, signalling a bearish trend.
What is the best timeframe to use the script?
The PB wTF50 script is designed for the weekly timeframe. This ensures that traders and investors are aligned with the long-term market trend, filtering out the noise of shorter timeframes.
What makes this script unique?
The challenges of identifying the onset, progression, and culmination of trends are well-known in the investing community. The PbF script addresses these challenges head-on.
The PB wTF50 is not a lagging indicator. It is aligned with price movement, which helps investors and traders focus on what the asset’s price is doing. The asset’s price is the primary indicator of its direction.
Lagging indicators can be used alongside the PB wTF50 to confirm the asset’s direction.
The PBwTF50 continues to remain green during extended periods of bullish pullbacks and red during extended periods of bearish pullbacks. This helps investors and traders hold positions during corrections in the market.
When interacting with OB/OS zones, investors and traders are positioned to align with the trend and ignore short-term fluctuations against the trend.
The PB wTF50 can be used to enter additional positions, also known as compounding, when an asset’s price has pulled back into an OS zone, but the trend filter has remained green in a bull trend/OB zone, but the trend filter has remained red in a bear trend.
In essence, the PB wTF50 script is a trend filter that gives investors and traders the ability to apply discretion with the start and end of long-term trends as they develop.

Sublime Trading | Trend Strength FilterWhat kind of traders/investors are we?
We are trend followers. Our scripts are designed to be used on the higher timeframes (weekly/daily) to catch the large moves/trends in the market.
Most have heard of long-term trend following. Few know how to execute the strategy.
Our scripts are designed specifically to identify and invest in long-term market trends.
What does this script do?
Identifying trends is at the heart of sound investing.
This script is colour coded to help identify long-term trends and environments where you will want to consider taking positions.
It is also designed to identify sideways/consolidating markets, environments where you will want to consider standing aside.
How is the trailing stoploss produced?
The script uses two sets of Bollinger Bands, one with setting Standard Deviation 1 and the other with Standard Deviation 2.
These settings help to create 3 zones - Buy, Sell and Stand Aside.
The bars will change colour according to which zone they are in.
The Buy zone is colour-coded green, and when a bull market or the start of a bull trend is in play. The green switches from light green to dark green as the asset’s price moves above the Buy zone.
This switch in colour serves as a warning that a reversal/pullback may occur next from bullish to bearish.
The Sell zone is colour-coded red and when a bear market or the start of a bear trend is in play. The red switches from light red to dark red as the asset’s price moves below the Sell zone.
This switch in colour serves as a warning that a reversal/pullback may occur next from bearish to bullish.
The Stand Aside is confirmed when the colour-code changes to grey. This may not necessarily mean a trend reversal but simply a time to apply patience before a trend continuation.
A sustained mixture of red, green and grey bars confirms a consolidation or sideways market and when investors/traders will want to stand aside and consider another asset.
What is the best timeframe to use the script?
Long-term trends are identified on the daily and weekly timeframes where traders and investors take fewer positions but hold for longer time periods.
We recommend using the script in unison on the weekly and daily timeframes.
When both timeframes fall into the Buy zone and colour-coded green, it signifies a strong bull market.
When both timeframes fall into the Sell zone and colour-coded red, it signifies a strong bear market.
When there is a mixture of green, red and grey bars across the two timeframes, it signifies a sideways market and when investors stand aside and protect their capital.
The weekly timeframe will also help mask the noise on the daily timeframe, allowing you to hold positions longer.
The Trailing Strength Filter script is for investors who want to identify and invest in long-term trends whilst simultaneously eliminating intraday swings.
What makes this script unique?
Identifying the start of long-term trends and then riding out established trends are among the main struggles budding investors face. This script has been coded specifically for the daily and weekly timeframe to:
Seamlessly identify the start, middle and end of trends
Align with the market and remove social media noise calling market tops and bottoms
Allow for discretion when entering but particularly exiting of positions if a market trend has not ended
This trend filter script ensures alignment with long-term market trends.

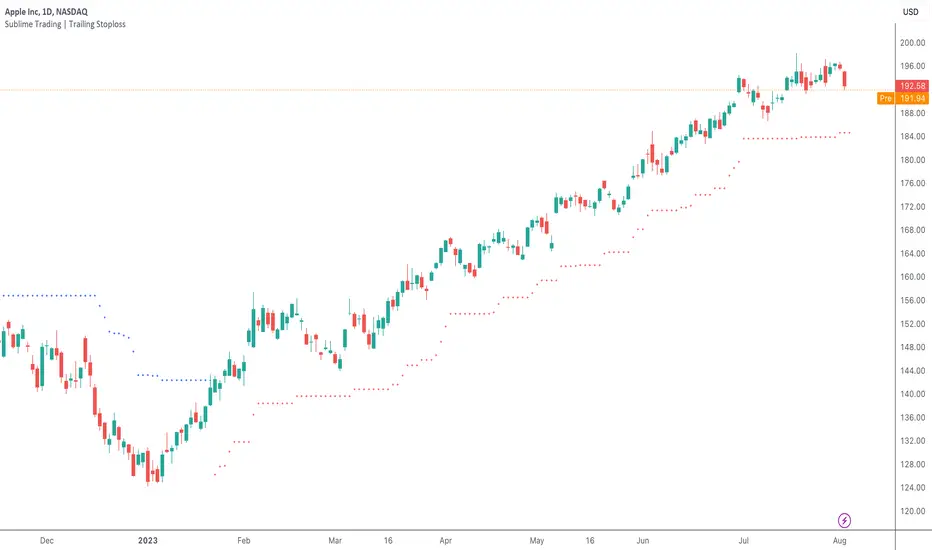
Sublime Trading | Trailing StoplossWhat kind of traders/investors are we?
We are trend followers. Our scripts are designed to be used on the higher timeframes (weekly/daily) to catch the large moves/trends in the market.
Most have heard of long-term trend following. Few know how to execute the strategy.
Our scripts are designed specifically to identify and invest in long-term market trends.
What does this script do?
The exit from a position is arguably more important than the entry.
Traders/Investors will regularly find themselves in an asset based on some logic, but the exit management is very much an afterthought.
Hence why traders often take profit too early and hold onto losing positions. It is emotionally driven.
The Trailing Stoploss script is designed to remove the guesswork and show you precise levels you will want to consider exiting a position when an asset reverses.
How is the trailing stoploss produced?
The script uses the formula ATR 15 x 4.
We use ATR as it produces a stoploss which is unique to the volatility of the asset. The more volatile the asset, the wider the stoploss.
We use ATR 15 as it brings an average reading across half a month, incorporating days of extreme volatility.
The multiplier 4 works well to avoid positions being stopped out prematurely on pullbacks.
When the trailing stoploss is hit, this is where you will want to consider taking profit.
What is the best timeframe to use the script?
We recommend the daily timeframe as this is where trend followers enter assets to maximise the potential of long-term trends.
The higher timeframes are where traders and investors take fewer positions and hold for longer time periods.
The trailing stoploss follows the price of the asset a distance away to give the trend structure enough space and time to develop.
A trend is ultimately a function of time. If you eliminate time, you eliminate the trend. If you eliminate the trend, you eliminate profit.
The Trailing Stoploss script is necessary for investors who appreciate that profit is accumulated by letting winning positions run and not taking profit too early.
What makes this script unique?
Exit management and knowing when to let go of an asset is one of the main struggles budding investors face. This script has been coded specifically for the daily timeframe to:
Create a trailing stoploss that is unique to the volatility of the asset.
Allow investors to stay in positions for the duration of the trend over many months.
To distinguish between a pullback and a market reversal, allowing for discretion.
This TSL script is designed to manage positions investors take in line with long-term market trends.
Sublime Trading | Donchian Breakout SignalsWhat kind of traders/investors are we?
We are trend followers. Our scripts are designed to be used on the higher timeframes (weekly/daily) to catch the large moves/trends in the market.
Most have heard of long-term trend following. Few know how to execute the strategy.
Our scripts are designed specifically to identify and invest in long-term market trends.
What does this script do?
It produces entry signals in a confirmed bull and bear trend.
The logic is based on Donchian 20, which serves the following two purposes:
1. Confirms end-of-day entry points in a long-term trend
2. Filters out entry points in a sideways market
The signal is produced on a break and close of the Donchian 20 high in a bull trend and a break and close of the Donchian 20 low in a bear trend.
How is the entry price produced?
The entry is based on a percentage value of the range of the breakout bar added to the high of the bar in a bull trend.
In a bear trend, the percentage is subtracted from the low of the bar.
This gives an objective entry when placing a position once the OHLC of a bar is confirmed at the end of the trading day.
How is the stoploss price produced?
The script uses the formula ATR 15 x 4.
We use ATR as it produces a stoploss which is unique to the volatility of the asset. The more volatile the asset, the wider the stoploss.
We use ATR 15 as it brings an average reading across half a month, incorporating days of extreme volatility.
The multiplier 4 works well to avoid positions being stopped out prematurely on pullbacks.
When the stoploss is hit, there is when traders and investors may consider exiting positions.
What is the best timeframe to use the script?
We recommend the daily timeframe as this is where trader and investors identify and enter long-term market trends.
The higher timeframes are where traders and investors take fewer positions but hold for longer time periods.
As a result, trend followers place priority on the quality of the entry rather than quantity.
What makes this script unique?
This script has been coded specifically for the daily timeframe to:
Highlight the start of a potential long-term trends.
Confirm entry points at the end of the trading day, absorbing intraday noise.
Reduce fake breakouts in a trend.
Continue to create entry points as the trend develops to allow for compounding.
Filter out breakouts in a sideways market.
This entry signal script helps traders and investors focus on the quality of a potential position when investing in long-term market trends.

LTIThis is a customised indicator which assists us to easily identify strong linear bullish or bearish trends. It gives us the opportunity to enter only the strongest looking trends which results in potentially faster profits.

BoSThis is a customized indicator that helps to confirm and identify breakouts displayed in the form of signals:
The tool can be customised for all pivot strengths
It can be applied on all timeframes but works best on the daily and weekly
A “Buy” signal is displayed when a pivot high is broken
A “Sell” signal is displayed when a pivot low is broken
This tool also helps to identify fake breakouts
