Shinohara Intensity Ratio (SIR)Shinohara Intensity Ratio (SIR) - the indicator
This indicator is used to make clear the intensity of the trend. It shows the possible trend of the price. If the price is in an uptrend or in a downtrend, the indicator shows when you can buy or sell or get out. A good example can be seen in the chart with natural gas, a few days earlier it was already seen that a trend reversal was imminent. Shinohara indicator has already indicated it a few days before.
SIR preset
Period: last 26 periods
Strong ratio: green line "GL"
Weak ratio: red line "RL"
What shows you SIR indicator
It has two lines. The strong ratio line is colored in green and the weak ratio line in red.
When the "GL" is above the "RL", this is the indication of price is an uptrend. When the "RL" is above the "GL", it indicates the price in the downtrend.
The increasing of ratio is the sign of trend intensity is increasing. In the high value of the SIR indicator trend reversal may soon.
SIR indicator line is around 100, this indicating the intensity of the price is average.
SIR line is above 120, the intensity of starting a strong trend
SIR line is above 200 or more this indication of the extreme intensity of the trend
Using Strategy
Buy Signal: "GL" is rising above the 120 and the "RL" is below the 100 level
Sell Signal: "RL" is rising above the 120 level and the "GL" is below 100 level
When the "GL" & "RL" (both lines) are rising above 120 or more then you should avoid taking any position
You can take profit or close your position, if the indicator line moving above the 200 level, then you should alert. If the price trend starts reversing, then you can close your position.
Stocktrading

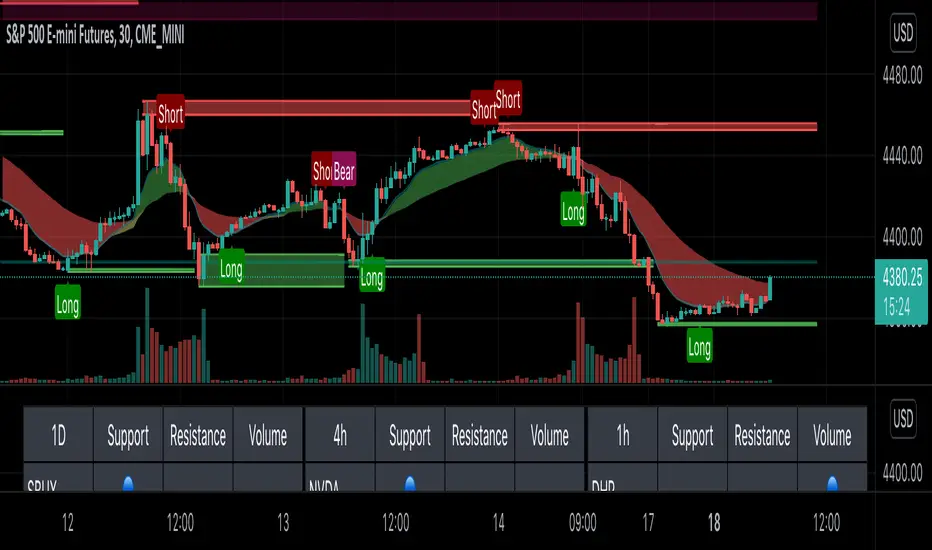
Clutch AlgoThe Clutch Algo provides reversal signals and trend signals. The indicator can be used for stocks, crypto and forex. It can also be used for day trading and swing trading.
Reversal signals were done by modifying the Bollinger Bands and MACD and combining them in a unique way to find explosive price actions. These have been modified to provide signals at the bottom or top of a trend to catch price reversals and to improve margin of safety on trades. These signals are labeled as “Long” and “Short”.
We also added automatic support and resistance zones to increase the accuracy of the “Long” and “Short” signals. This was done by using historical price action of highs and lows and periods of consolidation where price reversed.
The trend signals, which are labeled as “Bull” and “Bear” signals use a combination of exponential moving averages. These signals can be used as trend continuations.
We also added an exponential moving average cloud to help traders easily visualize trend. This can be used as a guide to help you stay in a trade to maximize profits. It can also be used as a guide to get out of a trade if price breaks out of the cloud. The third use of the cloud can be used as support resistance in between high/low support and resistance zones.
Tips:
- Only take long/short signals when there is a support or resistance zone formed at or near the long/short signal, preferably within 1-3 bars of the support or resistance zone. Signals too far from "Long" or "Short" signals reduces your margin of safety.
- When in a Long or Short position, use support or resistance zones as a stop loss level as price is likely to go against the position.
- When taking a Long/Short or Bull/Bear signal, wait for candles to be completed to get best entry possible.
- Previous support zones can be used as resistance zones and previous resistance zones can be used as support zones.
- The support and resistance (SR) period can be adjusted. Numbers in the SR settings are bars looking back. For example, a setting of 10, looks back 10 bars.
[UPRIGHT Trading] Trend Direction Force Index (TDFI)The Trend Direction Force Index, TDFI or TDF Index, is a staple in the Forex community, but is excellent on most asset (i.e. stock) trading.
Developed by Pyotr Wojdyo for metastock trading platform originally, but now on several other.
The idea of the TDFI is that there is enough trend directional force to enter the trade.
How it works:
When the signal is above the high threshold, the trader can go long.
When the signal is below the low threshold, the trader can go short.
It's usually used as confirmation along with another indicator.
Features:
Fully customizable
Built-in color changing
Alerts!
If you like this, you will definitely like what else I've published.
Like, follow, support, etc.
Enjoy.
Cheers,
Mike
(UPRIGHT Trading)

HighLow Box Highlight between EarningsHighLow Box Highlight between Earnings
This is an indicator to highlight area between two earning periods and their highest and lowest points.
It also alternates the highlight color in each subsequent block.
Tested to work in 1D charts and 1M charts
Just drop a message, if you want this further developed with more features.
Note: This was requested by user Meatpye on a forum.

Stock trending strategy This is a long only strategy designed maily for stock markets and futures. In general it works best with 1h, however it can be optimized with other timeframes as well.
Components:
VWAP
MACD histogram
EMA 9
Rules for entry
Long :
For VWAP: close is above the vwap daily
EMA: close is above the moving average
MACD histogram is above 0
Short:
For VWAP: close is belowthe vwap daily
EMA: close is below the moving average
MACD histogram is below 0
Rules for exit
This strategy does not have any risk management inside. Instead it exits whenver it receives an opposite signal form the original one used for entry.
If you have any questions let me know !

The Manager The Manger is a simple and repeatable trade management indicator suite for all instruments and for all timeframes.
The strategy that makes up this trade management tool includes:
1. Average volume calculations with auto lookbacks - Each candle then is identified as being above or below average volume with Dots above or below each candle.
2. Volume Distribution or Accumulation candles - Identifies if the candle has higher or lower volume compared to previous candle
a. If Higher volume and is a Down candle it is a distribution candle and is coloured Red.
b. If Higher volume and is an Up candles it is an accumulation candle and is coloured Green.
3. Adjustable BIAS cloud with four settings for Day Trading and Swing Trading. Red is Bearish BIAS with Price action and Green is a Bullish BIAS with Price Action.
Some of the simple rules to follow when using "The Manager" to help manage your trades Long or Short. (More is covered in our tutorial video)
1. When Short Trading and you get a Green Accumulation Candle with a Cyan Dot Above candle (Higher than Average Volume) printed. This is a sign of a potential reversal against your short trade and an aggressive profit taking exit is necessary.
2. When Long Trading and you get a Red Distribution Candle with a Cyan Dot Above candle (Higher than Average Volume) printed. This is a sign of a potential reversal against your long trade and an aggressive profit taking exit is necessary.
3. Pullbacks against the direction of your trade with Blue Dots Below Candles (Lower than average volume) show low momentum pullbacks and a sign to stay in your trade or revert to BIAS Cloud rules.
4. BIAS Cloud - When Green Changes to Red, this is your conservative exit for Long Trades. - When Red changes to Green, this is your conservative exit for short trade.
5. BIAS Cloud - When day trading and your position has a parabolic move - change settings to day trading aggressive
6. BIAS Cloud - When Swing trading and your position has a parabolic move - change settings to day trading conservative or moderate depending on how much room you want to give for a pullback against the direction of your swing trade.
Remember when day trading or swing trading, there is usually a data or news catalyst that reverses the direction of an instrument and potentially a trade that you are in. "The Manager" soon spots those with either accumulation or distribution candles combining with higher than average volume. And usually with a distinct candle stick formation rejecting highs or lows. The ability for you to visually see this on your chart with our indicator gives you chance to maximise your profits by understanding the behaviour represented by the coloured candles and the dots above or below the candles. The BIAS cloud allows for a more conservative approach to this as discussed above

Stock StrategyStock holding trading strategy based on base breakout. It should be combined with the analysis of the fundamental factors of the stock to choose the stock with the best signal.
Example using 10 contract size with ADP, and commission per order is 0.1% with actual capital of 10000$, you can adjust other contract size for other stocks to be consistent with reality.

Crypto Fox Alert of Ann Strategy No RepaintHello traders
This is (( sirolf's ANN Indicator)) i updated it to (( No Repaint Version )) and it still have very good results
The new in strategy : -
1 - The Indicatoris no repaint now in any time frame
2- Now Indicatorhave two time frames which make you control strategy in entry and exit positions and you can change it as you want .
3- I recommended so much working in 5 min time frame and 15 min time frame to get the best results
but in the same time the Indicator is working in all time frames this just my advice for traders
4- I recommend so much using take profit and stop loss to avoid huge movements in markets
Notes.
--This Indicator Never Ever Repaint so it based on no repaint parameters.
--When using this alert you must notice this points :
1 - when you but the alert in the chart you will get this message :
( this indicator may be repaint ) and this for using time frame but this normal and dont worry of that
the indicator will never repaint .
2 - ( BUY) this the choice for enter long position .
3 - ( SELL) this the second choice you can use it to enter short position or exit long position .
4 - ( per bar close ) you must always use this option in alert conditions page .

Crypto Fox ANN Strategy No RepaintHello traders
This is (( sirolf's ANN Strategy )) i updated it to (( No Repaint Version )) and it still have very good results
The new in strategy : -
1 - The strategy is no repaint now in any time frame
2- Now Strategy have two time frames which make you control strategy in entry and exit positions and you can change it as you want .
3 - Added Back Test range to check Back test results
4 - Strategy is working in 10 % of equity and you can change it as you want .
5- I recommended so much working in 5 min time frame and 15 min time frame to get the best results
but in the same time the strategy is working in all time frames this just my advice for traders
6- I recommend so much using take profit and stop loss to avoid huge movements in markets

ALERT OF CRYPTOOOFOX (Scalping System)---DESCRIPTION---
How Indicator Work :
--This Indicator is for scalping and also using confirmation when higher > highest time frame .
--The main indicator in this strategy is built on movement high and low so this indicator is belong to
the chart price and movement and you can make profit in any chart as you want
--Indicator is working on higher time frame so i use two high time frames .
the higher is ( 8 H ) and the highest is ( Daily ) Time frame .
-- When the higher time frame cross over the Daily time frame( the Highest ) this mean
the TREND and the PRICE also going UP this strategy is going to start working between the high and low buy in low .
-- When the higher time frame cross under Daily time frame( the Highest ) this mean the TREND and
the PRICE also going down and it will sell in high ( close position ) .
--Indicator is working only in Long position i am not recommend to use it in short positions .
--THIS IS NO REPAINT INDICATOR.
--I recommend so mush to use 5 min time frame for low draw down
--I recommend so mush to use take profit and stop loss although the low draw down but some time
the market have a huge movements .
--This Indicator have setting of movement for every chart and every price and movement so i will
comment the settings for every chart in forex and crypto and also stock markets

CRYPTOOOFOX (Scalping System)---DESCRIPTION---
How Strategy Work :
--This strategy is for scalping and also using confirmation when higher > highest time frame .
--The main indicator in this strategy is built on movement high and low so this indicator is belong to
the chart price and movement and you can make profit in any chart as you want
--Strategy is working on higher time frame so i use two high time frames .
the higher is ( 8 H ) and the highest is ( Daily ) Time frame .
-- When the higher time frame cross over the Daily time frame( the Highest ) this mean
the TREND and the PRICE also going UP this strategy is going to start working between the high and low buy in low .
-- When the higher time frame cross under Daily time frame( the Highest ) this mean the TREND and
the PRICE also going down and it will sell in high ( close position ) .
--Strategy is working only in Long position i am not recommend to use it in short positions .
--THIS IS NO REPAINT STRATEGY .
--This strategy is working in 10 % of equity and you can change it as you want .
--I recommend so mush to use 5 min time frame for low draw down
--I recommend so mush to use take profit and stop loss although the low draw down but some time
the market have a huge movements .
--This strategy have setting of movement for every chart and every price and movement so i will
comment the settings for every chart in forex and crypto and also stock markets

PpSignal Koncorde By Inversiones en el MundoHow does the market work?
The market is moved by two types of investors, those called strong hands or sharks (agencies, funds, companies, banks, etc.) and weak hands or minnows (that is, us).
Minnows do not have the ability to manipulate a security, since our portfolio is limited, but we can enter and exit securities easily since we do not have much money.
Sharks can manipulate a security since they have a lot of shares and / or money, however, they cannot move easily since selling or buying such amount of money is very difficult for them.
So what can sharks do to buy or sell their shares? Well, he plays his game: Trying to make us believe that the company is cheap when they want to sell us their shares or make us believe that the company is expensive when they want to buy our shares. This manipulation is done in many ways, most of them through press news.
We, the minnows, cannot compete against the sharks, but we can find out what they are plotting (remember that they are slow moving their monstrous amounts of money) to get under them and imitate them. Better to be under the shark than in front of it.
How does Koncorde work?
Well, we already know how we should operate, but how do I know what the sharks are doing? Well, here the Koncorde indicator comes into play.
This indicator is made up of 6 indicators. 4 trend and 2 volume. The 2 for volume are the IVP (positive volume index) and the IVN (negative volume index). These two indicators are the interesting ones since they are programmed to proportionally attribute the volume traded between the strong hands (sharks) and the weak hands (minnows). To explain how the IVP and IVN work I will write a post since it is very interesting, but for this post, stay with what they do. Koncorde uses volume, therefore it cannot be used in Forex.
As for which temporality to use, the bigger the better, since at the end of the day what we are doing is data analysis and therefore the more data the better. I personally use it in daily candles.
And all this, how is it represented in the indicator? Its graphic representation consists of three overlapping layers and a red line.
Signal: Average represented with a red line
Mountain: It is the brown layer that indicates the price trend
Prado: It is the green layer that attributes the purchases or sales of the weak hands (the minnows)
Water: It is the blue layer that attributes the purchases or sales of strong hands (sharks)
When strong hands are below zero they are said to be selling while when they are above zero they are said to be buying. The same goes for weak hands. Generally, if strong hands are buying or selling, the price is lateralized (the Atlas indicator is very useful for this). The price movement is associated with the buying and selling that makes the hand weak.
Koncorde indicator at a glance shows us a lot of information
Meaning of each zone:
Blue area: strong hand. If it is positive it indicates accumulation and if it is negative distribution.
Green area: weak hand. If it is positive it indicates a purchase and if it is negative it indicates a sale.
Brown area: Indicates the trend and depends on the previous strong and weak hand values.
Red line: It is an exponential average that smoothes the trend indicated by the brown area.
Simple operating example:
Buy: When the mountain rises above the red line.
Sell: When Mountain goes below the red line.
This would be for long. To enter shorts would be the other way around.
thank to:

© 2021 - SwingSwiss - BUY/SELL© 2021 - Dan Chetrit - BUY/SELL"
Product Description:
The Indicator combines the Relative Strength Index, Moving Average Convergence Divergence as well as Volume and Stochastic.
The idea is to cross multiple data and signals from these indicators in order to trigger buy when crossing above and sell when crossing below the signal line.
The idea was also to find a mathematical function that will trade the convergence of these lines trying to predict the market.
This indicator works better on a daily chart.
The indicator works long and short but is better for long positions.
The script also includes an EMA 50 line as well as an overbought/oversold RSI background.
The indicator can be used on every type of market: indices, stocks, cryptocurrencies, currencies, and others but, according to backtesting, it works better for the US stock market.
This study is not a guaranteed profit. You should backtest or trade virtual money before using this study on your real portfolio, as it is intended to be a tool. Do your research and learn about the company you are investing in.
Disclaimer:
Trading and investing in the financial markets involves substantial risk of loss and is not suitable for every investor.
All trading strategies are used at your own risk.
Please send me a private message or comment on TradingView to gain access to the script.

MACD Bull Crossover and RSI Oversold - AlertsHello everyone, these are the alerts for my previous "MACD Bull Crossover and RSI Oversold" Long Strategy. This version currently does not support stoploss and takeprofit alerts but the next update will.
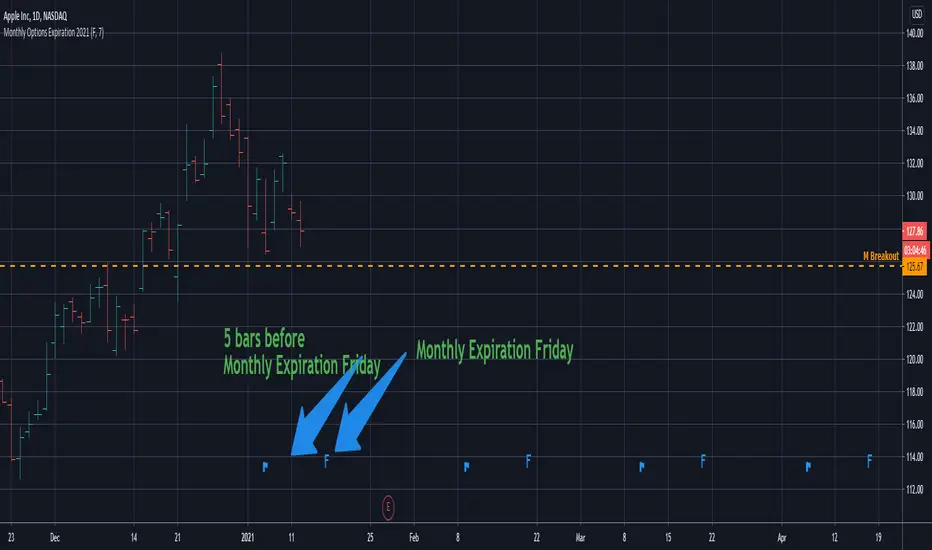
Monthly Options Expiration 2021Monthly options expiration for the year 2021.
Also you can set a flag X no. of days before the expiration date. I use it at as marker to take off existing positions in expiration week or roll to next expiration date or to place new trades.
Happy new year 2021 in advance and all the best traders.
PpSignal Momentum TraderThis is a combination of the PERCENTAGE of PRICE OSCILLATOR (PPO) and Momentum.
When both oscillators are up in the same direction it is buying (green bottom and green oscillators), when both oscillators are down it is sell (red bottom and red oscillators. When they do not agree (silver bottom) it is to keep doing nothing .
You can also see the change in trend with the candles as well. same colors as the background and the oscillators.

MACD with 3 strategiesMACD WITH 3 STRATEGIES
- Macd line change colour when cross the signal line
- Background Color change colour based on a moving average, on settings the value of the moving average can be changed 50,100,150,200
- Strategy one based on Macd lines with bar changing colours
- Strategy two based on Macd lines but with a different method
- Strategy three based on two other trending indicators
This indicator can be used to spot trends and changing of direction of the market and with the bar coloured its easier to identify them.
The strategy one can be used as confirmation of a trend or as changing direction integrated with other indicators like Rsi , Stochastic, Supertrend , Bollinger band, with ema option mode works better.
The strategy two can be use together with the back ground colour: When is red and the candles are red can be identified as strong drown trend.
When is green and the candles are green can be identified as strong up trend.
The strategy three can be used after checked the strategy two for more confirmation for a trend.
VERY IMPORTANT WHEN YOU TRY A NEW STRATEGY TEST IT IN A DEMO ACCOUNT FOR AT LEAST 3 MONTHS
Every donations will be devolved to cancer research and you ll have one month free trial.
If you want to purchase this indicator 30% will be devolved to cancer research.
Please leave a comment or message me if you want you have two weeks trial.
Enjoy!
Long only strategy VWAP with BB and Golden Cross EMA50/200
This is strategy, mainly designed for stock markets
It makes uses of the EMA 50/ 200 ( Golden cross) and VWAP and Bollinger bands.
It only takes long positions. It can be adapted to all time frames, but preferably to be used with longer timeframes 1h +
The rules for entry are the next ones :
1. EMA50 > EMA 200
2. if current close > vwap session value
3. check if price dipped BB lower band for any of last 10 candles
EXIT RULE
1. price closes above BB upper
STOP LOSS EXIT
1. As configured --- default is set to 1%

PPSIGNAL fibo trade patrones armonicos with Back test v2.1here we have the Ppsignal Fibo Trade with harmonic patterns.
When the system finds a harmonic pattern either from the current time frame or a higher one, it depends on the setting you set, you will buy or sell depending on the harmonic pattern it detects.
Please note prior to use read about harmonic pattern formation

4 Pattern Software4 Pattern Software
With well over 20 years of trading and investing experience, combined with my 10 years plus of coding strategies and indicators, I learned many years ago that there are 4 Patterns that are more reliable for picking the correct entries on Stocks, Commodities, Forex and Cryptocurrencies than any others. I thought it would be best to create software that scans the entire stock market, each day, to quickly and easily identify these specific patterns.
In the picture above the software is showing the ranges and support and resistance levels on BTCUSD. There are other various indicators on this chart that show when price is overextended, volume spikes and trend changes.
The Nasdaq is showing an overextended support pattern. It also is highlighting the next levels of support and resistance levels.
In the above picture the software is telling us that the market is going sideways and to stay out for now. Once price breaks out of the ranges the blue will disappear.
Once price broke out of the range it is now showing us one of the 4 patterns that we are looking for. It is also showing the red line resistance that needs to be broken before it is wise to look for an entry.

PpSignal Ehlers Deviation Scaled Moving AverageThe DSMA by John Ehlers is an adaptive moving average that features rapid adaptation to volatility in price movement. It accomplishes this adaptation by modifying the alpha term of an EMA by the amplitude of an oscillator scaled in standard deviations from the mean
When the color Is blue buy.
Red sell.

PpSignal Impulse MACD The Elder MACD Impulse (IMCAD) System is a combination of momentum and trend.
when IMACD is flat the market is accumulating.
There are two MACDs, one white short IMACD and a larger one that changes color long MACD.
Bu y when white IMCAD short is above 0 IMCAD Long is also above 0.
Sell when white IMCAD short is below 0 and IMCD long is also below 0.
Find divergence: You can also look for divergences to detect a change in trend
I do not use it as the sole indicator, of course, but it is a good complement to detect differences, and it also helps the automatic detector thereof

Stock Breakout Algo by Technicaltrader615This is a Breakout Algo Suited for trading Stocks in NSE ( India) . The code looks for breakout above yesterday high and low with respect to the pivot R1 and S1. The order pings as Bracket order with 2R as target and 1R as risk. Time frame to be used is 5 mins.
We need to feed stocks with narrow range prior day for better performance.
You need to define risk in the Bridge for Each of the Stock. Lets say the stop loss is 10 points and Risk is 1000. The bridge will ping 1000/10 = 100 Shares to buy/ sell with 2R as target. the Target can be set to 3R also . This some times get rejected as Indian Stock exchange has upper circuit limit set. So we can go for 2R for ill-liquid stoks and 3R for liquid Stocks.
Similarly if 1000 Rs risk and 50 points sl , the bridge will place 1000/50 = 20 Share qty.
Breakout / Breakdown candles are Denoted by Colour change in the chart for visual purpose.
For more Details you can contact thru trading view chat window. You can also scroll down for my signature. This is only for the Students of Mine.
