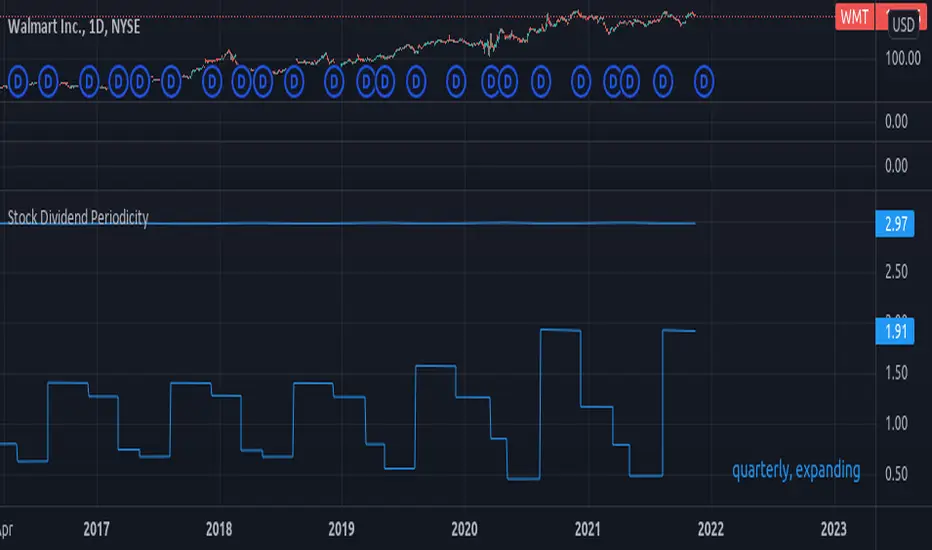
Diluted Earnings Per Share Signal [AstrideUnicorn]Earnings Per Share (EPS) is a financial metric closely monitored by investors. The so-called "positive earnings surprise" - a situation when EPS reading for a stock beats the value forecasted by analysts gives a bullish signal for this stock. The EPS reading lower than the analysts' estimate gives a bearish signal.
The Diluted Earnings Per Share (Diluted EPS) metric calculates a company's potential earnings per share value in the case if all convertible securities get converted to common shares. Convertible securities include preferred shares, stock options, warrants, convertible debt, etc. Diluted EPS is a more scientific way to estimate earnings per share, and it is usually lower than the ordinary EPS.
The Diluted EPS Signal indicator (DEPSS) is a fundamental indicator that calculates trading signals by comparing the Diluted EPS to the EPS Estimate. In many cases, Diluted EPS gives better insight into how a reported EPS reading may impact the stock price.
HOW TO USE
For each earnings date, the indicator calculates the Diluted Earnings Surprise percentage value :
Diluted Earnings Surprise = (Diluted EPS - EPS Estimate)/ EPS Estimate.
Diluted Earnings Surprise higher than the specified threshold value is a bullish signal. In this case, the indicator displays a green triangle pointing up.
Diluted Earnings Surprise lower than the specified threshold value is a bearish signal displayed as a red triangle pointing down.
As one can see on the chart, there are a lot of situations where EPS readings with green labels (the ones that beat analysts' estimates) lead to down moves. The DEPSS indicator can spot weak earnings and give opposite signals.
SETTINGS
Earnings Surprise Threshold (%) : the threshold value (in percentage units) for the Diluted Earnings Surprise. The calculated Diluted Earnings Surprise must be higher than Earnings Surprise Threshold to be considered a BUY signal or lower than minus Earnings Surprise Threshold to be considered a SELL signal. The default value for Earnings Surprise Threshold is 20%.
Ações

Contrarian Scalping Counter Trend Bb Envelope Adx and StochasticContrarian Scalping is an trading strategy designed to take advanted of a counter-trend.
The advantage of these strrategies types is that they have a good profitability but with do not great gain (in relation at the time frame).
Indicators used:
Bollinger
Envelope
ADX
Stochastic
Rules for entry
For short: close of the price is above upper band from bb and envelope, adx is below 30 and stochastic is above 50
For long: close of the price is below lower band from bb and envelope, adx is below 30 and stochastic is below 50
Rules for exit
For short: either close of the candle is below lower band of bb or enveloper or stochastic is below 50
For long: either close o the candle is above upper band of bb or envelope or stochastic is above 50
If there are any questions let me know !

Triple CSWhat this indicator does:
This indicator will be scanning for ranges of extremity.
It measures multiple underlying factors in the financial markets like measuring levels of strength using RSI, momentum using Stochastics and extreme ranges using Bollinger Bands.
What is "extreme range" criteria: ranges above 70 or below 30 on RSI and Stoch are considered extreme, as well as moments of extreme volatility exceeding overbought and oversold levels on BBs.
All monitored data is to be plotted in a horizontal row, providing information about oversold, overbought and mid-range market conditions. This data will either meet the criteria simultaneously and plot a Red or Green indication or it will miss one or more requirements, plotting Gray indications.
This indicator is a real-time indicator, meaning it's updating live and due to this tracking in real-time, indications not yet 'printed' can give false readings. For performance purposes, it is best practice to allow all indication plots to 'print', meaning if a plot ever changes in color, it's best to allow that candle to fully close , ticking to 0:00 before confirming the accuracy of the indicator's findings.
How it works:
This indicator scans multiple sources of data simultaneously. When appropriate conditions within a trading range are met, the indicator will update it's color.
The indicator will plot Gray , Green , and Red indications which can be explained below.
-
Grey plots : No indication of full extremity, meaning one or more conditions being tracked has not met requirements, suggesting price is likely in mid-range.
-
Green plots : Extremity level lows have been simultaneously met, data indicates extreme oversold conditions are likely present.
-
Red plots : Extremity level highs have been simultaneously met, data indicates extreme overbought conditions are likely present.
What market will this indicator work on?
Stocks > Forex > Crypto
All the above are supported by this indicator.
Charts with more history have more data for the indicator to utilize. (Lack of data can result in poor performance.)
- This indicator performs best on 4H, 12H, D, and W timeframes, although you can use this indicator on any timeframe TradingView supports.
This indicator was created to find ranges of extreme trade which can help traders be more confident in their timing with the market.
Trading can be difficult, let an algorithm scan the market and monitor for early signs of volatility changes.
Past performance does not guarantee future results. Please do your due diligence when placing trades.

RSI Average Swing BotThis is a modified RSI version using as a source a big length(50 candles) and an average of all types of sources for candle calculations such as ohlc4, close, high, open, hlc3 and hl2.
In this case we are going to use a 0-1 scale for an easier calculation, where 0.5 is going to be our middle point.
Above 0.5 we consider a bullish possibility.
Below 0.5 we consider a bearish possibility.
I made a small example bot using that initial logic, together with 2 exit points for long or short positions.
If there are any questions, let me know !

Trendalix EntriesThis script is made to simplify the analysis of trends. It changes the mas based on whether you're looking at stocks or crypto. As these 2 markets currently move differently, they need a slightly different approach.
Crypto trends:
Can move much faster than stocks. Ideally the price should be bouncing above the williams alligators (about the 20-30 MAs).
Stocks:
These swing more than crypto so you need to get deep into these swing to be buying at the bottom of a move. The MAs are much larger, between the 50ma and 400ma. It's much more important here that the slower MAs are strong, i.e 200ma is above the 400ma, than it is that the faster MAs are okay.
For stocks an entry and stop line is drawn. These are only visible when the market is sufficiently in a pullback.

Smart Swing Strategy for StockSpecial indicator for stock but you can try another instrument.
Trend determination and buy/sell signals are using the Alligator system from Bill Williams .
To get maximum profit, the system uses the trailing stop technique using Average True Range (ATR) with 4 moving average options (RMA, SMA , EMA , WMA ).
Please leave comments if any opinions.
Disclaimer
The content is in any event provided with the intention of being for general circulation and availability only. As such it is not intended to and does not form part of any offer or recommendation directed at you specifically, or have any regard to your investment objectives, financial situation, or needs of yourself or any other specific person. Before committing to a trade or investment, please seek advice from financial or other professional advisers regarding the suitability of the trade for you. If you do not wish to seek such financial advice, please consider carefully whether the product is suitable for you as you alone remain responsible for your trading gains and losses.

Swing Multi Moving Averages Crypto and Stocks StrategySimple and efficient multi moving average strategy combined with risk management and time condition.
Indicators/ Tools used
Multi selection moving average type like SMA , EMA , SMMA , VWMA , VIDYA , FRAMA , T3 and much more
Limit 1 entry max per week, entry on monday exit on sunday or risk management tp/sl.
Rules for entry:
LONG:Close of the candle cross above the moving average while the previous close was below. All of this is happening during monday session.
SHORT:Close of the candle cross below the moving average while the previous close was above. All of this is happening during monday session.
Rules for exit:
We exit either on sunday or if we reach tp/sl levels.
Observations:
I recommend use the strategy 2 types, one for long and another for short, using different parameters since long and short movements behave differently.
For example for long we can use a shorter moving average longth and a higher tp/sl while for short we can use a bigger moving average length and a smaller tp/sl
If you have any questions let me know !

Swing VWAP Crypto and Stocks StrategyThis is a strategy designed for swing trading on markets such as crypto and stocks.
Its components are:
VWAP
Time Management
Risk management
Rules for entry:
We entry only on Monday, if our close of the candle crossed above VWAP
Rules for exit
We exit always on Sunday or if we either hit the TP/SL levels.
If you have any questions let me know

Stock Dividend Periodicityexperimental:
a basic method to evaluate stock dividend periodicity.
known issues:
* it does not adapt well to changes in periodicity, if there is a big enough change on the dividend period plan.
RSI Rising Crypto Trending AlertAlert version of the strategy with the same name
This is crypto and stock market trending strategy designed for long timeframes such as 4h+
From my tests it looks like it works better to trade crypto against crypto than trading against fiat.
Indicators used:
RSI for rising/falling of the trend
BB sidemarket
ROC sidemarket
Rules for entry
For long: RSI values are rising, and bb and roc tells us we are not in a sidemarket
For long: RSI values are falling, and bb and roc tells us we are not in a sidemarket
Rules for exit
We exit when we receive an opposite direction.
Cuation: Because this strategy uses no risk management, I recommend you takje care with it.
If you have any questions, let me know !

Scalping Trading System ALERT Crypto and StocksThis is the alert version of the strategy with the same name.
Indicators
SImple Moving Average
Exponential Moving Average
Keltner Channels
MACD Histogram
Stochastics
Rules for entry
long= Close of the candle bigger than both moving averages and close of the candle is between the top and bot levels from Keltner . At the same time the macd histogram is negative and stochastic is below 50.
short= Close of the candle smaller than both moving averages and close of the candle is between the top and bot levels from Keltner . At the same time the macd histogram is positive and stochastic is above 50.
Rules for exit
We exit when we meet an opposite reverse order.
This strategy has no risk management inside, so use it with caution !

Scalping Trading System bot Crypto and StocksThis is a trend trading strategy scalping bot that can work with any type of market. However I concluded my tests so far with Crypto, Stocks and Forex, and with optimizations always could be found some profitable settings.
Indicators
SImple Moving Average
Exponential Moving Average
Keltner Channels
MACD Histogram
Stochastics
Rules for entry
long= Close of the candle bigger than both moving averages and close of the candle is between the top and bot levels from Keltner. At the same time the macd histogram is negative and stochastic is below 50.
short= Close of the candle smaller than both moving averages and close of the candle is between the top and bot levels from Keltner. At the same time the macd histogram is positive and stochastic is above 50.
Rules for exit
We exit when we meet an opposite reverse order.
This strategy has no risk management inside, so use it with caution !

[astropark] Trend Skywalker V2 [alarms]Dear Followers,
today I'm glad to present you Trend Skywalker V2 , the evolution of Trend Skywalker V1 indicator that you can see here below:
This indicator works on every timeframe and market, it's quite responsive to market movements, so it's especially good on volatile markets.
In this new version you have 3 trend clouds available :
a short-term one (yellow)
a mid-term one (green)
a long-term one (blue)
You can also enable an option to show all trend clouds as one, the result will be similar to a special bollinger bands tool.
Of course you can edit trend clouds analysis period and color, also you can turn on or off the cloud that you prefer.
The indicator can run 4 different kinds of strategy : one for each trend cloud individually or a mixed one.
Also the indicator tracks for you a peak profit from entry: this tracker is a suggestion for you to take profits while price goes up!
All red-green circles you see in the chart is a reminder that a peak profit label was there in the past: what does this tell you?
if price starts losing the short-term trend and you had a lot of TP suggestions, maybe trend ended and you should start consider closing your trade before you give back all your profit.
This indicator will let you set alerts on each buy/sell/close/tp label.
For backtesting, you can use the indicator here below:
This is a premium indicator , so send me a private message in order to get access to this script.

[astropark] Trend Skywalker V2 [strategy]Dear Followers,
today I'm glad to present you Trend Skywalker V2 , the evolution of Trend Skywalker V1 indicator that you can see here below:
This indicator works on every timeframe and market, it's quite responsive to market movements, so it's especially good on volatile markets.
In this new version you have 3 trend clouds available :
a short-term one (yellow)
a mid-term one (green)
a long-term one (blue)
You can also enable an option to show all trend clouds as one, the result will be similar to a special bollinger bands tool.
Of course you can edit trend clouds analysis period and color, also you can turn on or off the cloud that you prefer.
The indicator can run 4 different kinds of strategy : one for each trend cloud individually or a mixed one.
Also the indicator tracks for you a peak profit from entry: this tracker is a suggestion for you to take profits while price goes up!
All red-green circles you see in the chart is a reminder that a peak profit label was there in the past: what does this tell you?
if price starts losing the short-term trend and you had a lot of TP suggestions, maybe trend ended and you should start consider closing your trade before you give back all your profit.
On backtesting you can you test long and short setups individually or both, as well as performance in a specific time window.
This is a premium indicator , so send me a private message in order to get access to this script.

Daily HIGH/LOW strategyThis is a DAILY High/LOW strategy combined with a moving average and volume for more accuracy.
The rules are simple :
For long if we had a cross of the high with the previous high and close of the candle is above moving average and chaikin money flow volume is positive we have a long entry.
We exit when we cross down the moving average with the close of the candle.
For short if we had a crossdown of the low with the previous low and close of the candle is below moving average and chaikin money flow volume is negative we have a short entry.
We exit when we cross above the moving average with the close of the candle.
This strategy has no risk management inside so use it with caution.
If you have any questions, let me know

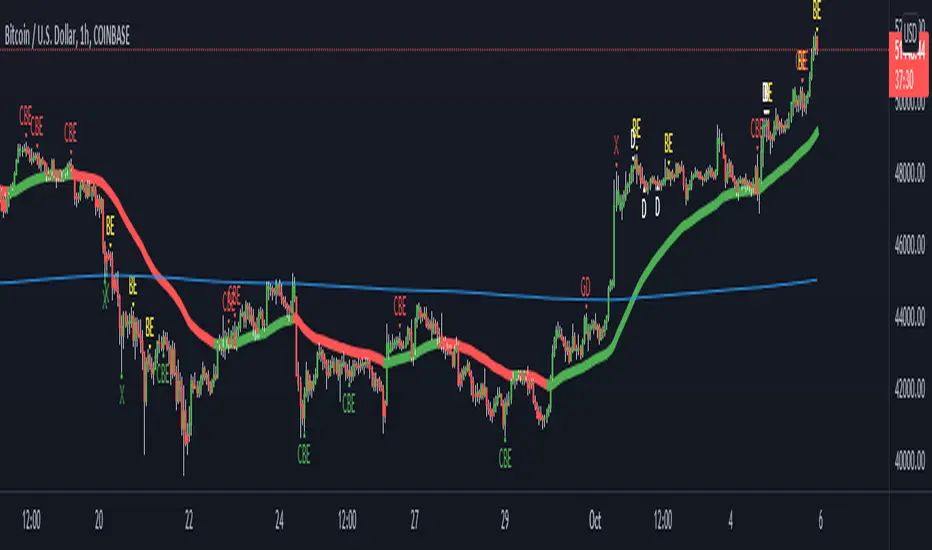
Godson CandleScript Symposium This script is a party of every useful trading indicator i believe in.
The primary signals are candlescript analyses
in order of most useful
CBE: Complete Bullish/Bearish Engulfing
DF/GD: These are Dragonfly and Gravestone Doji's but they also signal Harami's
BE: Bullish/Bearish Engulfing
H: Actual Harami's (these are mean't to be pre-emptive Hedge signals)
D: basic Dojis
these are also two Moving Averages
1Hr ema and 1D ema
doesn't have to be 1Hr/1D but that's the default.
you have 3 choices
A: show all signals
B: only show counter signals(these are bullish signals in a bear market; as defined by price under 1D, and vice versa), this exists for picking bottoms or counter-trend scalping.
C: only show pro trend signals(the trend is your fren... as they say)
only signals that appear 3% away from the mean(1hr ema) are shown, you can change this.
there are also signals that are meant for buying dips and selling rips, these appear when the price action significantly increases the STDEV and the price is far from the mean.
these settings can also be changed
green X: Local Bottom
red X: Locap top
candlecolor if turned on changes the color of the candle when Heiken Ashi open is the High(red) or low(green)
if you want your charts to look exactly like mine, turn off candle body, change wick colors to white and make background gridline 100% transparent.
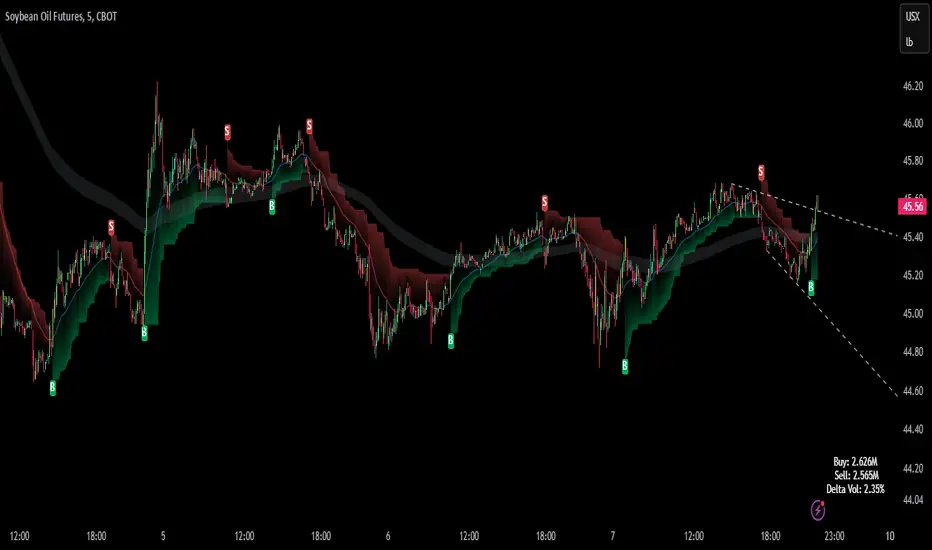
SMART4TRADER-US STOCKSThe indicator is intended to evaluate the stock market , as it takes into account the data on the BUY and SELL of all US shares. In the indicator, you can select various methods for providing data.
Priority = (BUY - SELL) with a intraday cumulative effect.
Ratio = (BUY / SELL) with a intraday cumulative effect.
Delta = (BUY - SELL) on each candle.
Volume = (BUY + SELL) on each candle.
Cumulative = (BUY - SELL) with cumulative for all available history.
------------------------------
Индикатор предназначен для оценки фондового рынка , так как в себе учитывает данные о покупка и продажах всех акций США. В индикаторе можно выбрать различные методы предоставления данных.
PRIORITY = (BUY - SELL) с накопительным эффектом внутри дня.
RATIO= (BUY / SELL) с накопительным эффектом внутри дня.
DELTA= (BUY - SELL) на каждой свече.
VOLUME= (BUY + SELL) на каждой свече.
CUMULATIVE= (BUY - SELL) с накопительным за всю доступную историю на графике.

GoldenCO Aie3Use of GCOv3 strategy for market analysis
This gco3 strategy uses exponential moving average analysis which is 5emas to show the movement of stock prices in the market. It is also to track the impending changes to the market price. the use of EMA is more sensitive to trend changes and it is one way to see the trend of price movements and as a guide to the trader.
The parameters used are EMA5/EMA20/EMA50/EMA100/EMA200.
The above parameters indicate a price condition that includes 4 phases of the price trend, namely the accumulation, uptrend, distribution, and ddowntrend phases.
we hope that, by recognizing and knowing the trend of this price movement it can help traders in trading activities well and can reduce risk. May it benefit the trader.
DISCLAIMER ; This is not Buy/Sell call, Just analysis idea for education. Trade At Your Own Risk
Average Highest High and Lowest Low Swinger StrategyThis is a full price action strategy designed for trending markets such as crypto and stocks.
Its purely made on calculations for the highest high and lowest low using 2 different length , a faster and a slower one.
With those we make multiple averages.
Rules for entry:
For long: our close of the candle is above both the average using fast and slow line
For short: our close of the candle is below both the average using fast and slow line
Rules for exit
We always exit when we have an opposite order
Caution
This strategy use no risk management system, so be careful with it
If you have any questions, let me know

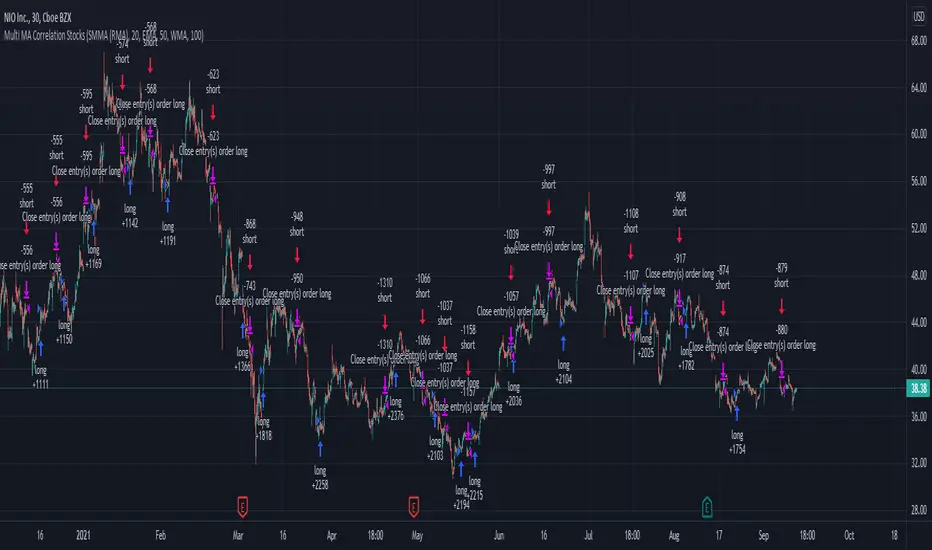
Swing Stock Market Multi MA Correlation This is a swing strategy adapted to stock market using correlation with either SP500 or Nasdaq, so its best to trade stocks from this region.
Its components are
Correlation Candle
Fast moving average to choose from SMA , EMA , SMMA (RMA), WMA and VWMA
Medium moving Average to choose from SMA , EMA , SMMA (RMA), WMA and VWMA
Slow moving average to choose from SMA , EMA , SMMA (RMA), WMA and VWMA
Rules for entry
Long: fast ma > medium ma and medium ma > slow ma
Short: fast ma< medium ma and medium ma < slow ma.
Rules for exit
We exit when we receive an inverse condition.
Caution:
This strategy use no risk management inside, so be careful with it .
If you have any questions, let me know !
Trend System Oscillator Averages RatingThis is a trend system made with multiple oscillator averages designed especially for trending markets such as stocks or crypto.
It can be used with any timeframe.
Its made of multiple moving oscillators such as
RSI
Stochastic
ADX
CCI
AO
MACD
MOM
STOCH RSI
WPR
BP
UO
Avg of all oscillators
It has also a rating, making an avg from all of the oscillators , going from -100 (all ma's are telling to go short ) to 100 ( all ma are telling to go long).
If you have any questions let me know !

Trend System Multiple Moving Averages RatingThis is a trend system made with multiple moving averages designed especially for trending markets such as stocks or crypto.
It can be used with any timeframe.
Its made of multiple moving averages such as
Simple
Weighted
Volume Weighted
Exponential
Double EMA
Arnaud Legoux
Hull MA
Smoothed
Least Squares
Kaufman Adaptive
Triple EMA
Zero Lag
Fractal Adaptive
Variable Index Dynamic Average
Jurik Moving Average
Tillson
Triangular
Avg of all moving averages
It has also a rating, making an avg from all of the moving averages , going from -100 (all ma's are telling to go short ) to 100 ( all ma are telling to go long).
If you have any questions let me know !

Improved Bollinger Swing Strategy Stock NasdaqThis is an improved bollinger band strategy adapted to Nasdaq Index/Stocks.
The new update include a multiple logic calculation BB adapted for long and short, together with a risk management using movement in %.
Rules for entry
For long we have a crossover between the close and the lower band from the bb
For long we have a crossover between the close and the upper band from the bb
Rules for exit
We exit when we either find a reverse condition, or if we hit the take profit/stop loss levels.
If you have any questions, let me know !
