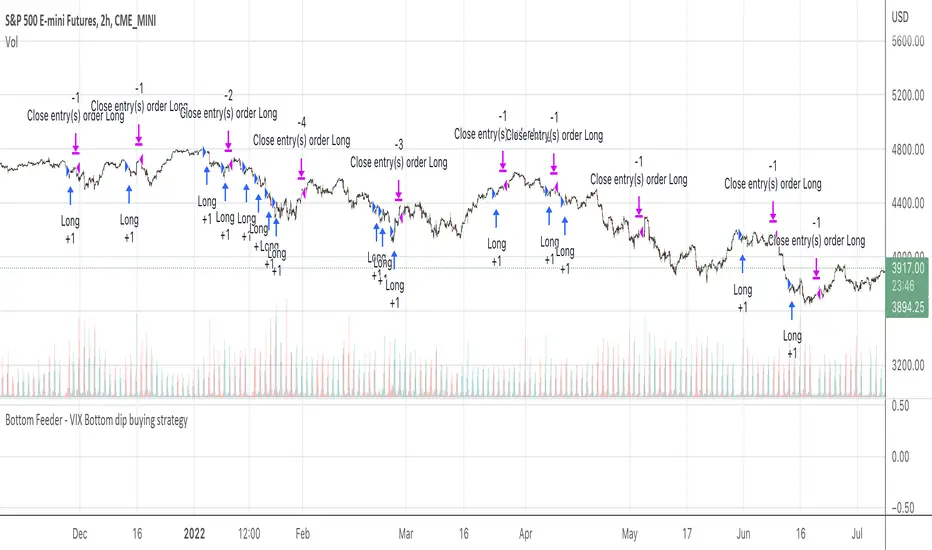
Vix FIX / StochRSI Strategy
Updated to Pine V5
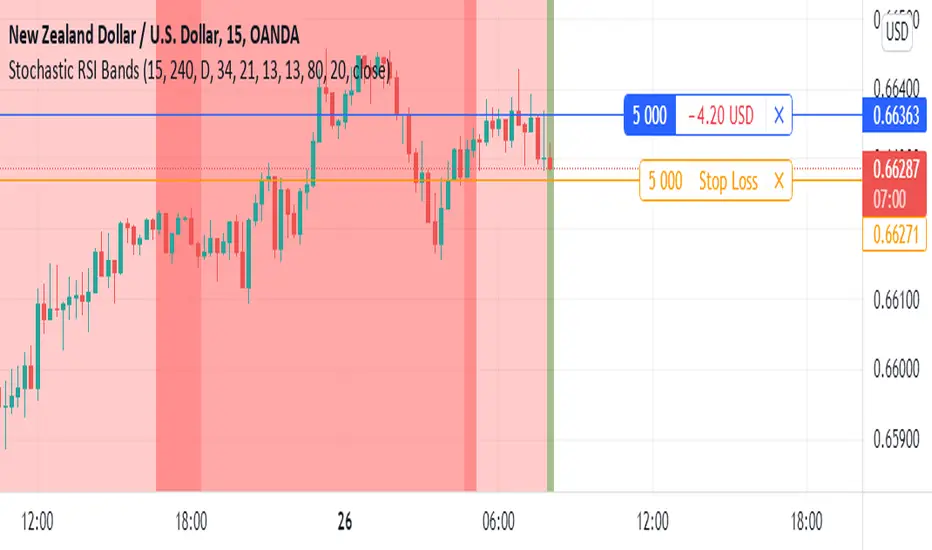
Enter upon a filtered or aggressive entry
If there are multiple entry signals, allow pyramiding
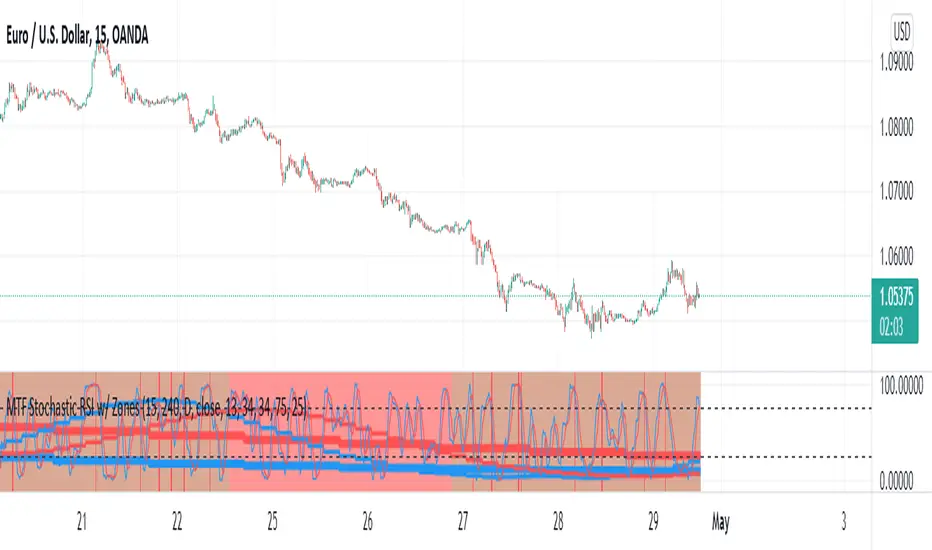
Exit when there is Stochastic RSI crossover above 80
Work with some futures and futures timeframes
Based on Chris Moody's Vix Fix
Estratégia Pine Script®