Muqwishi Volumetric CandleIntroduction
Have you ever heard that each candle represents a battle between bulls (buyer) and bears (seller)? If you know the answer, apparently you understand what the price action means. What if I ask you, how much was bloody in each battle between bulls and bears?!. This indicator may give a clear picture of how to identify the candle’s strength by implementing the Standard Deviation on volume and reshape the candle.
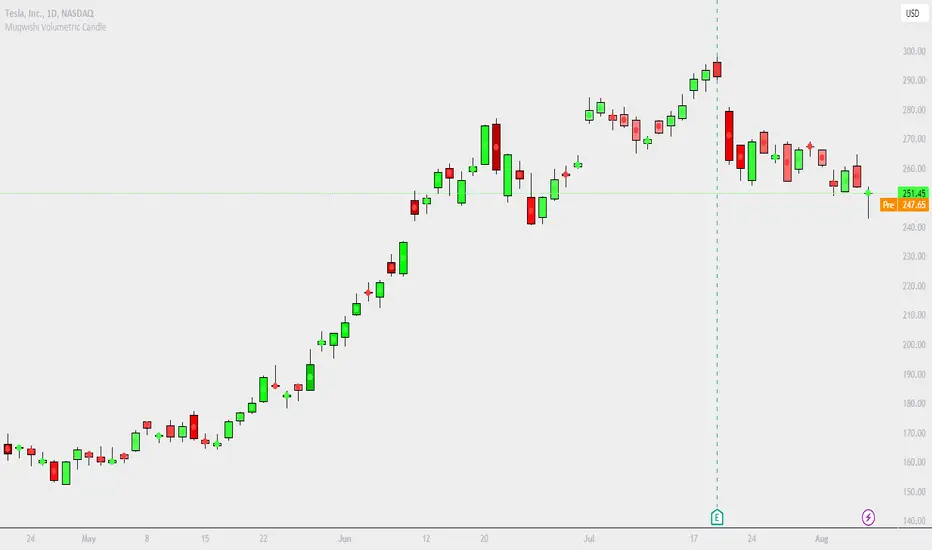
The Muqwishi Volumetric Candles indicator works to weigh each candle instantaneously and updates its color level from lightness to darkness based on the rate of the volumetric standard deviation.
Here’s how the idea started with the conceptual design, then improved till achieved to the implemented design of a structured candle.
The conceptual design mentioned for reviewing how the idea started. However, I want you to understand the “implemented design” in which the indicator has been built to address it. As I stated structurally for the implemented design section, wick and border are identified by the user through “Chart Properties” unlike core and body is measured by the indicator.
The candle’s body is ”Dynamic” that colored based on the amount of volume standard deviation in which the low volume standard deviation is a lighter candle’s color and the high volume standard deviation is a darker candle’s color. The core is “Static” color represents zero volume standard deviation which the volume at the average level. In the case where the core is darker than the body means the volume standard deviation is lower than the average volume level, and when the core is lighter than the body mean the volume standard deviation is higher than the average volume level, and when the core’s color has the same body’s color means the volume is in the average level. The image is the best guide to understand the idea.
Rarely seeing a volume standard deviation below -2σ, even though the volume is apparently dead. However, it’s possible to see more than 3.9σ, and mostly it has the same effect as 3.9σ. Personally, any candle above 1.5σ is taking my attention, and more than 2σ I look around seeking for reasons to not take a trade.
§§ Note, if you have misunderstood the standard deviation concept, there are many great sources to understand it such as Wikipedia, YouTube,... etc. In a basic example, How much is your height relative to the height of average people in your city!!?. Similarly, how much is the amount of volume relative to the average volume of a number series of previous bars?!.
Indicator Overview
Before I get into this section, this is NOT meant to be an educational or recommendation. Just showing you how I use this indicator based on an experience.
The chart above has been remarked as an example of how I apply it. Again, it’s a personal preference, and it doesn’t mean this’s an efficient way.
Indicator Setting
➤ Ensure to visualize the indicator to the front for recognition of the candle’s core.
For more information check the image: drive.google.com
➤ Indicator’s title.
Generates two outputs. The first one is the coordinate location for the char “Core”, don’t pay attention to it. The second one colored in blue is referring to the measurement of the volume standard deviation as your cursor point move at any candle on the chart. For more information check the image: drive.google.com
➤ Indicator’s inputs.
■ Length: Number of previous bars covered in the calculation. Prefer between 14-20.
■ Long Candle Color: Choose a color for bullish candles.
■ Short Candle Color: Choose a color for bearish candles.
■ Color Mode: Kinda color style.
● Lightness: From lightness to darkness colored as low volume SD to high volume SD.
● Saturation: From narrow range to wide range colored as low volume SD to high volume SD.
■ Reverse Mode: Yes → Darkness to Lightness colored as low SD to high SD.
■ Show Core: No → Hide cores.
Summarize
■ Users should have a fundamental knowledge of Standard Deviation.
■ The candle’s body is dynamic colored. Got light as low volume standard deviation, and Dark as high volume standard deviation occurred.
■ The Candle’s core is static colored. Represents the average volume which Standard Deviation equals zero.
■ This’s not a trading signal. It works to visualize the level of transactions made per candle.
Final Comments
■ My goal was to achieve the conceptual design, but there’re many obstacles that go beyond the coding ability.
■ Let me know if you have any questions, comments, and any improvements to the project.
■ I hope every time you found this indicator useful and scaled up your trading skills, please present support through PayPal that linked in the signature box below. That will help to get me excited and post many ideas.
■ Trade Safe. ✌
Desvio Padrão
EMA Cross Levels + Standard DeviationPlots the price level that the most recent EMA crossover occurred at(Green if bullish and red if bearish).
Also calculates standard deviation over a shorter window-length/lookback period (of 'n_std_fast' length) and another over a much longer span of periods(n='n_std_slow', > 'n_std_fast').
These are the two dotted lines appearing as bands around the cross-level line.

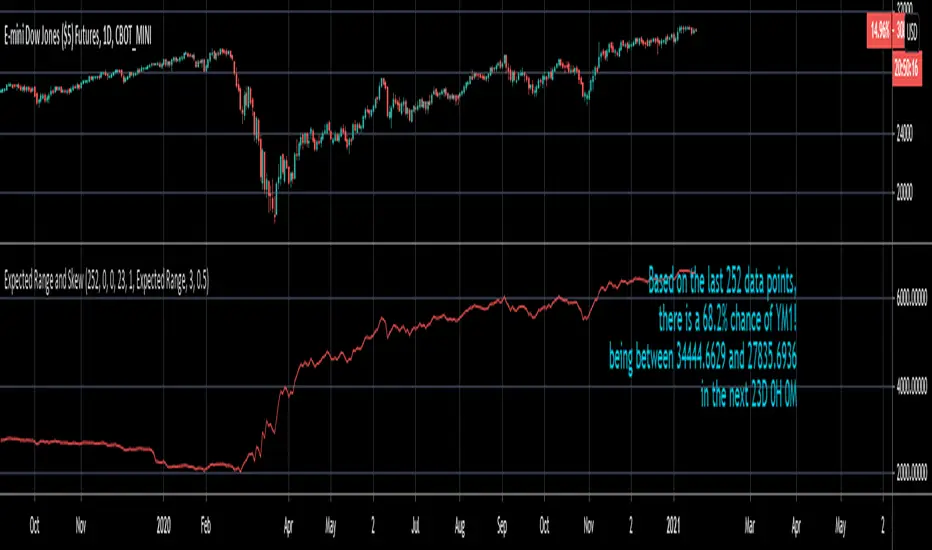
Expected Range and SkewThis is an open source and updated version of my previous "Confidence Interval" script. This script provides you with the expected range over a given time period in the future and the skew of that range. For example, if you wanted to know the expected 1 standard deviation range of MSFT over the next 20 days, this will tell you that. Additionally, this script will also tell you the skew of the expected range.
How to use this script:
1) Enter the length, this will determine the number of data points used in the calculation of the expected range.
2) Enter the amount of time you want projected forward in minutes, hours, and days.
3) Input standard deviation of the expected range.
4) Pick the type of data you want shown from the dropdown menu. Your choices are either the expected range or the skew of the expected range.
5) Enter the x and y coordinates of the label (optional). This is useful so it doesn't impede your view of the plot.
Here are a few notes about this script:
First, the expected range line gives you the width of said range (upper bound - lower bound), and the label will tell you specifically what the upper and lower bounds of the expected range are.
Second, this script will work on any of the default timeframes, but you need to be careful with how far out you try to project the expected range depending on the timeframe you're using. For example, if you're using the 1min timeframe, it probably won't do you any good trying to project the expected range over the next 20 days; or if you're using the daily timeframe it doesn't make sense to try to project the expected range for the next 5 hours. You can tell if the time horizon you're trying to project doesn't work well with the chart timeframe you're using if the current price is outside of either the upper or lower bounds provided in the label. If the current price is within the upper and lower bounds provided in the label, then the time horizon that you're projecting over is reasonable for the chart timeframe you're using.
Third, this script does not countdown automatically, so the time provided in the label will stay the same. For example, in the picture above, the expected range of Dow Futures over the next 23 days from January 12th, 2021 is calculated. But when tomorrow comes it won't count down to 22 days, instead it will show the range over the next 23 days from January 13th, 2021. So if you want the time horizon to change as time goes on you will have to update this yourself manually.
Lastly, if you try to set an alert on this script, you will get a warning about it possibly repainting. This is because of the label, not the plot itself. The label constantly updates itself, which triggers the warning. I tested setting alerts on this script both with and without the inclusion of the label, and without the label the repainting warning did not occur. So remember, if you set an alert on this script you will get a warning about it possibly repainting, but this is because of the label constantly updating, not the plot itself.
Indices Sector SigmaSpikes█ OVERVIEW
“The benchmark Dow Jones Industrial Average is off nearly 300 points as of midday today...”
“So what? Is that a lot or a little? Should we care?”
-Adam H Grimes-
This screener aims to provide Bird-Eye view across sector indices, to find which sector is having significant or 'out-of-norm' move in either direction.
The significance of the move is measured based on Sigma Spikes, a method proposed by Adam H. Grimes, where Standard Deviation of returns used as a baseline.
*You can google his blog or read his book, got some gold in there, especially on how he use indicators for trading
█ Understanding Sigma Spikes
As described by Grimes, moves in markets are only meaningful when we consider what “normal” is for that market.
Without that baseline, the daily change number, and even the percent change on the day doesn’t really mean much.
To overcome that problem, Sigma Spikes, as a measure of volatility, attempt to put todays change in price (aka return) in context of the standard deviation of 20 days daily's return.
Refer chart below:
1. The blue bars refer to each days return
2. The orange line is 1 time standard deviation of past 20days daily's return (today not included)
3. The red line is 2 time standard deviation of past 20days daily's return (today not included)
Using the ratio of today's return over the Std Deviation, determining your threshold (1,2,3,etc) will be the key that tells if today's move is significant or not.
*Threshold referring to times standard deviation, and different market may require different threshold.
*20 Days period are based on the Lookback Period, adjustable from user input window.
█ Features
- Scan up to 13 symbols at a time (Bursa (MYX) indices are defaulted, but you may change to any symbols/index from the user input setting)
█ Limitation
- Due to multiple use of security() function required to call other symbols, expect the screener to be slow at certain times
- Custom Timeframe currently accept only Daily and Weekly. I'll try to include lower timeframe in the next update
█ Disclaimer
Past performance is not an indicator of future results.
My opinions and research are my own and do not constitute financial advice in any way whatsoever.
Nothing published by me constitutes an investment recommendation, nor should any data or Content published by me be relied upon for any investment/trading activities.
I strongly recommends that you perform your own independent research and/or speak with a qualified investment professional before making any financial decisions.
Any ideas to further improve this indicator are welcome :)

(JS) VWAP BandsThis is a pretty simple script here - I took the VWAP and combined it with Bollinger Bands.
The bands can vary a lot based on chart resolution, so I wanted to make sure the resolution could be modified so you can use the resolution you're most comfortable with, or find the most success with.
Length:
Length of bars used to calculate the bands.
Standard Deviation Band 1-3:
There's three bands all together, this option allows you to modify the number of standard deviations per band.
VWAP Period:
This modifies when you want the VWAP to begin (Session, Week, Month, Year).
Offset:
This moves the VWAP and the bands the amount of bars you select, default is of course set to zero.
Source:
This selects the source of calculation, HLC/3 is the default VWAP calculation.
This is a pretty self explanatory script, I thought being able to see the standard deviations of the VWAP could prove to be useful - hope you all like it!

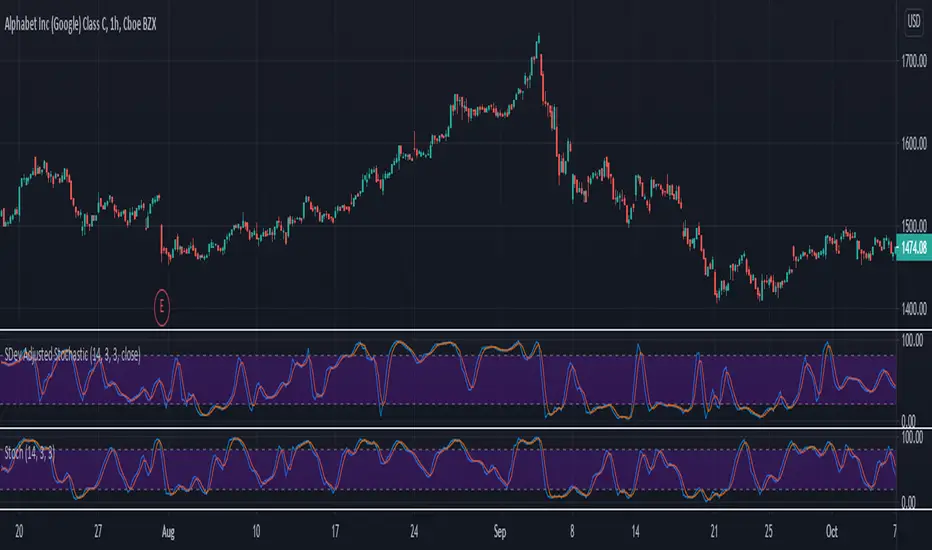
SDev Adjusted StochasticDescription : This Stochastic variant will auto-adjust stochastic period based on volatility measured by standard deviation.
The idea behind it are in highly volatile market, %K period will be reduced to account for recent price range,
while in low volatility market, %K period will be increased to account less of the recent price range.
This idea is based on one of medium article written by Sofien Kaabar with slight modification on the adjusting logic implementation. Any ideas to further improve this indicator are welcome :)
Disclaimer:
I always felt Pinescript is a very fast to type language with excellent visualization capabilities, so I've been using it as code-testing platform prior to actual coding in other platform.
Having said that, these study scripts was built only to test/visualize an idea to see its viability and if it can be used to optimize existing strategy.
While some of it are useful and most are useless, none of it should be use as main decision maker.
Standard deviation zones Support & Resistance [LM]Hi Guy,
I would like to introduce you Standard deviation zones Support & Resistance horizontals. It draws line horizontals on high and low st dev zone. The colors are dynamic depending whether price is below or above the line.
Credit is due to @Zeiierman for st dev zone calculation so shout out to him.
There are various sections in setting:
general setting where you can select source for zone calculation
tops setting
bottom setting
show and hide section of the first timeframe
show and hide section of the second timeframe
Be aware that when new zone starts and is not finished yet than the top will trail the high of unfinished zone that could be also at the high of current candle and next candle it can change
Any suggestions are welcomed

Mulitple Bollinger Bands with MAsIn this indicator, I used Bollinger Bands and many standard deviation values together. These values are: 0.618 (Yellow), 1, 1.618 (Yellow), 2, 2.618 (Yellow), 3, 3.618 (Yellow), 4, 4.618 (Yellow). Like the indicator I just published, I also added multiple moving average options for the Bollinger Bands calculation. You can create your own strategies for where it bounces in ups and downs.
Türkçe:
Bu indikatörde Bollinger Bantları ile birçok standart sapma değerini birlikte kullandım. Bu değerler: 0.618 (Sarı), 1, 1.618 (Sarı), 2, 2.618 (Sarı), 3, 3.618 (Sarı), 4, 4.618 (Sarı). Daha yayınladığım indikatör gibi burada da Bollinger Bantları hesaplaması için birden çok hareketli ortalama seçeneği de ekledim. Yükseliş ve düşüşlerde sektiği yerler için kendi stratejileriniz oluşturabilirsiniz.

Divergence Indicator [Nic]This divergence indicator can track the correlation between one or more symbols. I use it to track the divergences between the VIX volatility index, gold, bonds, as well as other market leading indicators.
When using with Vix, lower coefficients can lead to false signals. When in a high vix bear market signals, there is more noise and more false (or missing) signals can occur. Please use with other technical tools.

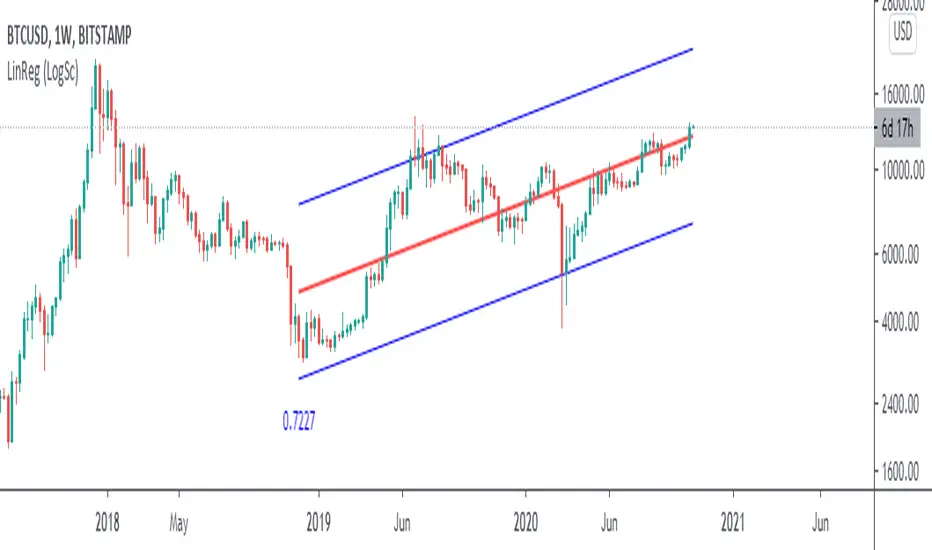
Linear Regression (Log Scale)This code is a slightly modified version of Tradingviews' built-in "linear regression" script which can be correctly plotted on logarithmic charts.
Nic's VIX CorrelationIdentifies divergences in price action between the VIX (volatility index) and a ticker. Divergences can be a 'red flag' identifying lack of confidence in the price action.
Best used in with volume studies, across multiple time frames, and across multiple tickers.
Supports any volatility ticker (VIX, VXN, RVX).

Bollinger Bands Strategy with Intraday Intensity IndexFor Educational Purposes. Results can differ on different markets and can fail at any time. Profit is not guaranteed.
This only works in a few markets and in certain situations. Changing the settings can give better or worse results for other markets.
This is a mean reversion strategy based on Bollinger Bands and the Intraday Intensity Index (a volume indicator). John Bollinger mentions that the Intraday Intensity Index can be used with Bollinger Bands and is one of the top indicators he recommends in his book. It seems he prefers it over the other volume indicators that he compares to for some reason. III looks a lot like Chaikin Money Flow but without the denominator in that calculation. On the default settings of the BBs, the III helps give off better entry signals. John Bollinger however is vague on how to use the BBs and it's hard to say if one should enter when it is below/above the bands or when the price crosses them. I find that with many indicators and strategies it's best to wait for a confirmation of some sort, in this case by waiting for some crossover of a band. Like most mean reversion strategies, the exit is very loose if using BBs alone. Usually the plan to exit is when the price finally reverts back to the mean or in this case the middle band. This can potentially lead to huge drawdowns and/or losses. Mean reversion strategies can have high win/loss ratios but can still end up unprofitable because of the huge losses that can occur. These drawdowns/losses that mean reversion strategies suffer from can potentially eat away at a large chunk of all that was previously made or perhaps up to all of it in the worst cases, can occur weeks or perhaps up to months after being profitable trading such a strategy, and will take a while and several trades to make it all back or keep a profitable track record. It is important to have a stop loss, trailing stop, or some sort of stop plan with these types of strategies. For this one, in addition to exiting the trade when price reverts to the middle band, I included a time-based stop plan that exits with a gain or with a loss to avoid potentially large losses, and to exit after only a few periods after taking the trade if in profit instead of waiting for the price to revert back to the mean.

Responsive Linear Regression ChannelsThis is a linear trend indicator that can:
- automagically adjust to different chart resolutions
- snap to day/session boundaries on intraday
- totally not do the above and use ye olde good fixed lookback window
- show the regression trend and its RMSE channels
- disregard the trend and just show the period average and standard deviation lines (often acting as support and resistance)
The main idea was to allow you to quickly view linear trends for different time periods without having to calculate the required amount of bars.
By default, you will be able to quickly switch between 1-3 months, 6 months, 1 year, 2 years and 5 years of data, as well as various daily lookback periods.
Please adjust resolution settings to your liking.
Caveats:
- More data means more noise and slower calculations.
- HLC3 source is recommended, especially at resolutions above hourly.
- Trend will be slightly different if you use extended hours.
- If you use extended hours and don't have a data subscription, trend will be SUBSTANTIALLY different, especially at smaller resolutions like 1m.
- You might want to use 3.5 days per week for crypto (it's 7 days by default).
Known problems:
- If you can't see the trendlines, scroll to the left or zoom out - the origin could be outside of your viewport.
- Futures' sessions start on the previous day. We currently snap only to day boundaries, not session breaks.
- UVXY and the like that have extremely high price datapoints. The calculations will be wrong on some resolutions.
- Replay can freeze circa bar_index 244 — disable smart lookback and keep your window under 240 bars if you encounter this.
ACKNOWLEDGEMENTS:
Many thanks to alexgrover for his extremely efficient functions (used with permission)

Neglected Volume by DGTVolume is one piece of information that is often neglected, however, learning to interpret volume brings many advantages and could be of tremendous help when it comes to analyzing the markets. In addition to technicians, fundamental investors also take notice of the numbers of shares traded for a given security.
What is Volume?
The volume represents all the recorded trades for a security that occurs in a given time interval. It is a measurement of the participation, enthusiasm, and interest in a given security. Think of volume as the force that drives the market. Volume substantiates, energizes, and empowers price. When volume increases, it confirms price direction; when volume decreases, it contradicts price direction.
In theory, increases in volume generally precede significant price movements. However, If the price is rising in an uptrend but the volume is reducing or unchanged, it may show that there’s little interest in the security, and the price may reverse.
A high volume usually indicates more interest in the security and the presence of institutional traders. However, a rapidly rising price in an uptrend accompanied by a huge volume may be a sign of exhaustion.
Traders usually look for breaks of support and resistance to enter positions. When security break critical levels without volume, you should consider the breakout suspect and prime for a reversal off the highs/lows
Volume spikes are often the result of news-driven events. Volume spike will often lead to sharp reversals since the moves are unsustainable due to the imbalance of supply and demand
note : there’s no centralized exchange where trades are recorded, so the volume data represents what happens at a particular exchange only
In most charting platforms, the volume indicator is presented as color-coded bars, green if the security closes up and red if the security closed lower, where the height of the bars show the amount of the recorded trades
Within this study, Relative Volume , Volume Weighted Bars and Volume Moving Average are presented, where Relative Volume relates current trading volume to past trading volume over long period, Volume Weighted Bars presents price bars colored based on short period past trading volume average, and Volume Moving Average is average of volume over shot period
Relative Volume is presented as color-coded bars similar to regular Volume indicator but uses four color codes instead two. Notable increases of volume are presented in green and red while average values with back and gray, hence adding ability to emphasis notable increases in the volume. It is kind of a like a radar for how "in-play" a security is. Users are allowed to change the threshold, default value is set to Fibonacci golden ration standard deviation away from its moving average.
Volume Weighted Bars, a study of Kıvanç Özbilgiç, aims to present if price movements are supported by Volume. Volume Weighted Bars are calculated based on shot period volume moving average which will reflect more recent changes in volume. Price actions with high volume will be displayed with darker colors, average volume values will remain as they are and low volume values will be indicated with lighter colors.
Volume Moving Average, Is short period volume moving average, aims to display visually the volume changes. Please not that Relative Volume bars are calculated based on standard deviation of long volume moving average.
What Else?
Apart from the volume itself, your ability to assess what volume is telling you in conjunction with price action can be a key factor in your ability to turn a profit in the market. It makes little sense to analyze the volume alone. To correctly interpret the volume data, it shall be seen in the light of what the price is doing. there are a lot of other indicators that are based on the volume data as well as price action. Analysing those volume indicators has always helped traders and investors to better understand what is happening in the market.
Here are the ones adapted with this study. Some of them used as a source for our aim, some adapted as they are with slight changes to fit visually to this study and please note that the numerical presentation may differ from their regular use
• On Balance Volume
• Divergence Indicator
• Correlation Coefficient
• Chaikin Money Flow
Shortly;
On Balance Volume
The On Balance Volume indicator, is a technical analysis indicator that relates volume flow to changes in a security’s price. It uses a cumulative total of positive and negative trading volume to predict the direction of price. The OBV is a volume-based momentum oscillator, so it is a leading indicator — it changes direction before the price
Granville, creator of OBV, proposed the theory that changes in volume precede price movements in a measurable way. He believed that volume was the main force behind major market moves and thought of OBV’s prediction of price changes as a compressed spring that expands rapidly when released.
It is believed that the OBV shows the interactions between the institutional and retail traders in the market
If the price makes a new high, the OBV should also make a new high. If the OBV makes a lower high when the price makes a higher high, there’s a classical bearish divergence — indicating that only the retail traders are buying. Another type of bearish divergence occurs when the price remains relatively quiet and fails to make a higher high but the OBV soars higher than the previous high — indicating that the institutional traders are accumulating short positions. On the other hand, if the price makes a lower low and the OBV makes a higher low, there is a classical bullish divergence, showing that the institutional traders don’t believe in that move
With this study, Momentum and Acceleration (optional) of OBV is calculated and presented, where momentum is most commonly referred to as a rate and measures the acceleration of the price and/or volume of a security. It is also referred to as a technical analysis indicator and oscillator that is able to determine market trends.
Additionally, smoothing functionality with Least Squares Method is added
Divergences especially, should always be noted as a possible reversal in the current trend, so the divergence indicator is adapted with this study where the Momentum of OBV is assumed as Oscillator with similar usages as to RSI. Divergence is most often used to track and analyze the momentum in an asset’s price and the odds of a price reversal within the current trend. The divergence indicator warns traders and technical analysts of changes in a price/volume trend, oftentimes that it is weakening or changing direction.
Correlation Coefficient
The correlation coefficient is a statistical measure of the strength of the relationship between the relative movements of two variables. A correlation of -1.0 shows a perfect negative correlation, while a correlation of 1.0 shows a perfect positive correlation. A correlation of 0.0 shows no linear relationship between the movement of the two variables. In other words, the closer the Correlation Coefficient is to 1.0, indicates the instruments will move up and down together as it is mostly expected with volume and price. So the Correlation Coefficient Indicator aims to display when the price and volume (on balance volume) is in correlation and when not. With this study blue represent positive correlation while orange negative correlation. The strength of the correlation is determined by the width of the bands, to emphasis the effect horizontal lines are drawn with values set to 0.5 and -0.5. the values above 0.5 (or below -0.5) shows stronger correlation.
Chaikin Money Flow , provide optionally as a companion indicator
The Chaikin money flow indicator (CMF) is a volume indicator that measures the money flow volume over a chosen period. The money flow volume is a measure of the volume and where the price closed relative to the trading session’s range. It comes from the idea that buying pressure is indicated by a rising volume and recurrent closes in the upper part of the session’s price range while selling pressure is demonstrated by an increasing volume and repeated closes in the lower part of the price range.
Both buying and selling pressures are accompanied by an increase in volume, but the location of the closing prices are in accordance with the direction of price
Special thanks to @InvestCHK and @hjsjshs , who have enormously contributed while preparing this study
related studies:
Disclaimer:
Trading success is all about following your trading strategy and the indicators should fit within your trading strategy, and not to be traded upon solely
The script is for informational and educational purposes only. Use of the script does not constitute professional and/or financial advice. You alone have the sole responsibility of evaluating the script output and risks associated with the use of the script. In exchange for using the script, you agree not to hold dgtrd TradingView user liable for any possible claim for damages arising from any decision you make based on use of the script

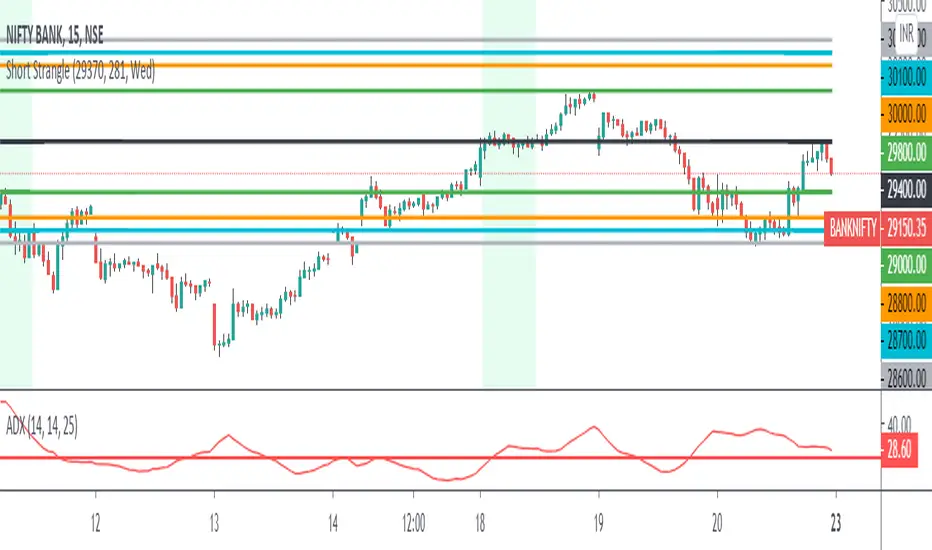
3 Leg Short Strangle BandsDraws 3 leg bands along with safe zone(green lines) based on input
1) Input ATR, Week Day, Current Market Close
2) Input ATR - Previous day 1H Max ATR
3) ADX < 25
4) Input Current Market Close
5) Trading Day - Mon/Tue/Wed/Thu/Fri - Bands distance calculated based on day M/Tu/F 2*(Max ATR), W/Th 1.5(ATR)
6) Safe zone green lines - CMPCls +/- (1.5 * Max ATR)
7) Leg 1 Upper Lower Legs - M/Tu/F - CMPCls +/-(2 * Max ATR), W/Th - CMPCls +/-(1.5 * ATR)
8) Leg 2 & 3 Calculates based on Leg 2 = Leg 1 +/- 100 pts distance, Leg 3 = Leg 2 +/- 100 pts distance'
9) All figures rounded to nearest 100's
10) Safe zone broken exit all positions
This is a popular technic used by Profitable traders on sideway markets for Intraday
One can keep 3K as SL per 1 set of 3 legs for better R:R
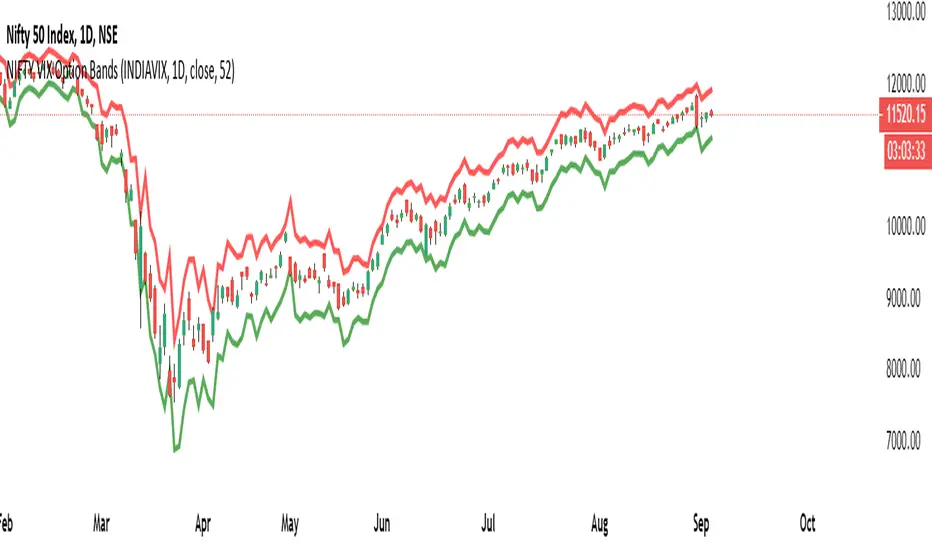
NIFTY VIX Bands1) The script takes current INDIA VIX as input Daily time frame for NIFTY
2) Used a Formula VIX Value / Square root of Time Period
3) Change Timeframe input accordingly 1 Year = 1, Monthly = 12, Weekly = 52, Daily = 365
4) based point 2 formula with 1 standard deviation it creates upper & lower range bands
5) This is generally used for option selling by big traders they go and sell above the band strikes
Standard Deviation Volatility HelperHere is a simple Standard Deviation Line based on supply and demand that will help you to find expected move easily. 3 Standart Deviation merged line available. Number of days and adjustable length.

Varprice4 - Price is the real KingWhen you use any indicators you suffer of lagging and possibile mistakes.
In this case, higher movements of the (daily) prices (long green candle) are a signal that market is appreciating your stock. The variation of a single candle is compared to standard deviation of the stock.
Besides normal money management (on fixed percentages), we have kept the possibily of exiting the position before stop loss adding a multiplier considering that red (or black) candles are normally wider than green (white) ones.

Bollinger Bands Money Flow IndexThis script embodies the application of the Bollinger Band and Money Flow Index in John A. Bollinger's book "Bollinger on Bollinger Bands."
"Bollinger on Bollinger Bands" suggests a relatively method of analysis by applying the Bollinger Band to an indicator.
Here's one of the indicators, Money Flow Index.
Money Flow Index is an indicator of overbuying and overselling by reflecting the volume of transactions.
"Bollinger on Bollinger Bands" suggests using the Bollinger Band to create relative top and bottom lines for various indicators, such as Money Flow Index.
Original Money Flow Index is considered to be over-purchased if it is more than 80% and over-selling if it is less than 20%.
But if you put a bolinger band on it, you can set the standard for higher or lower over-selling and over-selling in a sustained bullish, bearish market.
This script uses the following values as the default values as recommended by "Bollinger on Bollinger Bands".
Money Flow Index for 10 days.
a bollinger band of forty days
standard deviation of 2
The above values are suitable for most stocks and markets, but sometimes there is too much or too little data inside the Bollinger Band.
It is recommended to modify each value little by little to adjust 85% to 90% of the total data to fit inside the Bollinger Band.
If the value is higher than the top line, it is considered over-purchased, and a red background color appears.
If the bottom line is crossed down, it is considered over-sold and the green background color appears.

MultiType Shifting Predictive Moving Averages (MA) CrossoverJust 2 Moving Averages with adjustable settings and shifting capability, plus signals and predicting continuations.
At the time of publish these different types of MAs are supported:
- SMA (Simple)
- EMA (Exponential)
- DEMA (Double Exponential)
- TEMA (Triple Exponential)
- RMA (Adjusted Exponential)
- WMA (Weighted)
- VWMA (Volume Weighted)
- SWMA (Symmetrically Weighted)
- HMA (Hull)
I'm looking forward to any idea about filtering the signals. Thanks.

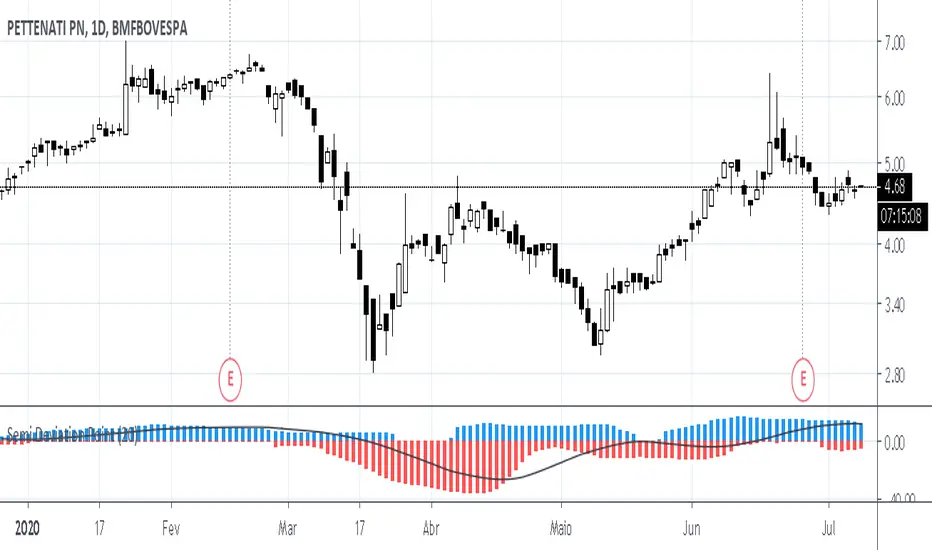
Semi Deviation Point PercentThe Semi Deviation Point calculates the positive value as the standard deviation of only samples that has high value than the simple moving average. The negative value is the same standard deviation, but only uses the low value and multiply for -1.
After this calculate the value is divide by the value of simple moving average and multiplied by hundred to get a percent value from 0% to 100%.
The delta line is a simple moving average from the differences of the two values.
How it should be read?
If positive values are greater than negative values than the volatility is happen on higher prices and not lower.
If positive values are lower than negative values than the volatility is happen on lower prices and not higher.
If you know that in which market you would opt in? Is it less risk the prior?
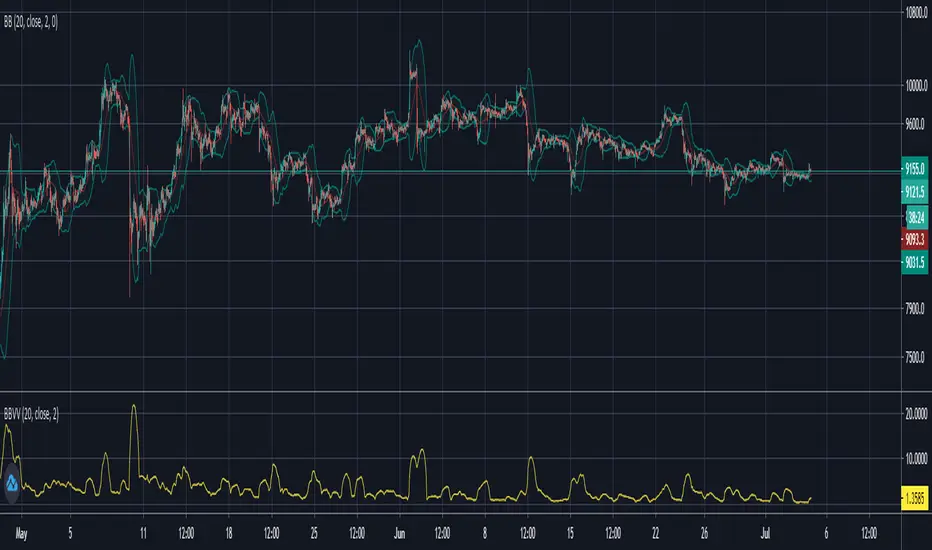
Bollinger Band Volatility Spread VisualizerThis indicator was created to see the total dollar (or whatever currency pair) amount spread between the upper and lower Bollinger Bands. This knowledge of knowing this spread can be used to indicate upcoming periods of high volatility in a market. The fundamental idea behind predicting periods of high volatility is backed up by the idea that periods of low volatility are followed by periods of high volatility and vice versa.
Based on this knowledge, the numerical spread of the Bollinger Bands, as shown in the indicator, we can deduce that when the value is super low, we can expect a period of high volatility AKA: big move incoming.
This indicator is not fully finished because this was my first time coding in Pinescript and I wanted to post the basic indicator first.
My future plans for improving this indicator include:
Adding customization as an option to choose your personal BBands settings that this indicator is based off of
Potentially converting this indicator as a TradingView Strategy where a signal would go off when the spread reaches a certain threshold
Squeeze Momentum Indicator [LazyBear] vX by DGTModified version of Squeeze Momentum Indicator visualizing on Price Chart
author: LazyBear, modified by KıvançÖZBİLGİÇ
