SMC Statistical Liquidity Walls [PhenLabs]📊 SMC Statistical Liquidity Walls
Version: PineScript™ v6
📌 Description
The SMC Statistical Liquidity Walls indicator is designed to visualize market volatility and potential reversal zones using advanced statistical modeling. Unlike traditional Bollinger Bands that use simple lines, this script utilizes an “Inverted Sigmoid” opacity function to create a “fog of war” effect. This visualizes the density of liquidity: the further price moves from the equilibrium (mean), the “harder” the liquidity wall becomes.
This tool solves the problem of over-trading in low-probability areas. By automatically mapping “Premium” (Resistance) and “Discount” (Support) zones based on Standard Deviation (SD), traders can instantly see when price is overextended. The result is a clean, intuitive overlay that helps you identify high-probability mean reversion setups without cluttering your chart with manual drawings.
🚀 Points of Innovation
Inverted Sigmoid Logic: A custom mathematical function maps Standard Deviation to opacity, creating a realistic “wall” density effect rather than linear gradients.
Dynamic “Solidity”: The indicator is transparent at the center (Equilibrium) and becomes visually solid at the edges, mimicking physical resistance.
Separated Directional Bias: distinct Red (Premium) and Green (Discount) coding helps SMC traders instantly recognize expensive vs. cheap pricing.
Smart “Safe” Deviation: Includes fallback logic to handle calculation errors if deviation hits zero, ensuring the indicator never crashes during data gaps.
🔧 Core Components
Basis Calculation: Uses a Simple Moving Average (SMA) to determine the market’s equilibrium point.
Standard Deviation Zones: Calculates 1SD, 2SD, and 3SD levels to define the statistical extremes of price action.
Sigmoid Alpha Calculation: Converts the SD distance into a transparency value (0-100) to drive the visual gradient.
🔥 Key Features
Automated Premium/Discount Zones: Red zones indicate overbought (Premium) areas; Green zones indicate oversold (Discount) areas.
Customizable Density: Users can adjust the “Steepness” and “Midpoint” of the sigmoid curve to control how fast the walls become solid.
Integrated Alerts: Built-in alert conditions trigger when price hits the “Solid” wall (2SD or higher), perfect for automated trading or notifications.
Visual Clarity: The center of the chart remains clear (high transparency) to keep focus on price action where it matters most.
🎨 Visualization
Equilibrium Line: A gray line representing the mean price.
Gradient Fills: The space between bands fills with color that increases in opacity as it moves outward.
Premium Wall: Upper zones fade from transparent red to solid red.
Discount Wall: Lower zones fade from transparent green to solid green.
📖 Usage Guidelines
Range Period: Default 20. Controls the lookback period for the SMA and Standard Deviation calculation.
Source: Default Close. The price data used for calculations.
Center Transparency: Default 100 (Clear). Controls how transparent the middle of the chart is.
Edge Transparency: Default 45 (Solid). Controls the opacity of the outermost liquidity wall.
Wall Steepness: Default 2.5. Adjusts how aggressively the gradient transitions from clear to solid.
Wall Start Point: Default 1.5 SD. The deviation level where the gradient shift begins to accelerate.
✅ Best Use Cases
Mean Reversion Trading: Enter trades when price hits the solid 2SD or 3SD wall and shows rejection wicks.
Take Profit Targets: Use the Equilibrium (Gray Line) as a logical first target for reversal trades.
Trend Filtering: Do not initiate new long positions when price is deep inside the Red (Premium) wall.
⚠️ Limitations
Lagging Nature: As a statistical tool based on Moving Averages, the walls react to past price data and may lag during sudden volatility spikes.
Trending Markets: In strong parabolic trends, price can “ride” the bands for extended periods; mean reversion should be used with caution in these conditions.
💡 What Makes This Unique
Physics-Based Visualization: We treat liquidity as a physical barrier that gets denser the deeper you push, rather than just a static line on a chart.
🔬 How It Works
Step 1: The script calculates the mean (SMA) and the Standard Deviation (SD) of the source price.
Step 2: It defines three zones above and below the mean (1SD, 2SD, 3SD).
Step 3: The custom `get_inverted_sigmoid` function calculates an Alpha (transparency) value based on the SD distance.
Step 4: Plot fills are colored dynamically, creating a seamless gradient that hardens at the extremes to visualize the “Liquidity Wall.”
💡 Note
For best results, combine this indicator with Price Action confirmation (such as pin bars or engulfing candles) when price touches the solid walls.
Standarddevation

Z-EMA Fusion BandsDesigned with crypto markets in mind, particularly Bitcoin , it builds on the concept that the 1-Week 50 EMA often serves as a long-term bull/bear market threshold — an area where institutional bias, momentum shifts, and cyclical rotations tend to occur.
🔹 Core Components & Synergies:
1. 1W 50 EMA (Higher Timeframe)
- This EMA is calculated on a weekly timeframe, regardless of your current chart.
- In crypto, price above the 1W 50 EMA typically aligns with long-term bull market phases, while extended periods below can signify bearish macro structure.
- The slope of the EMA is also analyzed to add directional confidence to trend strength.
2. ±1 Standard Deviation Bands
- Surrounding the 50 EMA, these bands visualize normal price dispersion relative to trend.
- When price consistently hugs or breaks outside these bands, it often reflects market expansion, volatility events, or mean-reversion opportunity.
3. Z-Score Gradient Fill
- The area between the bands is filled using a Z-score-based gradient, which dynamically adjusts color based on how far price is from the EMA (in terms of standard deviations).
- Color shifts from aqua (near EMA) to fuchsia (far from EMA) help you spot price compression, equilibrium, or overextension at a glance.
- The fill also uses transparency scaling, making it fade as price stretches further, emphasizing the core structure.
4. Directional EMA Coloring
- The EMA line itself is colored based on:
- The slope of the EMA (rising/falling)
- Whether the HTF candle is bullish or bearish
- This provides intuitive color-coded confirmation of momentum alignment or potential exhaustion.
5. Price/EMA Divergence Detection
- The script detects bullish and bearish divergence between price and the EMA (rather than using a traditional oscillator).
- Bullish Divergence: Price makes a lower low, EMA makes a higher low.
- Bearish Divergence: Price makes a higher high, EMA makes a lower high.
- These signals often mark transitional zones where momentum fades before a trend reversal or correction.
📊 Suggested Uses:
🔸 Swing and Position Trading:
- Use the 1W 50 EMA as a macro-trend anchor.
- Stay long-biased when price is above with positive slope, and short-biased when below.
- Consider entries near band edges for mean-reversion plays, especially if confluence forms with divergence signals.
🔸 Volatility-Based Filtering:
- Use the Z-score fill to identify volatility compression (near EMA) or expansion (edge of bands).
- Combine this with breakout strategies or dynamic position sizing.
🔸 Divergence Confirmation:
- Combine divergence markers with HTF EMA slope for high-probability setups.
- Bullish div + EMA flattening/rising can signal the start of accumulation after a macro dip.
🔸 Multi-Timeframe Analysis:
- Works well as a structural overlay on intraday charts (1H, 4H, 1D).
- Use this indicator to track long-term bias while executing lower timeframe trades.
⚠️ Disclaimer:
This indicator is designed for educational and informational purposes only. It does not constitute financial advice or a recommendation to buy or sell any asset.
Always use proper risk management, and combine with your own analysis, tools, and strategy. Performance in past market conditions does not guarantee future results.

VWAP Composites📊 VWAP Composite - Advanced Multi-Period Volume Weighted Average Price Indicator
═══════════════════════════════════════════════════════════════════
🎯 OVERVIEW
VWAP Composite is an advanced volume-weighted average price (VWAP) indicator that goes beyond traditional single-period VWAP calculations by offering composite multi-period analysis and unprecedented customization. This indicator solves a common problem traders face: traditional VWAP resets at arbitrary intervals (session start, day, week), but significant price action and volume accumulation often spans multiple periods. VWAP Composite allows you to anchor VWAP calculations to any timeframe—or combine multiple periods into a single composite VWAP—giving you a true representation of average price weighted by volume across the exact periods that matter to your analysis.
═══════════════════════════════════════════════════════════════════
⚙️ HOW IT WORKS - CALCULATION METHODOLOGY
📌 CORE VWAP CALCULATION
The indicator calculates VWAP using the standard volume-weighted formula:
• Typical Price = (High + Low + Close) / 3
• VWAP = Σ(Typical Price × Volume) / Σ(Volume)
This calculation is performed across user-defined time periods, ensuring each bar's contribution to the average is proportional to its trading volume.
📌 STANDARD DEVIATION BANDS
The indicator calculates volume-weighted standard deviation to measure price dispersion around the VWAP:
• Variance = Σ / Σ(Volume)
• Standard Deviation = √Variance
• Upper Band = VWAP + (StdDev × Multiplier)
• Lower Band = VWAP - (StdDev × Multiplier)
These bands help identify overbought/oversold conditions relative to the volume-weighted mean, with high-volume price excursions having greater impact on band width than low-volume moves.
📌 COMPOSITE PERIOD METHODOLOGY (Auto Mode)
Unlike traditional VWAP that resets at fixed intervals, Auto Mode creates composite VWAPs by combining the current period with N previous periods:
• Period Span = 1: Current period only (standard VWAP behavior)
• Period Span = 2: Current period + 1 previous period combined
• Period Span = 3: Current period + 2 previous periods combined
• And so on...
Example: A 3-period Weekly composite VWAP calculates from the start of 2 weeks ago through the current week's end, creating a single VWAP that represents 21 days of continuous price and volume data. This provides context about where price stands relative to the volume-weighted average over multiple weeks, not just the current week.
═══════════════════════════════════════════════════════════════════
🔧 KEY FEATURES & ORIGINALITY
✅ DUAL OPERATING MODES
1️⃣ MANUAL MODE (5 Independent VWAPs)
Define up to 5 separate VWAP calculations with custom start/end times:
• Perfect for anchoring VWAP to specific events (earnings, Fed announcements, major reversals)
• Each VWAP has independent color settings for lines and deviation band backgrounds
• Individual control over calculation extension and visual extension (explained below)
• Useful for tracking multiple institutional accumulation/distribution zones simultaneously
2️⃣ AUTO MODE (Composite Period VWAP)
Automatically calculates VWAP across combined time periods:
• Supported periods: Daily, Weekly, Monthly, Quarterly, Yearly
• Configurable period span (1-20 periods)
• Always up-to-date, recalculates on each new bar
• Ideal for systematic analysis across consistent timeframes
✅ DUAL EXTENSION SYSTEM (Manual Mode Innovation)
Most VWAP indicators only offer "on/off" for extending calculations. This indicator provides two distinct extension options:
🔹 EXTEND CALCULATION TO CURRENT BAR
When enabled, continues including new bars in the VWAP calculation after the defined end time. The VWAP value updates dynamically as new volume enters the market.
Use case: You anchored VWAP to a major low 3 weeks ago. You want the VWAP to continue evolving with new volume data to track ongoing institutional positioning.
🔹 EXTEND VISUAL LINE ONLY
When enabled (and calculation extension is disabled), projects the "frozen" VWAP value forward as a reference line. The VWAP value remains fixed at what it was at the end time, but the line and deviation bands visually extend to current price.
Use case: You want to see how price is behaving relative to the VWAP that existed at a specific point in time (e.g., "Where is price now vs. the 5-day VWAP that existed at last Friday's close?").
This dual system gives you unprecedented control over whether you're tracking a "living" VWAP that incorporates new data or using historical VWAP levels as static reference points.
✅ CUSTOMIZABLE STANDARD DEVIATION BANDS
• Adjustable multiplier (0.1 to 5.0)
• Independent background colors with opacity control for each VWAP
• Dashed band lines for easy visual distinction from main VWAP
• Bands extend when visual extension is enabled, maintaining zone visibility
✅ COMPREHENSIVE LABELING SYSTEM
Each VWAP displays:
• Current VWAP value
• Upper deviation band value (High)
• Lower deviation band value (Low)
• Extension status indicator (Calc Extended / Visual Extended)
• Color-coded for quick identification
═══════════════════════════════════════════════════════════════════
📖 HOW TO USE THIS INDICATOR
🎯 SCENARIO 1: EVENT-ANCHORED VWAP (Manual Mode)
Use case: A stock gaps down 15% on earnings and you want to track where institutions are positioning during the recovery.
Setup:
1. Switch to Manual Mode
2. Enable VWAP 1
3. Set Start Time to the earnings gap bar
4. Set End Time to current time (or leave far in future)
5. Enable "Extend Calculation to Current Bar"
6. Watch how price respects the VWAP as a dynamic support/resistance
Interpretation:
• Price above VWAP = buyers in control since the event
• Price testing VWAP from above = potential support
• Volume-weighted standard deviation bands show normal price range
• Price outside bands = potential exhaustion/mean reversion setup
🎯 SCENARIO 2: MULTI-WEEK INSTITUTIONAL ACCUMULATION ZONE (Auto Mode)
Use case: You trade swing setups and want to identify where institutions have been accumulating over the past 3 weeks.
Setup:
1. Switch to Auto Mode
2. Select "Weekly" period type
3. Set Period Span to 3
4. Enable standard deviation bands
Interpretation:
• 3-week composite VWAP shows the true average institutional entry
• Price bouncing off VWAP repeatedly = strong support (institutions defending their average)
• Price breaking below VWAP on high volume = potential distribution
• Deviation bands contracting = consolidation; expanding = volatility increase
🎯 SCENARIO 3: COMPARING MULTIPLE TIME HORIZONS (Manual Mode)
Use case: You want to see short-term vs medium-term vs long-term VWAP alignments.
Setup:
1. Switch to Manual Mode
2. VWAP 1: Last 5 trading days (blue)
3. VWAP 2: Last 10 trading days (orange)
4. VWAP 3: Last 20 trading days (purple)
5. Enable "Extend Calculation" for all
6. Set different background colors for visual separation
Interpretation:
• All VWAPs aligned upward = strong trend across all timeframes
• Price between VWAPs = finding equilibrium between different trader timeframes
• Short-term VWAP crossing long-term VWAP = momentum shift
• Price rejecting at higher-timeframe VWAP = that timeframe's traders defending their average
🎯 SCENARIO 4: HISTORICAL VWAP REFERENCE LEVELS (Manual Mode)
Use case: You want to see where the 1-month VWAP was at each month-end as static reference levels.
Setup:
1. Switch to Manual Mode
2. VWAP 1: Set to last month's start/end dates
3. VWAP 2: Set to 2 months ago start/end dates
4. VWAP 3: Set to 3 months ago start/end dates
5. Disable "Extend Calculation"
6. Enable "Extend Visual Line Only"
Interpretation:
• Each VWAP represents the volume-weighted average for that complete month
• These become static support/resistance levels
• Price returning to old monthly VWAPs = institutional memory/gap fill behavior
• Useful for identifying longer-term value areas
═══════════════════════════════════════════════════════════════════
🎨 CUSTOMIZATION OPTIONS
GENERAL SETTINGS
• Show/hide labels
• Line style: Solid, Dashed, or Dotted
• Standard deviation multiplier (impacts band width)
• Toggle standard deviation bands on/off
MANUAL MODE (Per VWAP)
• Custom start and end times
• Line color picker
• Background color picker (with transparency control)
• Extend calculation option
• Extend visual option
• Show/hide individual VWAPs
AUTO MODE
• Period type selection (Daily/Weekly/Monthly/Quarterly/Yearly)
• Period span (1-20 periods)
• Line color
• Background color (with transparency control)
═══════════════════════════════════════════════════════════════════
💡 TRADING APPLICATIONS
✓ Mean Reversion: Use deviation bands to identify stretched prices likely to return to VWAP
✓ Trend Confirmation: Price sustained above VWAP = bullish bias; below = bearish bias
✓ Support/Resistance: VWAP often acts as dynamic S/R, especially on higher volume periods
✓ Institutional Positioning: Multi-day/week VWAPs show where large players have established positions
✓ Entry Timing: Wait for pullbacks to VWAP in trending markets
✓ Stop Placement: Use VWAP ± standard deviation as volatility-adjusted stop levels
✓ Breakout Confirmation: Breakouts from consolidation with price reclaiming VWAP = stronger signal
✓ Multi-Timeframe Analysis: Compare short vs long-period VWAPs to gauge momentum alignment
═══════════════════════════════════════════════════════════════════
⚠️ IMPORTANT NOTES
• The indicator redraws on each bar to maintain accurate visual representation (uses `barstate.islast`)
• Maximum lookback is limited to 5000 bars for performance optimization
• Time range calculations work across all timeframes but are most effective on intraday to daily charts
• Standard deviation bands assume volume-weighted distribution; extreme events may violate assumptions
• Auto mode always calculates to current bar; use Manual mode for fixed historical periods
═══════════════════════════════════════════════════════════════════
This indicator is open-source. Feel free to examine the code, learn from it, and adapt it to your needs.

Vault FX Time + Price Indicator v1Collection of tools for analysis:
- Midnight Open Horizontal Price Line
- 09:30 Open Horizontal Price Line
- Midnight and 09:30 Vertical Price Lines
- NWOG painter
- Asia Range Box
- Asia Range H/L lines (Lines extend until purged or 10:00 AM NY, whichever occurs first)
- Asia Range Standard Deviation Levels (Customizable)
- Day Separators
- PDH/PDL | PWH/PWL | PMH/PML Lines w/ Alerts
- First Presented FVG for NY-AM Session (1min Chart)
- Timeframe Specific Swing High/Low Sweeps w/ Alerts (Requires user setup)
Some features are still being tested, let me know if you find any bugs!

Relative Volatility Mass [SciQua]The ⚖️ Relative Volatility Mass (RVM) is a volatility-based tool inspired by the Relative Volatility Index (RVI) .
While the RVI measures the ratio of upward to downward volatility over a period, RVM takes a different approach:
It sums the standard deviation of price changes over a rolling window, separating upward volatility from downward volatility .
The result is a measure of the total “volatility mass” over a user-defined period, rather than an average or normalized ratio.
This makes RVM particularly useful for identifying sustained high-volatility conditions without being diluted by averaging.
────────────────────────────────────────────────────────────
╭────────────╮
How It Works
╰────────────╯
1. Standard Deviation Calculation
• Computes the standard deviation of the chosen `Source` over a `Standard Deviation Length` (`stdDevLen`).
2. Directional Separation
• Volatility on up bars (`chg > 0`) is treated as upward volatility .
• Volatility on down bars (`chg < 0`) is treated as downward volatility .
3. Rolling Sum
• Over a `Sum Length` (`sumLen`), the upward and downward volatilities are summed separately using `math.sum()`.
4. Relative Volatility Mass
• The two sums are added together to get the total volatility mass for the rolling window.
Formula:
RVM = Σ(σ up) + Σ(σ down)
where σ is the standard deviation over `stdDevLen`.
╭────────────╮
Key Features
╰────────────╯
Directional Volatility Tracking – Differentiates between volatility during price advances vs. declines.
Rolling Volatility Mass – Shows the total standard deviation accumulation over a given period.
Optional Smoothing – Multiple MA types, including SMA, EMA, SMMA (RMA), WMA, VWMA.
Bollinger Band Overlay – Available when SMA is selected, with adjustable standard deviation multiplier.
Configurable Source – Apply RVM to `close`, `open`, `hl2`, or any custom source.
╭─────╮
Usage
╰─────╯
Trend Confirmation: High RVM values can confirm strong trending conditions.
Breakout Detection: Spikes in RVM often precede or accompany price breakouts.
Volatility Cycle Analysis: Compare periods of contraction and expansion.
RVM is not bounded like the RVI, so absolute values depend on market volatility and chosen parameters.
Consider normalizing or using smoothing for easier visual comparison.
╭────────────────╮
Example Settings
╰────────────────╯
Short-term volatility detection: `stdDevLen = 5`, `sumLen = 10`
Medium-term trend volatility: `stdDevLen = 14`, `sumLen = 20`
Enable `SMA + Bollinger Bands` to visualize when volatility is unusually high or low relative to recent history.
╭───────────────────╮
Notes & Limitations
╰───────────────────╯
Not a directional signal by itself — use alongside price structure, volume, or other indicators.
Higher `sumLen` will smooth short-term fluctuations but reduce responsiveness.
Because it sums, not averages, values will scale with both volatility and chosen window size.
╭───────╮
Credits
╰───────╯
Based on the Relative Volatility Index concept by Donald Dorsey (1993).
TradingView
SciQua - Joshua Danford

Advanced VWAP Multi-MA System with Bollinger Bands & Dashboard📊 Key Features:
Core Functionality:
* VWAP Calculation with customizable anchor periods (Session/Week/Month/Quarter/Year)
* Multiple Moving Average Types (EMA, SMA, WMA, HMA, RMA, VWMA)
* Three MA Lengths (Fast: 9, Medium: 21, Slow: 50)
* Standard Deviation Bands with 3 levels (1σ, 2σ, 3σ)
* Dynamic band multipliers (adjustable from 0.5 to 5.0)
🎨 Visual Theme System:
* Theme Types: Dark, Light, Pro
* Visual Styles: Quantum, Holographic, Crystalline, Plasma, Nebula
* Visual Intensity Control (20-100%)
* Multi-layer Harmonic Nodes with gradient effects
* Energy Flow Lines based on momentum
* Minimal signal dots for buy/sell conditions
📈 Holographic Dashboard:
* Real-time VWAP position tracking
* MA trend analysis (Bullish/Bearish/Neutral)
* Band position indicator (±1σ, ±2σ, ±3σ)
* Volatility percentage
* Momentum direction
* Current visual theme display
✨ Visual Effects:
* Quantum Fields: Multi-layer boxes with dynamic transparency
* Energy Flow: Momentum-based directional lines
* Gradient Fills: Between bands and MAs
* Borderless Design: Clean, modern appearance
* Emoji Headers: Enhanced visual appeal (⚡ 🌌 📊 🔮)
🎯 Trading Signals:
* Bullish Signal: Close > VWAP AND Close > Fast MA AND Fast MA > Medium MA
* Bearish Signal: Close < VWAP AND Close < Fast MA AND Fast MA < Medium MA

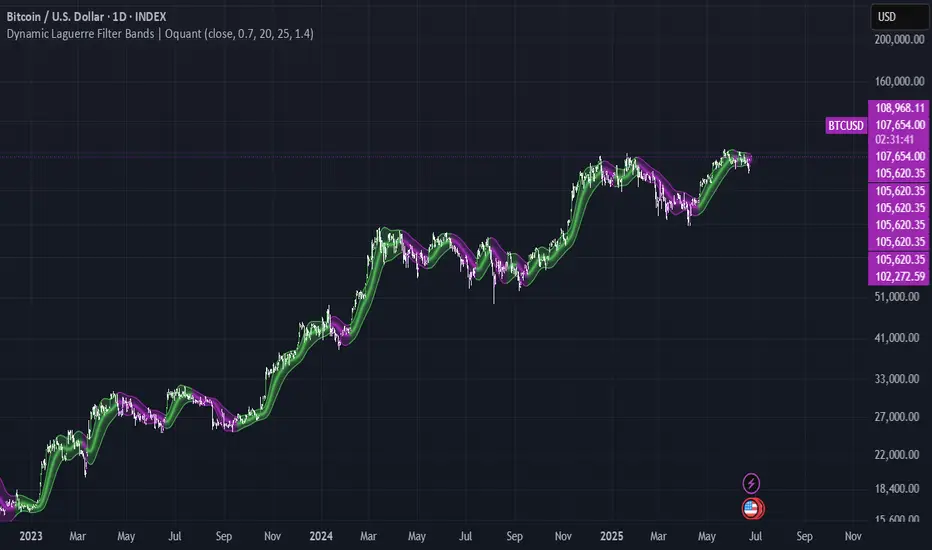
Dynamic Laguerre Filter Bands | OttoThis indicator combines trend-following and volatility analysis by enhancing the traditional Laguerre filter with a dynamic, volatility-adjusted band system. Instead of using fixed thresholds, the bands adapt in real-time to changing market conditions by applying smoothed standard deviation calculations. This design keeps the indicator responsive to significant price movements while effectively filtering out short-term market noise, resulting in more accurate trend identification and breakout signals.
Core Concept
The indicator is built around the following key components:
Laguerre Filter:
The Laguerre filter is designed to smooth out price data by reducing market noise while still being quick enough to detect real changes in price direction. Its goal is to create a clear, smooth trend line that helps traders/investors focus on the overall market trend without getting distracted by small, random price swings.
It uses a parameter called gamma to control how it balances smoothness and responsiveness:
A lower gamma gives more weight to recent price data, making the filter react faster to new price changes. This means the trend line is more sensitive but may also be less smooth and more prone to small fluctuations.
A higher gamma gives more weight to past price data, making the filter smoother and less sensitive to quick changes. This helps reduce noise and produces a steadier trend line, but it also introduces more lag, meaning the filter reacts slower to new price moves.
By adjusting gamma, the Laguerre filter lets you choose the balance between following price changes quickly and having a stable, noise-free trend signal.
Standard Deviation:
shows how much price varies from the mean. In this indicator, it’s used to measure market volatility.
Volatility Bands: The upper and lower bands are based on an EMA-smoothed standard deviation of price. The EMA reduces sudden jumps in volatility, creating smoother and more stable bands that still respond to changing market conditions. These bands are plotted around the Laguerre filter line, expanding and contracting in a controlled way to stay aligned with real market movement while avoiding short-term noise.
Signal Logic:
A long signal is triggered when the close price crosses above the upper band.
A short signal occurs when the close price falls below the lower band.
⚙️ Inputs
Source: Price source used in calculations
Gamma: Adjusts how much the Laguerre filter responds to price changes. Lower gamma values make the filter react more to recent prices, while higher values give more influence to older data, making the line smoother but slower to respond.
Volatility Length: Period used to calculate standard deviation
Volatility Smoothing Length: EMA smoothing length for standard deviation
Multiplier: Scales the width of the bands based on volatility
📈 Visual Output
Laguerre Filter Line: Plots the laguerre filter line, colored dynamically based on signal direction (green for bullish, purple for bearish)
Upper & Lower Bands: Volatility-based bands that adjust with market conditions. (green for bullish, purple for bearish)
Glow Effect: Optional glow layer to enhance visibility of the laguerre filter trend line (green for bullish, purple for bearish)
Bar Coloring: Candlesticks and bar colors reflect the active signal state for fast visual interpretation (green for bullish, purple for bearish)
How to Use
Apply the indicator to your chart and monitor for signal events:
Long Signal: When price closes above the upper band
Short Signal: When price closes below the lower band
🔔 Alerts
This indicator supports optional alert conditions you can enable for:
Long Signal: Close price crossing above the upper band
Short Signal: Close price crossing below the lower band
⚠️ Disclaimer:
This indicator is intended for educational and informational purposes only. Trading/investing involves risk, and past performance does not guarantee future results. Always test and evaluate indicators/strategies before applying them in live markets. Use at your own risk.
Time Specific Standard Deviation Zones(10 am - 4hr candle)This indicator is designed for intraday traders who want to visualize volatility-based zones around the 10:00 AM New York session open, plotted precisely from 10:00 AM to 2:00 PM EST.
✅ Key Features:
📦 Automatically draws mirrored Standard Deviation (SD) zones:
0.5 SD, 1 SD, 1.5 SD above and below the 10AM open
Open Line reference for mean reversion tracking
📐 Internal Fibonacci Levels within each zone:
0.236, 0.382, 0.5, 0.618, 0.786
⏱️ Works across any timeframe
📊 Ideal for:
Breakout traders
Volatility compression strategies
Statistical mean reversion models
🔧 Built using precise New York session timestamps, ensuring accuracy across time zones and resolutions.

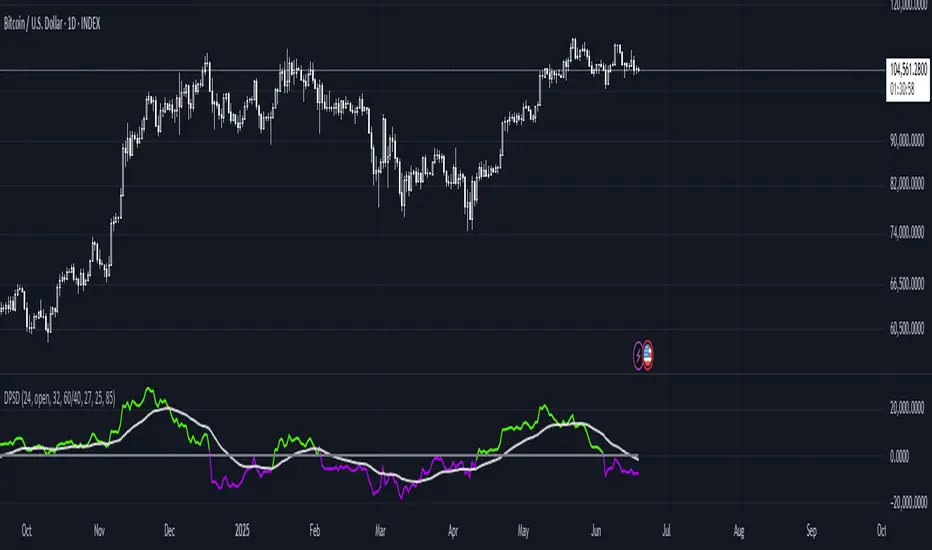
Spent Output Profit Ratio (SOPR) Z-Score | [DeV]SOPR Z-Score
The Spent Output Profit Ratio (SOPR) is an advanced on-chain metric designed to provide deep insights into Bitcoin market dynamics by measuring the ratio between the combined USD value of all Bitcoin outputs spent on a given day and their combined USD value at the time of creation (typically, their purchase price). As a member of the Realized Profit/Loss family of metrics, SOPR offers a window into aggregate seller behavior, effectively representing the USD amount received by sellers divided by the USD amount they originally paid. This indicator enhances this metric by normalizing it into a Z-Score, enabling a statistically robust analysis of market sentiment relative to historical trends, augmented by a suite of customizable features for precision and visualization.
SOPR Settings -
Lookback Length (Default: 150 days): Determines the historical window for calculating the Z-Score’s mean and standard deviation. A longer lookback captures broader market cycles, providing a stable baseline for identifying extreme deviations, which is particularly valuable for long-term strategic analysis.
Smoothing Period (Default: 100 days): Applies an EMA to the raw SOPR, balancing responsiveness to recent changes with noise reduction. This extended smoothing period ensures the indicator focuses on sustained shifts in seller behavior, ideal for institutional-grade trend analysis.
Moving Average Settings -
MA Lookback Length (Default: 90 days): Sets the period for the Z-Score’s moving average, offering a shorter-term trend signal relative to the 150-day Z-Score lookback. This contrast enhances the ability to detect momentum shifts within the broader context.
MA Type (Default: EMA): Provides six moving average types, from the simple SMA to the volume-weighted VWMA. The default EMA strikes an optimal balance between smoothness and responsiveness, while alternatives like HMA (Hull) or VWMA (volume-weighted) allow for specialized applications, such as emphasizing recent price action or incorporating volume dynamics.
Display Settings -
Show Moving Average (Default: True): Toggles the visibility of the Z-Score MA plot, enabling users to focus solely on the raw Z-Score when preferred.
Show Background Colors (Default: True): Activates dynamic background shading, enhancing visual interpretation of market regimes.
Background Color Source (Default: SOPR): Allows users to tie the background color to either the SOPR Z-Score’s midline (reflecting adjustedZScore > 0) or the MA’s trend direction (zScoreMA > zScoreMA ). This dual-source option provides flexibility to align the visual context with the primary analytical focus.
Analytical Applications -
Bear Market Resistance: When the Z-Score approaches or exceeds zero (raw SOPR near 1), it often signals resistance as sellers rush to exit at break-even, a pattern historically observed during downtrends. A rising Z-Score MA crossing zero can confirm this pressure.
Bull Market Support: Conversely, a Z-Score dropping below zero in uptrends indicates reluctance to sell at a loss, forming support as sell pressure diminishes. The MA’s bullish coloring reinforces confirmation of renewed buying interest.
Extreme Deviations: Values significantly above or below zero highlight overbought or oversold conditions, respectively, offering opportunities for contrarian positioning when paired with other on-chain or price-based metrics.

Standard Deviation (fadi)The Standard Deviation indicator uses standard deviation to map out price movements. Standard deviation measures how much prices stray from their average—small values mean steady trends, large ones mean wild swings. Drawing from up to 20 years of data, it plots key levels using customizable Fibonacci lines tied to that standard deviation, giving traders a snapshot of typical price behavior.
These levels align with a bell curve: about 68% of price moves stay within 1 standard deviation, 95% within roughly 2, and 99.7% within roughly 3. When prices break past the 1 StDev line, they’re outliers—only 32% of moves go that far. Prices often snap back to these lines or the average, though the reversal might not happen the same day.
How Traders Use It
If prices surge past the 1 StDev line, traders might wait for momentum to fade, then trade the pullback to that line or the average, setting a target and stop.
If prices dip below, they might buy, anticipating a bounce—sometimes a day or two later. It’s a tool to spot overstretched prices likely to revert and/or measure the odds of continuation.
Settings
Higher Timeframe: Sets the Higher Timeframe to calculate the Standard Deviation for
Show Levels for the Last X Days: Displays levels for the specified number of days.
Based on X Period: Number of days to calculate standard deviation (e.g., 20 years ≈ 5,040 days). Larger periods smooth out daily level changes.
Mirror Levels on the Other Side: Plots symmetric positive and negative levels around the average.
Fibonacci Levels Settings: Defines which levels and line styles to show. With mirroring, negative values aren’t needed.
Background Transparency: Turn on Background color derived from the level colors with the specified transparency
Overrides: Lets advanced users input custom standard deviations for specific tickers (e.g., NQ1! at 0.01296).

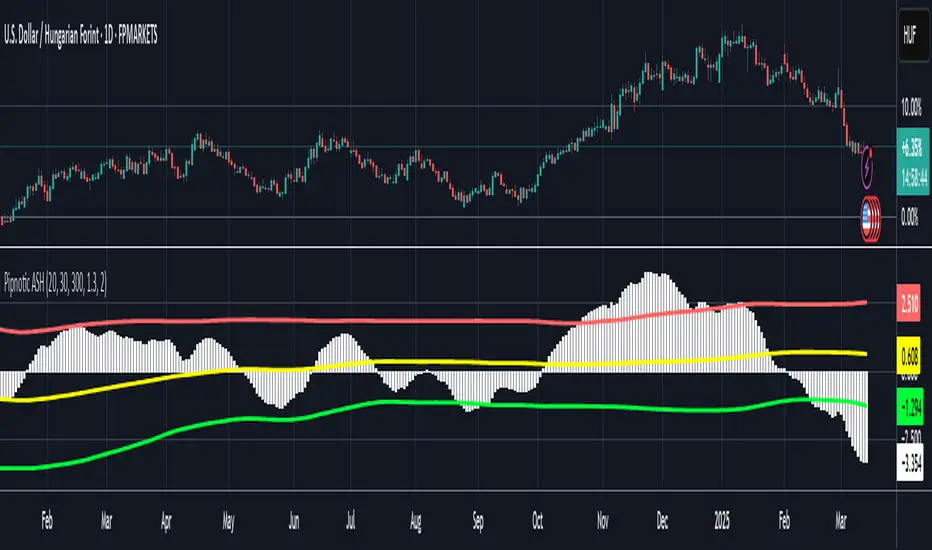
Pipnotic Asset Strength HistogramDescription
The Pipnotic Asset Strength Histogram (ASH) was originally developed to provide traders with a structured approach to identifying market cycles and momentum shifts. Due to increasing demand, it has been adapted for TradingView, ensuring traders can leverage its insights directly on their charts. This tool is particularly useful for spotting divergences, trend reversals, and price imbalances, making it an essential addition for traders who rely on momentum and strength-based analysis. We will continue to actively develop this indicator to enhance its functionality and accuracy.
How It Works
The ASH follows a systematic approach to analyse price movements and highlight key market dynamics:
Momentum & Cycle Analysis
Evaluates price movements using a dual-smoothing methodology.
Identifies shifts in momentum that indicate potential reversals or trend continuations.
Divergence Detection
Highlights instances where price action diverges from underlying momentum, signalling potential trading opportunities.
Helps confirm trade setups based on hidden and regular divergences.
Dynamic Visualization & Alerts
Plots a histogram to provide a clear visual representation of market strength.
Identifies buy and sell zones based on historical price deviations.
Updates dynamically, adapting to changing market conditions to maintain relevance.
Key Features & Inputs
Customizable Sensitivity: Traders can fine-tune cycle smoothing values to match different trading styles.
Clear Buy & Sell Zones: Highlights potential high-probability trading areas based on historical deviations.
Flexible Visualization: Adjustable histogram colours, line width, and mean deviation settings for optimal clarity.
Adaptability Across Markets: Works effectively on stocks, forex, crypto, and commodities.
Compatible with Various Trading Strategies: Can be used alongside trend-following, breakout, and reversal strategies for enhanced trade confirmation.
Benefits of Using the Pipnotic ASH Indicator
Market Timing: Helps traders identify optimal entry and exit points based on momentum shifts.
Reduces Subjectivity: Automates the detection of market strength and divergence, ensuring consistency.
Adapts to Market Conditions: Adjusts dynamically to price changes, ensuring relevant signals.
Saves Time & Effort: Eliminates the need for manual divergence analysis.
Works on All Timeframes: Suitable for scalping, swing trading, and long-term investing.
The Pipnotic Asset Strength Histogram is designed to streamline market analysis by providing clear, actionable insights into momentum shifts and divergences. Whether you're a day trader or a long-term investor, this tool helps refine your decision-making and enhance your trading strategy.
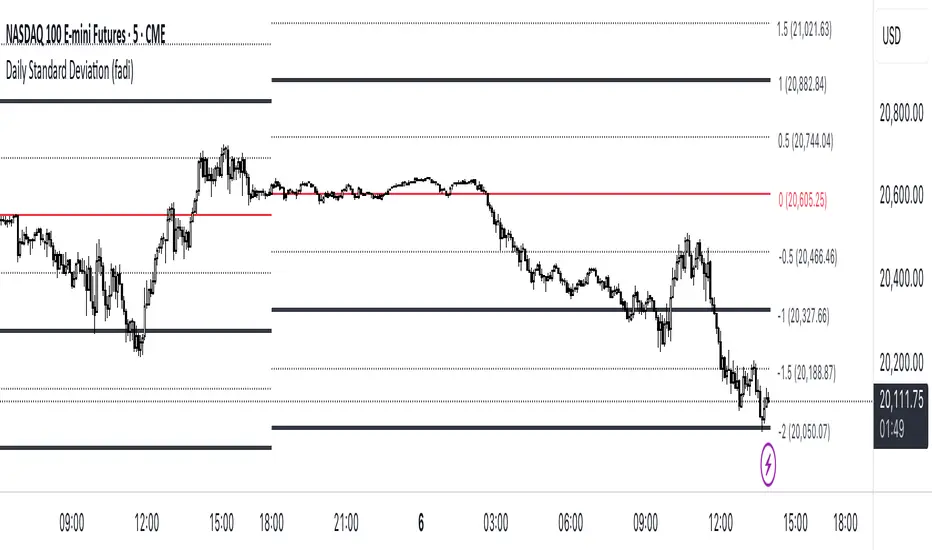
Daily Standard Deviation (fadi)The Daily Standard Deviation indicator uses standard deviation to map out daily price movements. Standard deviation measures how much prices stray from their average—small values mean steady trends, large ones mean wild swings. Drawing from up to 20 years of data, it plots key levels using customizable Fibonacci lines tied to that standard deviation, giving traders a snapshot of typical price behavior.
These levels align with a bell curve: about 68% of price moves stay within 1 standard deviation, 95% within roughly 2, and 99.7% within roughly 3. When prices break past the 1 StDev line, they’re outliers—only 32% of moves go that far. Prices often snap back to these lines or the average, though the reversal might not happen the same day.
How Traders Use It
If prices surge past the 1 StDev line, traders might wait for momentum to fade, then trade the pullback to that line or the average, setting a target and stop.
If prices dip below, they might buy, anticipating a bounce—sometimes a day or two later. It’s a tool to spot overstretched prices likely to revert and/or measure the odds of continuation.
Settings
Open Hour: Sets the trading day’s start (default: 18:00 EST).
Show Levels for the Last X Days: Displays levels for the specified number of days.
Based on X Period: Number of days to calculate standard deviation (e.g., 20 years ≈ 5,040 days). Larger periods smooth out daily level changes.
Mirror Levels on the Other Side: Plots symmetric positive and negative levels around the average.
Fibonacci Levels Settings: Defines which levels and line styles to show. With mirroring, negative values aren’t needed.
Overrides: Lets advanced users input custom standard deviations for specific tickers (e.g., NQ1! at 0.01296).
Midnight Opening Ranges[TDL]Midnight Opening Range Indicator for TradingView
Description:
The Midnight Opening Range Indicator as taught by Micheal J. Huddleston is a powerful tool designed for traders who want to analyze price action during the critical midnight to 00:30 timeframe. This indicator highlights the opening range for both the current day and previous days, providing valuable insights into market behavior during this specific period. It also calculates and displays deviations from the opening range, as well as allows for custom opening prices to be set, making it highly adaptable to your trading strategy.
Key Features:
Today's Opening Range (00:00 - 00:30):
The indicator plots the high and low of the price range between 00:00 and 00:30 for the current day.
This range is highlighted on the chart, making it easy to identify the initial market movement and potential support/resistance levels.
Previous Days' Opening Ranges:
The indicator also displays the opening ranges for previous days, allowing you to how price reacts off of previous days ranges not just todays.
This feature helps in identifying patterns or recurring behaviors in the market in which price uses this range and previous days ranges throughout the trading day.
Deviations from the Opening Range:
The indicator calculates and plots deviations from the opening range, both above and below the high and low of the range.
These deviations can be used to identify potential breakout or reversal points, giving you an edge in anticipating market moves.
Custom Opening Prices:
The indicator allows you to set custom opening prices, which can be useful if you want to analyze the market based on a specific reference point rather than the default midnight opening.
This feature is particularly useful for traders who follow alternative trading sessions or have specific entry criteria.
Customizable Visuals:
The indicator offers customizable colors and styles for the opening range, deviations, and custom opening prices, allowing you to tailor the visual representation to your preferences.
How to Use:
Identify Key Levels: Use the highlighted opening range to identify key support and resistance levels for the day.
Monitor Deviations: Watch for price movements beyond the opening range deviations to spot potential breakouts or reversals.
Previous Range Data: Use previous days to identify areas of potential AMD.
Set Custom Prices: Adjust the custom opening price to align with your trading strategy or session preferences.
Ideal For:
Day Traders: Perfect for traders who focus on the early hours of the market to capture initial momentum.
Swing Traders: Useful for identifying key levels that could influence price action over several days.
Algorithmic Traders: Can be integrated into automated trading systems to trigger trades based on the opening range and deviations.
Conclusion:
The Midnight Opening Range Indicator is an essential tool for any trader looking to gain an edge in the market by focusing on the critical midnight to 00:30 timeframe. With its ability to highlight opening ranges, calculate deviations, and accommodate custom opening prices, this indicator provides a comprehensive view of market behavior during this pivotal period. Whether you're a day trader, swing trader, or algorithmic trader, this indicator will help you make more informed trading decisions.

Correlation Coefficient Master TableThe Correlation Coefficient Master Table is a comprehensive tool designed to calculate and visualize the correlation coefficient between a selected base asset and multiple other assets over various time periods. It provides traders and analysts with a clear understanding of the relationships between assets, enabling them to analyze trends, diversification opportunities, and market dynamics. You can define key parameters such as the base asset’s data source (e.g., close price), the assets to compare against (up to six symbols), and multiple lookback periods for granular analysis.
The indicator calculates the covariance and normalizes it by the product of the standard deviations. The correlation coefficient ranges from -1 to +1, with +1 indicating a perfect positive relationship, -1 a perfect negative relationship, and 0 no relationship.
You can specify the lookback periods (e.g., 15, 30, 90, or 120 bars) to tailor the calculation to their analysis needs. The results are visualized as both a line plot and a table. The line plot shows the correlation over the primary lookback period (the Chart Length), which can be used to inspect a certain length close up, or could be used in conjunction with the table to provide you with five lookback periods at once for the same base asset. The dynamically created table provides a detailed breakdown of correlation values for up to six target assets across the four user-defined lengths. The table’s cells are formatted with rounded values and color-coded for easy interpretation.
This indicator is ideal for traders, portfolio managers, and market researchers who need an in-depth understanding of asset interdependencies. By providing both the numerical correlation coefficients and their visual representation, users can easily identify patterns, assess diversification strategies, and monitor correlations across multiple timeframes, making it a valuable tool for decision-making.

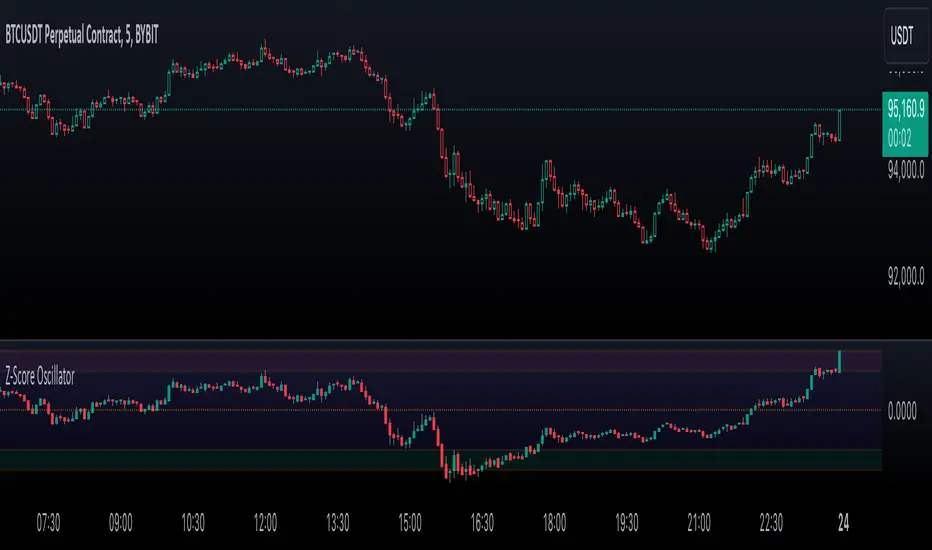
Enhanced Price Z-Score OscillatorThe Enhanced Price Z-Score Oscillator by tkarolak is a powerful tool that transforms raw price data into an easy-to-understand statistical visualization using Z-Score-derived candlesticks. Simply put, it shows how far prices stray from their average in terms of standard deviations (Z-Scores), helping traders identify when prices are unusually high (overbought) or unusually low (oversold).
The indicator’s default feature displays Z-Score Candlesticks, where each candle reflects the statistical “distance” of the open, high, low, and close prices from their average. This creates a visual map of market extremes and potential reversal points. For added flexibility, you can also switch to Z-Score line plots based on either Close prices or OHLC4 averages.
With clear threshold lines (±2σ and ±3σ) marking moderate and extreme price deviations, and color-coded zones to highlight overbought and oversold areas, the oscillator simplifies complex statistical concepts into actionable trading insights.
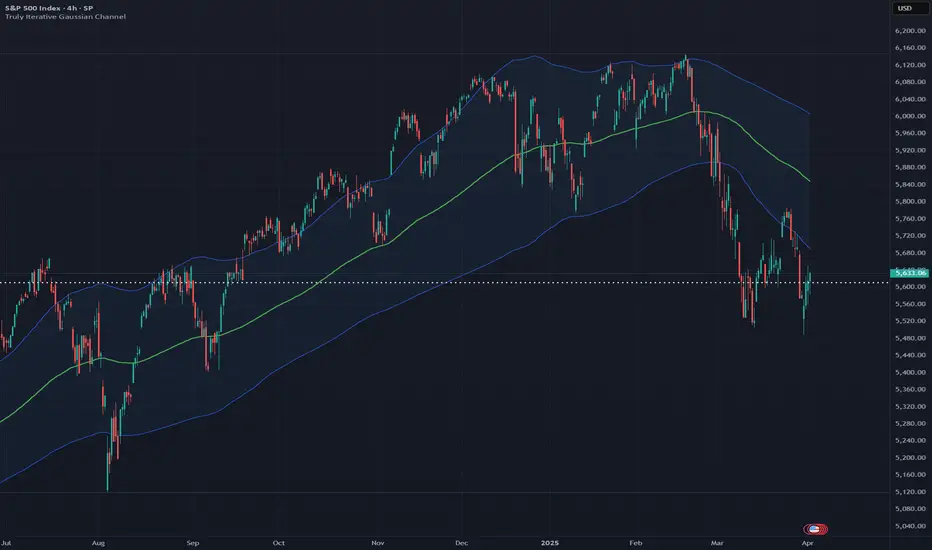
Truly Iterative Gaussian ChannelOVERVIEW
The Truly Iterative Gaussian Channel is a robust channeling system that integrates a Gaussian smoothing kernel with a rolling standard deviation to create dynamically adaptive upper and lower boundaries around price. This indicator provides a smooth, yet responsive representation of price movements while minimizing lag and dynamically adjusting channel width to reflect real-time market volatility. Its versatility makes it effective across various timeframes and trading styles, offering significant potential for experimentation and integration into advanced trading systems.
TRADING USES
The Gaussian indicator can be used for multiple trading strategies. Trend following relies on the middle Gaussian line to gauge trend direction: prices above this line indicate bullish momentum, while prices below signal bearish momentum. The upper and lower boundaries act as dynamic support and resistance levels, offering breakout or pullback entry opportunities. Mean reversion focuses on identifying reversal setups when price approaches or breaches the outer boundaries, aiming for a return to the Gaussian centerline. Volatility filtering helps assess market conditions, with narrow channels indicating low volatility or consolidation and suggesting fewer trading opportunities or an impending breakout. Adaptive risk management uses channel width to adjust for market volatility, with wider channels signaling higher risk and tighter channels indicating lower volatility and potentially safer entry points.
THEORY
Gaussian kernel smoothing, derived from the Gaussian normal distribution, is a cornerstone of probability and statistics, valued for its ability to reduce noise while preserving critical signal features. In this indicator, it ensures price movements are smoothed with precision, minimizing distortion while maintaining responsiveness to market dynamics.
The rolling standard deviation complements this by dynamically measuring price dispersion from the mean, enabling the channel to adapt in real time to changing market conditions. This combination leverages the mathematical correctness of both tools to balance smoothness and adaptability.
An iterative framework processes data efficiently, bar by bar, without recalculating historical value to ensure reliability and preventing repainting to create a mathematically grounded channel system suitable for a wide range of market environments.
The Gaussian channel excels at filtering noise while remaining responsive to price action, providing traders with a dependable tool for identifying trends, reversals, and volatility shifts with consistency and precision.
CALIBRATION
Calibration of the Gaussian channel involves adjusting its length to modify sensitivity and adaptability based on trading style. Shorter lengths (e.g., 50-100) are ideal for intraday traders seeking quick responses to price fluctuations. Medium lengths (e.g., 150-200) cater to swing traders aiming to capture broader market trends. Longer lengths (e.g., 250-400+) are better suited for positional traders focusing on long-term price movements and stability.
MARKET USAGE
Stock, Forex, Crypto, Commodities, and Indices.
Dema Percentile Standard DeviationDema Percentile Standard Deviation
The Dema Percentile Standard Deviation indicator is a robust tool designed to identify and follow trends in financial markets.
How it works?
This code is straightforward and simple:
The price is smoothed using a DEMA (Double Exponential Moving Average).
Percentiles are then calculated on that DEMA.
When the closing price is below the lower percentile, it signals a potential short.
When the closing price is above the upper percentile and the Standard Deviation of the lower percentile, it signals a potential long.
Settings
Dema/Percentile/SD/EMA Length's: Defines the period over which calculations are made.
Dema Source: The source of the price data used in calculations.
Percentiles: Selects the type of percentile used in calculations (options include 60/40, 60/45, 55/40, 55/45). In these settings, 60 and 55 determine percentile for long signals, while 45 and 40 determine percentile for short signals.
Features
Fully Customizable
Fully Customizable: Customize colors to display for long/short signals.
Display Options: Choose to show long/short signals as a background color, as a line on price action, or as trend momentum in a separate window.
EMA for Confluence: An EMA can be used for early entries/exits for added signal confirmation, but it may introduce noise—use with caution!
Built-in Alerts.
Indicator on Diffrent Assets
INDEX:BTCUSD 1D Chart (6 high 56 27 60/45 14)
CRYPTO:SOLUSD 1D Chart (24 open 31 20 60/40 14)
CRYPTO:RUNEUSD 1D Chart (10 close 56 14 60/40 14)
Remember no indicator would on all assets with default setting so FAFO with setting to get your desired signal.
STANDARD DEVIATION INDICATOR BY WISE TRADERWISE TRADER STANDARD DEVIATION SETUP: The Ultimate Volatility and Trend Analysis Tool
Unlock the power of STANDARD DEVIATIONS like never before with the this indicator, a versatile and comprehensive tool designed for traders who seek deeper insights into market volatility, trend strength, and price action. This advanced indicator simultaneously plots three sets of customizable Deviations, each with unique settings for moving average types, standard deviations, and periods. Whether you’re a swing trader, day trader, or long-term investor, the STANDARD DEVIATION indicator provides a dynamic way to spot potential reversals, breakouts, and trend-following opportunities.
Key Features:
STANDARD DEVIATIONS Configuration : Monitor three different Bollinger Bands at the same time, allowing for multi-timeframe analysis within a single chart.
Customizable Moving Average Types: Choose from SMA, EMA, SMMA (RMA), WMA, and VWMA to calculate the basis of each band according to your preferred method.
Dynamic Standard Deviations: Set different standard deviation multipliers for each band to fine-tune sensitivity for various market conditions.
Visual Clarity: Color-coded bands with adjustable thicknesses provide a clear view of upper and lower boundaries, along with fill backgrounds to highlight price ranges effectively.
Enhanced Trend Detection: Identify potential trend continuation, consolidation, or reversal zones based on the position and interaction of price with the three bands.
Offset Adjustment: Shift the bands forward or backward to analyze future or past price movements more effectively.
Why Use Triple STANDARD DEVIATIONS ?
STANDARD DEVIATIONS are a popular choice among traders for measuring volatility and anticipating potential price movements. This indicator takes STANDARD DEVIATIONS to the next level by allowing you to customize and analyze three distinct bands simultaneously, providing an unparalleled view of market dynamics. Use it to:
Spot Volatility Expansion and Contraction: Track periods of high and low volatility as prices move toward or away from the bands.
Identify Overbought or Oversold Conditions: Monitor when prices reach extreme levels compared to historical volatility to gauge potential reversal points.
Validate Breakouts: Confirm the strength of a breakout when prices move beyond the outer bands.
Optimize Risk Management: Enhance your strategy's risk-reward ratio by dynamically adjusting stop-loss and take-profit levels based on band positions.
Ideal For:
Forex, Stocks, Cryptocurrencies, and Commodities Traders looking to enhance their technical analysis.
Scalpers and Day Traders who need rapid insights into market conditions.
Swing Traders and Long-Term Investors seeking to confirm entry and exit points.
Trend Followers and Mean Reversion Traders interested in combining both strategies for maximum profitability.
Harness the full potential of STANDARD DEVIATIONS with this multi-dimensional approach. The "STANDARD DEVIATIONS " indicator by WISE TRADER will become an essential part of your trading arsenal, helping you make more informed decisions, reduce risks, and seize profitable opportunities.
Who is WISE TRADER ?
Wise Trader is a highly skilled trader who launched his channel in 2020 during the COVID-19 pandemic, quickly building a loyal following. With thousands of paid subscribed members and over 70,000 YouTube subscribers, Wise Trader has become a trusted authority in the trading world. He is known for his ability to navigate significant events, such as the Indian elections and stock market crashes, providing his audience with valuable insights into market movements and volatility. With a deep understanding of macroeconomics and its correlation to global stock markets, Wise Trader shares informed strategies that help traders make better decisions. His content covers technical analysis, trading setups, economic indicators, and market trends, offering a comprehensive approach to understanding financial markets. The channel serves as a go-to resource for traders who want to enhance their skills and stay informed about key market developments.

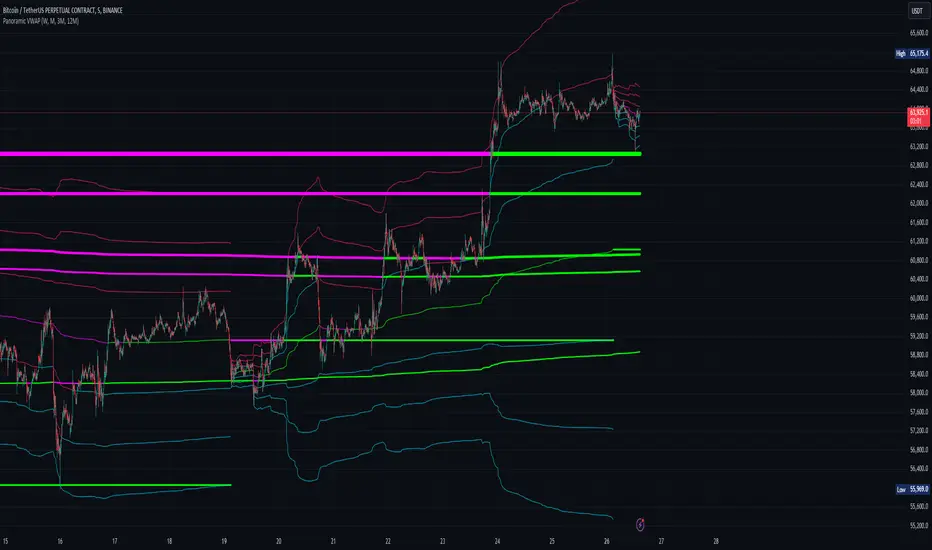
Panoramic VWAP### Panoramic VWAP Indicator Overview
The Panoramic VWAP indicator provides a way to display up to four Volume Weighted Average Price (VWAP) lines on a chart, each anchored to different timeframes. This indicator also includes options for displaying standard deviation bands and close lines, offering a comprehensive view of price action across multiple time horizons.
### Key Features
Quad VWAPs : The indicator allows for the display of four VWAP lines simultaneously. Each line can be set to a different timeframe, enabling traders to analyze market conditions across various periods on a single chart.
Standard Deviation Bands : Users can enable bands around each VWAP line, which represent standard deviations or percentage levels from the VWAP. These bands help in assessing volatility and identifying potential overbought or oversold conditions.
Close Lines : The indicator includes an option to show close lines, marking the price's closing level relative to the VWAP. This feature is useful for examining how the market closes in relation to VWAP, which can be important for understanding trend strength or potential reversals.
### How It Looks
VWAP Lines : Multiple VWAP lines are displayed, each reflecting different timeframes. The lines change color depending on whether the price is above or below the VWAP, indicating bullish or bearish momentum.
Bands : Optional bands around the VWAP lines provide a visual indication of volatility, with the potential to identify overbought or oversold areas.
Close Lines : These lines represent the price's closing level relative to the VWAP and can be displayed to add further context to the analysis.
### How to Use It
Trend Analysis :
- Price above a VWAP line indicates bullish momentum .
- Price below a VWAP line suggests bearish momentum .
Support and Resistance :
- VWAP lines often act as dynamic support and resistance. Price approaching a VWAP line from above may find support, while approaching from below may encounter resistance.
Volatility Assessment :
- Bands around the VWAP lines can signal areas of potential reversal. Upper bands may indicate overbought conditions, while lower bands may indicate oversold conditions.
Multiple Timeframe Analysis :
- The ability to display VWAPs from different timeframes simultaneously allows for the identification of confluence zones, where multiple VWAP levels align, indicating potentially significant support or resistance levels.
Customization :
- The indicator settings are customizable, allowing users to choose which VWAP lines, bands, and close lines to display, along with adjustments for visual preferences like line thickness and colors.
### Practical Application
Intraday Trading : Traders can use the VWAPs and bands to identify potential entry and exit points during the trading day based on price interactions with these levels.
Swing Trading : Monitoring VWAP lines across different timeframes can help identify key levels where price might reverse or gain momentum, aiding in decisions about holding or exiting positions.
Long-Term Analysis : VWAP lines on higher timeframes can serve as dynamic support or resistance levels, providing context for long-term trend analysis and investment decisions.
The Panoramic VWAP indicator allows for a detailed analysis of price trends and levels across multiple timeframes, combining VWAPs, standard deviation bands, and close lines in a single, customizable tool.
Options Overlay [Pro] IVR IV Skew Delta Exp.mv MurreyMath Expiry
𝗧𝗵𝗲 𝗳𝗶𝗿𝘀𝘁 𝗿𝗲𝗮𝗹 𝗼𝗽𝘁𝗶𝗼𝗻𝘀 𝗱𝗮𝘁𝗮 𝗶𝗻𝗱𝗶𝗰𝗮𝘁𝗼𝗿 𝗼𝗻 𝗧𝗿𝗮𝗱𝗶𝗻𝗴𝗩𝗶𝗲𝘄, 𝗮𝘃𝗮𝗶𝗹𝗮𝗯𝗹𝗲 𝗳𝗼𝗿 𝗼𝘃𝗲𝗿 𝟭𝟱𝟬+ 𝗹𝗶𝗾𝘂𝗶𝗱 𝗨𝗦 𝗺𝗮𝗿𝗸𝗲𝘁 𝘀𝘆𝗺𝗯𝗼𝗹𝘀.
🔃 Auto-Updating Option Metrics without refresh!
🍒 Developed and maintained by option traders for option traders.
📈 Specifically designed for TradingView users who trade options.
Our indicator provides essential key metrics such as:
✅ IVRank
✅ IVx
✅ 5-Day IVx Change
✅ Delta curves and interpolated distances
✅ Expected move curve
✅ Standard deviation (STD1) curve
✅ Vertical Pricing Skew
✅ Horizontal IVx Skew
✅ Delta Skew
like TastyTrade, TOS, IBKR etc, but in a much more visually intuitive way. See detailed descriptions below.
If this isn't enough, we also include a unique grid system designed specifically for options traders. This package features our innovative dynamic grid system:
✅ Enhanced Murrey Math levels (horizontal scale)
✅ Options expirations (vertical scale)
Designed to help you assess market conditions and make well-informed trading decisions, this tool is an essential addition for every serious options trader!
Ticker Information:
This indicator is currently implemented for more than 150 liquid US market tickers and we are continuously expanding the list:
SP:SPX AMEX:SPY NASDAQ:QQQ NASDAQ:TLT AMEX:GLD
NYSE:AA NASDAQ:AAL NASDAQ:AAPL NYSE:ABBV NASDAQ:ABNB NASDAQ:AMD NASDAQ:AMZN AMEX:ARKK NASDAQ:AVGO NYSE:AXP NYSE:BA NYSE:BABA NYSE:BAC NASDAQ:BIDU AMEX:BITO NYSE:BMY NYSE:BP NASDAQ:BYND NYSE:C NYSE:CAT NYSE:CCJ NYSE:CCL NASDAQ:COIN NYSE:COP NASDAQ:COST NYSE:CRM NASDAQ:CRWD NASDAQ:CSCO NYSE:CVNA NYSE:CVS NYSE:CVX NYSE:DAL NASDAQ:DBX AMEX:DIA NYSE:DIS NASDAQ:DKNG NASDAQ:EBAY NASDAQ:ETSY NASDAQ:EXPE NYSE:F NYSE:FCX NYSE:FDX AMEX:FXI AMEX:GDX AMEX:GDXJ NYSE:GE NYSE:GM NYSE:GME NYSE:GOLD NASDAQ:GOOG NASDAQ:GOOGL NYSE:GPS NYSE:GS NASDAQ:HOOD NYSE:IBM NASDAQ:IEF NASDAQ:INTC AMEX:IWM NASDAQ:JD NYSE:JNJ NYSE:JPM NYSE:JWN NYSE:KO NYSE:LLY NYSE:LOW NYSE:LVS NYSE:MA NASDAQ:MARA NYSE:MCD NYSE:MET NASDAQ:META NYSE:MGM NYSE:MMM NYSE:MPC NYSE:MRK NASDAQ:MRNA NYSE:MRO NASDAQ:MRVL NYSE:MS NASDAQ:MSFT AMEX:MSOS NYSE:NCLH NASDAQ:NDX NYSE:NET NASDAQ:NFLX NYSE:NIO NYSE:NKE NASDAQ:NVDA NASDAQ:ON NYSE:ORCL NYSE:OXY NASDAQ:PEP NYSE:PFE NYSE:PINS NYSE:PLTR NASDAQ:PTON NASDAQ:PYPL NASDAQ:QCOM NYSE:RBLX NYSE:RCL NASDAQ:RIOT NASDAQ:RIVN NASDAQ:ROKU NASDAQ:SBUX NYSE:SHOP AMEX:SLV NASDAQ:SMCI NASDAQ:SMH NYSE:SNAP NYSE:SQ NYSE:T NYSE:TGT NASDAQ:TQQQ NASDAQ:TSLA NYSE:TSM NASDAQ:TTD NASDAQ:TXN NYSE:U NASDAQ:UAL NYSE:UBER AMEX:UNG NYSE:UPS NASDAQ:UPST AMEX:USO NYSE:V AMEX:VXX NYSE:VZ NASDAQ:WBA NYSE:WFC NYSE:WMT NASDAQ:WYNN NYSE:X AMEX:XHB AMEX:XLE AMEX:XLF AMEX:XLI AMEX:XLK AMEX:XLP AMEX:XLU AMEX:XLV AMEX:XLY NYSE:XOM NYSE:XPEV CBOE:XSP NASDAQ:ZM
How does the indicator work and why is it unique?
This Pine Script indicator is a complex tool designed to provide various option metrics and visualization tools for options market traders. The indicator extracts raw options data from an external data provider (ORATS), processes and refines the delayed data package using pineseed, and sends it to TradingView, visualizing the data using specific formulas (see detailed below) or interpolated values (e.g., delta distances). This method of incorporating options data into a visualization framework is unique and entirely innovative on TradingView.
The indicator aims to offer a comprehensive view of the current state of options for the implemented instruments, including implied volatility (IV), IV rank (IVR), options skew, and expected market movements, which are objectively measured as detailed below.
The options metrics we display may be familiar to options traders from various major brokerage platforms such as TastyTrade, IBKR, TOS, Tradier, TD Ameritrade, Schwab, etc.
🟨 𝗗𝗘𝗧𝗔𝗜𝗟𝗘𝗗 𝗗𝗢𝗖𝗨𝗠𝗘𝗡𝗧𝗔𝗧𝗜𝗢𝗡 🟨
🔶 Auto-Updating Option Metrics and Curved Lines
🔹 Interpolated DELTA Curves (16,20,25,30,40)
In our indicator, the curve layer settings allow you to choose the delta value for displaying the delta curve: 16, 20, 25, 30, or even 40. The color of the curve can be customized, and you can also hide the delta curve by selecting the "-" option.
It's important to mention that we display interpolated deltas from the actual option chain of the underlying asset using the Black-Scholes model. This ensures that the 16 delta truly reflects the theoretical, but accurate, 16 delta distance. (For example, deltas shown by brokerages for individual strikes are rounded; a 0.16 delta might actually be 0.1625.)
🔹 Expected Move Curve (Exp.mv)
The expected move is the predicted dollar change in the underlying stock's price by a given option's expiration date, with 68% certainty. It is calculated using the expiration's pricing and implied volatility levels. We chose the TastyTrade method for calculating expected move, as we found it to be the most expressive.
Expected Move Calculation
Expected Move = (ATM straddle price x 0.6) + (1st OTM strangle price x 0.3) + (2nd OTM strangle price x 0.1)
For example , if stock XYZ is trading at 121 and the ATM straddle is 4.40, the 120/122 strangle is 3.46, and the 119/123 strangle is 2.66, the expected move is calculated as follows: 4.40 x 0.60 = 2.64; 3.46 x 0.30 = 1.04; 2.66 x 0.10 = 0.27; Expected move = 2.64 + 1.04 + 0.27 = ±3.9
In this example below, the TastyTrade platform indicates the expected move on the option chain with a brown color, and the exact value is displayed behind the ± symbol for each expiration. By default, we also use brown for this indication, but this can be changed or the curve display can be turned off.
🔹 Standard Deviation Curve (1 STD)
One standard deviation of a stock encompasses approximately 68.2% of outcomes in a distribution of occurrences based on current implied volatility.
We use the expected move formula to calculate the one standard deviation range of a stock. This calculation is based on the days-to-expiration (DTE) of our option contract, the stock price, and the implied volatility of a stock:
Calculation:
Standard Deviation = Closing Price * Implied Volatility * sqrt(Days to Expiration / 365)
According to options literature, there is a 68% probability that the underlying asset will fall within this one standard deviation range at expiration.
If the 1 STD and Exp.mv displays are both enabled, the indicator fills the area between them with a light gray color. This is because both represent probability distributions that appear as a "bell curve" when graphed, making it visually appealing.
Tip and Note:
The 1 STD line might appear jagged at times , which does not indicate a problem with the indicator. This is normal immediately after market open (e.g., during the first data refresh of the day) or if the expirations are illiquid (e.g., weekly expirations). The 1 STD value is calculated based on the aggregated IVx for the expirations, and the aggregated IVx value for weekly expirations updates less frequently due to lower trading volume. In such cases, we recommend enabling the "Only Monthly Expirations" option to smooth out the bell curve.
∑ Quant Observation:
The values of the expected move and the 1st standard deviation (1STD) will not match because they use different calculation methods, even though both are referred to as representing 68% of the underlying asset's movement in options literature. The expected move is based on direct market pricing of ATM options. The 1STD, on the other hand, uses the averaged implied volatility (IVX) for the given expiration to determine its value. Based on our experience, it is better to consider the area between the expected move and the 1STD as the true representation of the original 68% rule.
🔶 IVR Dashboard Panel Rows
🔹 IVR (IV Rank)
The Implied Volatility Rank (IVR) indicator helps options traders assess the current level of implied volatility (IV) in comparison to the past 52 weeks. IVR is a useful metric to determine whether options are relatively cheap or expensive. This can guide traders on whether to buy or sell options. We calculate IVrank, like TastyTrade does.
IVR Calculation:
IV Rank = (current IV - 52 week IV low) / (52 week IV high - 52 week IV low)
IVR Levels and Interpretations:
IVR 0-10 (Green): Very low implied volatility rank. Options might be "cheap," potentially a good time to buy options.
IVR 10-35 (White): Normal implied volatility rank. Options pricing is relatively standard.
IVR 35-50 (Orange): Almost high implied volatility rank.
IVR 50-75 (Red): Definitely high implied volatility rank. Options might be "expensive," potentially a good time to sell options for higher premiums.
IVR above 75 (Highlighted Red): Ultra high implied volatility rank. Indicates very high levels, suggesting a favorable time for selling options.
The panel refreshes automatically if the symbol is implemented. You can hide the panel or change the position and size.
🔹IVx (Implied Volatility Index)
The Implied Volatility Index (IVx) displayed in the option chain is calculated similarly to the VIX. The Cboe uses standard and weekly SPX options to measure the expected volatility of the S&P 500. A similar method is utilized to calculate IVx for each option expiration cycle.
For our purposes on the IVR Panel, we aggregate the IVx values specifically for the 35-70 day monthly expiration cycle . This aggregated value is then presented in the screener and info panel, providing a clear and concise measure of implied volatility over this period.
IVx Color coding:
IVx above 30 is displayed in orange.
IVx above 60 is displayed in red
IVx on curve:
The IVx values for each expiration can be viewed by hovering the mouse over the colored tooltip labels above the Curve.
IVx avg on IVR panel :
If the option is checked in the IVR panel settings, the IVR panel will display the average IVx values up to the optimal expiration.
Important Note:
The IVx value alone does not provide sufficient context. There are stocks that inherently exhibit high IVx values. Therefore, it is crucial to consider IVx in conjunction with the Implied Volatility Rank (IVR), which measures the IVx relative to its own historical values. This combined view helps in accurately assessing the significance of the IVx in relation to the specific stock's typical volatility behavior.
This indicator offers traders a comprehensive view of implied volatility, assisting them in making informed decisions by highlighting both the absolute and relative volatility measures.
🔹IVx 5 days change %
We are displaying the five-day change of the IV Index (IVx value). The IV Index 5-Day Change column provides quick insight into recent expansions or decreases in implied volatility over the last five trading days.
Traders who expect the value of options to decrease might view a decrease in IVX as a positive signal. Strategies such as Strangle and Ratio Spread can benefit from this decrease.
On the other hand, traders anticipating further increases in IVX will focus on the rising IVX values. Strategies like Calendar Spread or Diagonal Spread can take advantage of increasing implied volatility.
This indicator helps traders quickly assess changes in implied volatility, enabling them to make informed decisions based on their trading strategies and market expectations.
🔹 Vertical Pricing Skew
At TanukiTrade, Vertical Pricing Skew refers to the difference in pricing between put and call options with the same expiration date at the same distance (at expected move). We analyze this skew to understand market sentiment. This is the same formula used by TastyTrade for calculations.
We calculate the interpolated strike price based on the expected move , taking into account the neighboring option prices and their distances. This allows us to accurately determine whether the CALL or PUT options are more expensive.
PUT Skew (red): Put options are more expensive than call options, indicating the market expects a downward move (▽). If put options are more expensive by more than 20% at the same expected move distance, we color it lighter red.
CALL Skew (green): Call options are more expensive than put options, indicating the market expects an upward move (△). If call options are priced more than 30% higher at the examined expiration, we color it lighter green.
Vertical Skew on Curve:
The degree of vertical pricing skew for each expiration can be viewed by hovering over the points above the curve. Hover with mouse for more information.
Vertical Skew on IVR panel:
We focus on options with 35-70 days to expiration (DTE) for optimal analysis in case of vertical skew. Hover with mouse for more information.
This approach helps us gauge market expectations accurately, providing insights into potential price movements. Remember, we always evaluate the skew at the expected move using linear interpolation to determine the theoretical pricing of options.
🔹 Delta Skew 🌪️ (Twist)
We have a new metric that examines which monthly expiration indicates a "Delta Skew Twist" where the 16 delta deviates from the monthly STD. This is important because, under normal circumstances, the 16 delta is positioned between the expected move and the standard deviation (STD1) line (see Exp.mv & 1STD exact definitions above). However, if the interpolated 16 delta line exceeds the STD1 line either upwards or downwards, it represents a special case of vertical skew on the option chain.
Normal case : exp.move < delta16 < std1
Delta Skew Twist: exp.move < std1 < delta16
We indicate this with direction-specific colors (red/green) on the delta line. We also color the section of the delta curve affected by the delta skew in this case, even if you choose to display a lower delta, such as 30, instead of 16.
If "Colored Labels with Tooltips" is enabled, we also display a 🌪️ symbol in the tooltip for the expirations affected by Delta Skew.
If you have enabled the display of 'Vertical Pricing Skew' on the IVR Panel, a 🌪️ symbol will also appear next to the value of the vertical skew, and the tooltip will indicate from which expiration Delta Skew is observed.
🔹 Horizontal IVx Skew
In options pricing, it is typically expected that the implied volatility (IVx) increases for options with later expiration dates. This means that options further out in time are generally more expensive. At TanukiTrade, we refer to the phenomenon where this expectation is reversed—when the IVx decreases between two consecutive expirations—as Horizontal Skew or IVx Skew.
Horizontal IVx Skew occurs when: Front Expiry IVx < Back Expiry IVx
This scenario can create opportunities for traders who prefer diagonal or calendar strategies . Based on our experience, we categorize Horizontal Skew into two types:
Weekly Horizontal Skew:
When IVx skew is observed between two consecutive non-monthly expirations, the displayed value is the rounded-up percentage difference. On hover, the approximate location of this skew is also displayed. The precise location can be seen on this indicator.
Monthly Horizontal Skew:
When IVx skew is observed between two consecutive monthly expirations , the displayed value is the rounded-up percentage difference. On hover, the approximate location of this skew is also displayed. The precise location can be seen on our Overlay indicator.
The Monthly Vertical IVx skew is consistently more liquid than the weekly vertical IVx skew. Weekly Horizontal IVx Skew may not carry relevant information for symbols not included in the 'Weeklies & Volume Masters' preset in our Options Screener indicator.
If the options chain follows the normal IVx pattern, no skew value is displayed.
Color codes or tooltip labels above curve:
Gray - No horizontal skew;
Purple - Weekly horizontal skew;
BigBlue - Monthly horizontal skew
The display of monthly and weekly IVx skew can be toggled on or off on the IVR panel. However, if you want to disable the colored tooltips above the curve, this can only be done using the "Colored labels with tooltips" switch.
We indicate this range with colorful information bubbles above the upper STD line.
🔶 The Option Trader’s GRID System: Adaptive MurreyMath + Expiry Lines
At TanukiTrade, we utilize Enhanced MurreyMath and Expiry lines to create a dynamic grid system, unlike the basic built-in vertical grids in TradingView, which provide no insight into specific price levels or option expirations.
These grids are beneficial because they provide a structured layout, making important price levels visible on the chart. The grid automatically resizes as the underlying asset's volatility changes, helping traders identify expected movements for various option expirations.
The Option Trader’s GRID System part of this indicator can be used without limitations for all instruments . There are no type or other restrictions, and it automatically scales to fit every asset. Even if we haven't implemented the option metrics for a particular underlying asset, the GRID system will still function!
🔹 SETUP OF YOUR OPTIONS GRID SYSTEM
You can setup your new grid system in 3 easy steps!
STEP1: Hide default horizontal grid lines in TradingView
Right-click on an empty area of your chart, then select “Settings.” In the Chart settings -> Canvas -> Grid lines section, disable the display of horizontal lines to avoid distraction.
SETUP STEP2: Scaling fix
Right-click on the price scale on the right side, then select "Scale price chart only" to prevent the chart from scaling to the new horizontal lines!
STEP3: Enable Tanuki Options Grid
As a final step, make sure that both the vertical (MurreyMath) and horizontal (Expiry) lines are enabled in the Grid section of our indicator.
You are done, enjoy the new grid system!
🔹 HORIZONTAL: Enhanced MurreyMath Lines
Murrey Math lines are based on the principles observed by William Gann, renowned for his market symmetry forecasts. Gann's techniques, such as Gann Angles, have been adapted by Murrey to make them more accessible to ordinary investors. According to Murrey, markets often correct at specific price levels, and breakouts or returns to these levels can signal good entry points for trades.
At TanukiTrade, we enhance these price levels based on our experience , ensuring a clear display. We acknowledge that while MurreyMath lines aren't infallible predictions, they are useful for identifying likely price movements over a given period (e.g., one month) if the market trend aligns.
Our opinion: MurreyMath lines are not crystal balls (like no other tool). They should be used to identify that if we are trading in the right direction, the price is likely to reach the next unit step within a unit time (e.g. monthly expiration).
One unit step is the distance between Murrey Math lines, such as between the 0/8 and 1/8 lines. This interval helps identify different quadrants and is crucial for recognizing support and resistance levels.
Some option traders use Murrey Math lines to gauge the movement speed of an instrument over a unit time. A quadrant encompasses 4 unit steps.
Key levels, according to TanukiTrade, include:
Of course, the lines can be toggled on or off, and their default color can also be changed.
🔹 VERTICAL: Expiry Lines
The indicator can display monthly and weekly expirations as dashed lines, with customizable colors. Weekly expirations will always appear in a lighter shade compared to monthly expirations.
Monthly Expiry Lines:
You can turn off the lines indicating monthly expirations, or set the direction (past/future/both) and the number of lines to be drawn.
Weekly Expiry Lines:
You can display weekly expirations pointing to the future. You can also turn them off or specify how many weeks ahead the lines should be drawn.
Of course, the lines can be toggled on or off, and their default color can also be changed.
TIP: Hide default vertical grid lines in TradingView
Right-click on an empty area of your chart, then select “Settings.” In the Chart settings -> Canvas -> Grid lines section, disable the display of vertical lines to avoid distraction. Same, like steps above at MurreyMath lines.
🔶 ADDITIONAL IMPORTANT COMMENTS
- U.S. market only:
Since we only deal with liquid option chains: this option indicator only works for the USA options market and do not include future contracts; we have implemented each selected symbol individually.
- Why is there a slight difference between the displayed data and my live brokerage data? There are two reasons for this, and one is beyond our control.
- Brokerage Calculation Differences:
Every brokerage has slight differences in how they calculate metrics like IV and IVx. If you open three windows for TOS, TastyTrade, and IBKR side by side, you will notice that the values are minimally different. We had to choose a standard, so we use the formulas and mathematical models described by TastyTrade when analyzing the options chain and drawing conclusions.
- Option-data update frequency:
According to TradingView's regulations and guidelines, we can update external data a maximum of 5 times per day. We strive to use these updates in the most optimal way:
(1st update) 15 minutes after U.S. market open
(2nd, 3rd, 4th updates) 1.5–3 hours during U.S. market open hours
(5th update) 10 minutes before market close.
You don’t need to refresh your window, our last refreshed data-pack is always automatically applied to your indicator , and you can see the time elapsed since the last update at the bottom of your indicator.
- Skewed Curves:
The delta, expected move, and standard deviation curves also appear relevantly on a daily or intraday timeframe. Data loss is experienced above a daily timeframe: this is a TradingView limitation.
- Weekly illiquid expiries:
Especially for instruments where weekly options are illiquid: the weekly expiration STD1 data is not relevant. In these cases, we recommend checking in the "Display only Monthly labels" checkbox to avoid displaying not relevant weekly options expirations.
-Timeframe Issues:
Our option indicator visualizes relevant data on a daily resolution. If you see strange or incorrect data (e.g., when the options data was last updated), always switch to a daily (1D) timeframe. If you still see strange data, please contact us.
Disclaimer:
Our option indicator uses approximately 15min-3 hour delayed option market snapshot data to calculate the main option metrics. Exact realtime option contract prices are never displayed; only derived metrics and interpolated delta are shown to ensure accurate and consistent visualization. Due to the above, this indicator can only be used for decision support; exclusive decisions cannot be made based on this indicator . We reserve the right to make errors.This indicator is designed for options traders who understand what they are doing. It assumes that they are familiar with options and can make well-informed, independent decisions. We work with public data and are not a data provider; therefore, we do not bear any financial or other liability.

Stochastic Z-Score Oscillator Strategy [TradeDots]The "Stochastic Z-Score Oscillator Strategy" represents an enhanced approach to the original "Buy Sell Strategy With Z-Score" trading strategy. Our upgraded Stochastic model incorporates an additional Stochastic Oscillator layer on top of the Z-Score statistical metrics, which bolsters the affirmation of potential price reversals.
We also revised our exit strategy to when the Z-Score revert to a level of zero. This amendment gives a much smaller drawdown, resulting in a better win-rate compared to the original version.
HOW DOES IT WORK
The strategy operates by calculating the Z-Score of the closing price for each candlestick. This allows us to evaluate how significantly the current price deviates from its typical volatility level.
The strategy first takes the scope of a rolling window, adjusted to the user's preference. This window is used to compute both the standard deviation and mean value. With these values, the strategic model finalizes the Z-Score. This determination is accomplished by subtracting the mean from the closing price and dividing the resulting value by the standard deviation.
Following this, the Stochastic Oscillator is utilized to affirm the Z-Score overbought and oversold indicators. This indicator operates within a 0 to 100 range, so a base adjustment to match the Z-Score scale is required. Post Stochastic Oscillator calculation, we recalibrate the figure to lie within the -4 to 4 range.
Finally, we compute the average of both the Stochastic Oscillator and Z-Score, signaling overpriced or underpriced conditions when the set threshold of positive or negative is breached.
APPLICATION
Firstly, it is better to identify a stable trading pair for this technique, such as two stocks with considerable correlation. This is to ensure conformance with the statistical model's assumption of a normal Gaussian distribution model. The ideal performance is theoretically situated within a sideways market devoid of skewness.
Following pair selection, the user should refine the span of the rolling window. A broader window smoothens the mean, more accurately capturing long-term market trends, while potentially enhancing volatility. This refinement results in fewer, yet precise trading signals.
Finally, the user must settle on an optimal Z-Score threshold, which essentially dictates the timing for buy/sell actions when the Z-Score exceeds with thresholds. A positive threshold signifies the price veering away from its mean, triggering a sell signal. Conversely, a negative threshold denotes the price falling below its mean, illustrating an underpriced condition that prompts a buy signal.
Within a normal distribution, a Z-Score of 1 records about 68% of occurrences centered at the mean, while a Z-Score of 2 captures approximately 95% of occurrences.
The 'cool down period' is essentially the number of bars that await before the next signal generation. This feature is employed to dodge the occurrence of multiple signals in a short period.
DEFAULT SETUP
The following is the default setup on EURAUD 1h timeframe
Rolling Window: 80
Z-Score Threshold: 2.8
Signal Cool Down Period: 5
Stochastic Length: 14
Stochastic Smooth Period: 7
Commission: 0.01%
Initial Capital: $10,000
Equity per Trade: 40%
FURTHER IMPLICATION
The Stochastic Oscillator imparts minimal impact on the current strategy. As such, it may be beneficial to adjust the weightings between the Z-Score and Stochastic Oscillator values or the scale of Stochastic Oscillator to test different performance outcomes.
Alternative momentum indicators such as Keltner Channels or RSI could also serve as robust confirmations of overbought and oversold signals when used for verification.
RISK DISCLAIMER
Trading entails substantial risk, and most day traders incur losses. All content, tools, scripts, articles, and education provided by TradeDots serve purely informational and educational purposes. Past performances are not definitive predictors of future results.

Price Prediction With Rolling Volatility [TradeDots]The "Price Prediction With Rolling Volatility" is a trading indicator that estimates future price ranges based on the volatility of price movements within a user-defined rolling window.
HOW DOES IT WORK
This indicator utilizes 3 types of user-provided data to conduct its calculations: the length of the rolling window, the number of bars projecting into the future, and a maximum of three sets of standard deviations.
Firstly, the rolling window. The algorithm amasses close prices from the number of bars determined by the value in the rolling window, aggregating them into an array. It then calculates their standard deviations in order to forecast the prospective minimum and maximum price values.
Subsequently, a loop is initiated running into the number of bars into the future, as dictated by the second parameter, to calculate the maximum price change in both the positive and negative direction.
The third parameter introduces a series of standard deviation values into the forecasting model, enabling users to dictate the volatility or confidence level of the results. A larger standard deviation correlates with a wider predicted range, thereby enhancing the probability factor.
APPLICATION
The purpose of the indicator is to provide traders with an understanding of the potential future movement of the price, demarcating maximum and minimum expected outcomes. For instance, if an asset demonstrates a substantial spike beyond the forecasted range, there's a significantly high probability of that price being rejected and reversed.
However, this indicator should not be the sole basis for your trading decisions. The range merely reflects the volatility within the rolling window and may overlook significant historical price movements. As with any trading strategies, synergize this with other indicators for a more comprehensive and reliable analysis.
Note: In instances where the number of predicted bars is exceedingly high, the lines may become scattered, presumably due to inherent limitations on the TradingView platform. Consequently, when applying three SD in your indicator, it is advised to limit the predicted bars to fewer than 80.
RISK DISCLAIMER
Trading entails substantial risk, and most day traders incur losses. All content, tools, scripts, articles, and education provided by TradeDots serve purely informational and educational purposes. Past performances are not definitive predictors of future results.
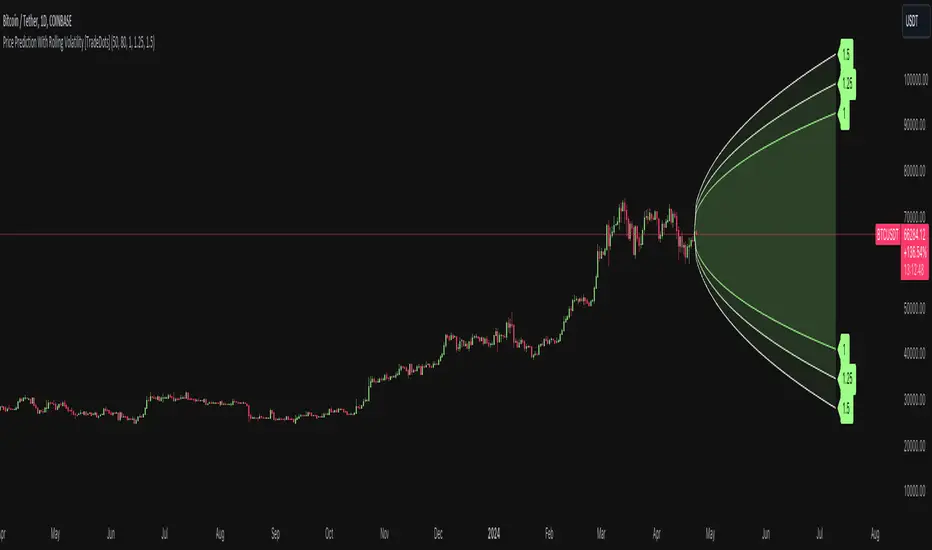
Bandwidth Volatility - Silverman Rule of thumb EstimatorOverview
This indicator calculates volatility using the Rule of Thumb bandwidth estimator and incorporating the standard deviations of returns to get historical volatility. There are two options: one for the original rule of thumb bandwidth estimator, and another for the modified rule of thumb estimator. This indicator comes with the bandwidth , which is shown with the color gradient columns, which are colored by a percentile of the bandwidth, and the moving average of the bandwidth, which is the dark shaded area.
The rule of thumb bandwidth estimator is a simple and quick method for estimating the bandwidth parameter in kernel density estimation (KSE) or kernel regression. It provides a rough approximation of the bandwidth without requiring extensive computation resources or fine-tuning. One common rule of thumb estimator is Silverman rule, which is given by
h = 1.06*σ*n^(-1/5)
where
h is the bandwidth
σ is the standard deviation of the data
n is the number of data points
This rule of thumb is based on assuming a Gaussian kernel and aims to strike a balance between over-smoothing and under-smoothing the data. It is simple to implement and usually provides reasonable bandwidth estimates for a wide range of datasets. However , it is important to note that this rule of thumb may not always have optimal results, especially for non-Gaussian or multimodal distributions. In such cases, a modified bandwidth selection, such as cross-validation or even applying a log transformation (if the data is right-skewed), may be preferable.
How it works:
This indicator computes the bandwidth volatility using returns, which are used in the standard deviation calculation. It then estimates the bandwidth based on either the Silverman rule of thumb or a modified version considering the interquartile range. The percentile ranks of the bandwidth estimate are then used to visualize the volatility levels, identify high and low volatility periods, and show them with colors.
Modified Rule of thumb Bandwidth:
The modified rule of thumb bandwidth formula combines elements of standard deviations and interquartile ranges, scaled by a multiplier of 0.9 and inversely with a number of periods. This modification aims to provide a more robust and adaptable bandwidth estimation method, particularly suitable for financial time series data with potentially skewed or heavy-tailed data.
Formula for Modified Rule of Thumb Bandwidth:
h = 0.9 * min(σ, (IQR/1.34))*n^(-1/5)
This modification introduces the use of the IQR divided by 1.34 as an alternative to the standard deviation. It aims to improve the estimation, mainly when the underlying distribution deviates from a perfect Gaussian distribution.
Analysis
Rule of thumb Bandwidth: Provides a broader perspective on volatility trends, smoothing out short-term fluctuations and focusing more on the overall shape of the density function.
Historical Volatility: Offers a more granular view of volatility, capturing day-to-day or intra-period fluctuations in asset prices and returns.
Modelling Requirements
Rule of thumb Bandwidth: Provides a broader perspective on volatility trends, smoothing out short-term fluctuations and focusing more on the overall shape of the density function.
Historical Volatility: Offers a more granular view of volatility, capturing day-to-day or intra-period fluctuations in asset prices and returns.
Pros of Bandwidth as a volatility measure
Robust to Data Distribution: Bandwidth volatility, especially when estimated using robust methods like Silverman's rule of thumb or its modifications, can be less sensitive to outliers and non-normal distributions compared to some other measures of volatility
Flexibility: It can be applied to a wide range of data types and can adapt to different underlying data distributions, making it versatile for various analytical tasks.
How can traders use this indicator?
In finance, volatility is thought to be a mean-reverting process. So when volatility is at an extreme low, it is expected that a volatility expansion happens, which comes with bigger movements in price, and when volatility is at an extreme high, it is expected for volatility to eventually decrease, leading to smaller price moves, and many traders view this as an area to take profit in.
In the context of this indicator, low volatility is thought of as having the green color, which indicates a low percentile value, and also being below the moving average. High volatility is thought of as having the yellow color and possibly being above the moving average, showing that you can eventually expect volatility to decrease.
