Time-Traveling SMATitle: Time-Traveling SMA - A Unique Technical Indicator for Trend Trading
Introduction:
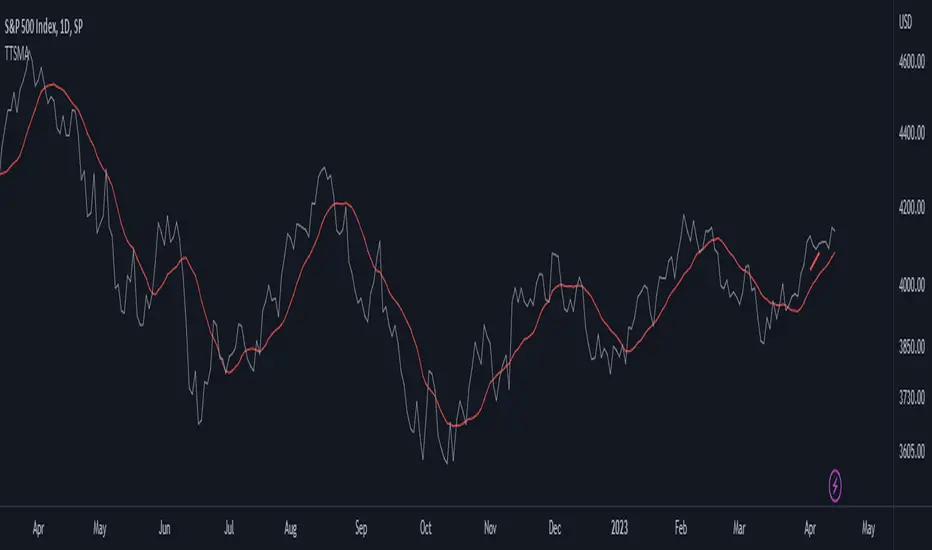
The Time-Traveling MA (TTSMA) is a playful and inventive technical indicator that combines a simple moving average (SMA) with a forward-shifted line, providing a futuristic perspective on trend direction. By enabling the "Singularity" option, traders can visualize the changing colors of the TTSMA line, representing an upward or downward trend. Although primarily conceptual, the TTSMA can be used as a fun addition to any trading strategy focused on trend-following.
Description:
The TTSMA indicator takes a standard simple moving average (SMA) and shifts it forward in time by a user-defined number of bars. The main idea behind the TTSMA is to provide an estimate of future trend direction, based on current market data. When the "Singularity" option is enabled, the TTSMA line changes color according to the moving average's direction, turning green for upward trends and red for downward trends.
TTSMA-Based Trading Strategy:
A simple trading strategy using the Time-Traveling Moving Average (TTSMA) can be devised as follows:
Define the parameters: Select the preferred length of the SMA (e.g., 14 periods) and the forward shift (e.g., 5 bars). Enable the "Singularity" option for a more visually appealing experience.
Entry Signals:
a. Long Entry: When the TTSMA line turns from red to green, it suggests a potential upward trend. Enter a long position at the close of the signal bar.
b. Short Entry: When the TTSMA line turns from green to red, it indicates a possible downward trend. Enter a short position at the close of the signal bar.
Exit Signals:
a. Long Exit: Close the long position when the TTSMA line turns from green to red.
b. Short Exit: Close the short position when the TTSMA line turns from red to green.
Risk Management: To minimize risk, set a stop-loss at a predefined level below the entry price for long positions and above the entry price for short positions. Adjust the stop-loss to a trailing stop once the trade moves in your favor.
Conclusion:
The Time-Traveling Moving Average (TTSMA) is a playful and experimental indicator that provides a unique approach to trend trading. While not intended for serious trading applications, the TTSMA can be a fun addition to any technical analysis toolbox, offering a creative way to visualize trend direction. Remember to always test any new trading strategy or indicator on a demo account before using it on a live trading account to ensure its effectiveness and suitability to your trading style.
Sma
Moving Average Scalper by nnamdertWhat does this Indicator Do?
By request and popular demand, I have created a quick and easy Moving Average Crossover Scalper Indicator. This indicator simply allows the trader to visualize scalping opportunities in an easy way using MA crossovers.
The Indicator also plots multiple higher moving averages via an "optional" table. The table gives a quick glance at the overall trend (based on moving Averages alone).
Users can adjust the initial Moving Average Length and the number of additional Moving Average Lengths to be plotted on the chart.
How do I use it?
As shown below, the cross overs are very easy to see. The Stoploss "should" be set at the most recent swing high or low prior to the MA Cross.
The dotted yellow line must cross above or below the thick mutli-colored line in order to be considered valid.
As seen in the screenshot below, an optional input setting turns ON / OFF additional Moving Average "Lines" and plots them on the chart. In addition, the indicator color fills between the moving averages based on Bullish or Bearish movement. If the lines are in continuity, then the color will be either RED or GREEN depending on the market sentiment (bull or bear).
The total number of Moving Averages listed in the table can be manually adjusted in the settings by the user. The table is small and see-through so it works on mobile devices as well and allows the user to still see the candles easily. Simply double clicking on the table will bring up the settings.
As shown below, the table can be relocated to a position acceptable to the user if it is in the way. This option is available under input settings.
I hope this indicator proves useful for you and your trading style. If you have any suggestions please let me know.
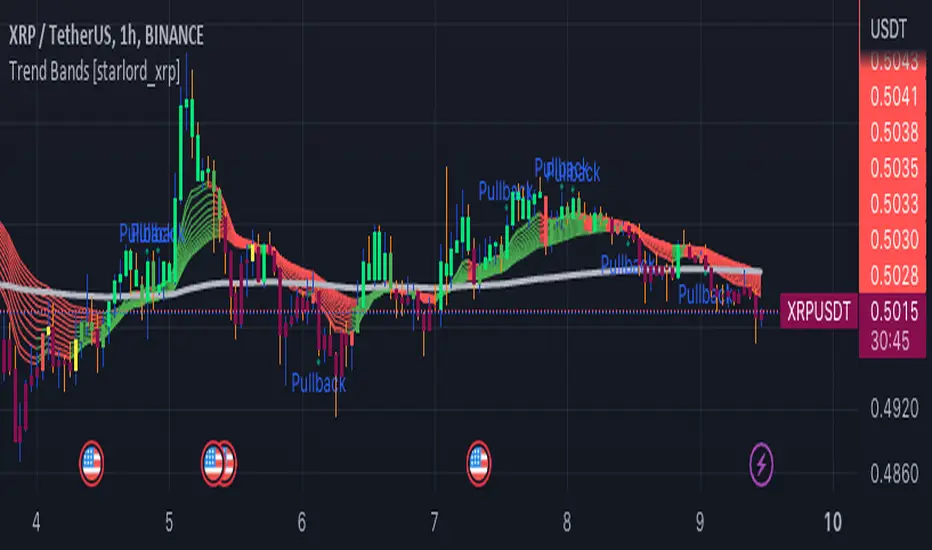
Trend Bands [starlord_xrp]This indicator uses multiple trendlines to determine the overall trend and trend changes. It also highlights areas of potential pullbacks to entry.
Multiple Moving Average ToolkitFeatures Overview:
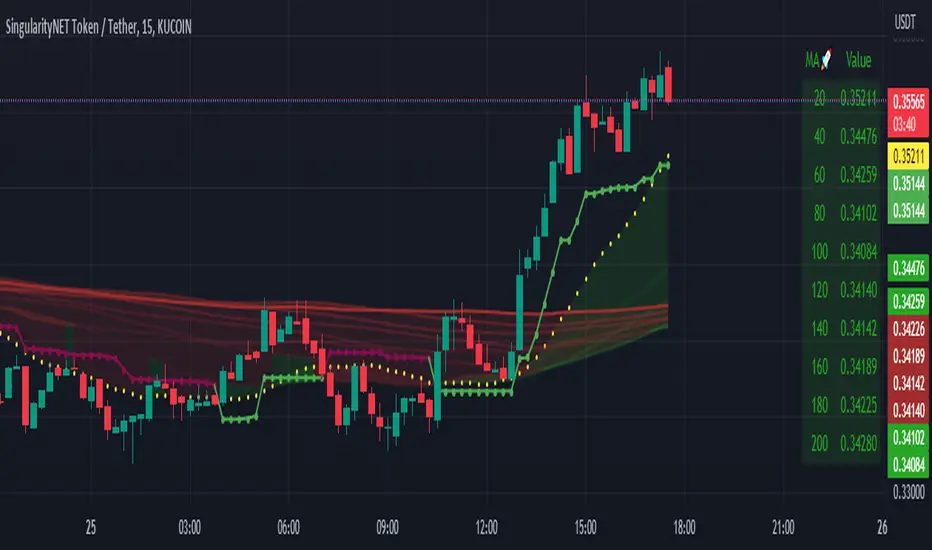
Multiple Moving Averages: The script allows you to plot up to five different Moving Averages (MAs) on your chart at the same time. You can choose the type of MA (EMA, SMA, HMA, WMA, DEMA, VWMA, VWAP) and the length of each one.
Color Ribbon: You can turn the MAs into a color ribbon by selecting the "Turn into Color Ribbon?" option. This will make the area between the MAs colored and can help you identify trends more easily.
MA Value Table: You can draw a table on your chart that displays the current values of each MA, whether the trend is bullish or bearish along with the length of the MAs. The current ATR value is also shown in the last cell of the table. You can choose the location of the table (Top Left, Top Right, Bottom Left, Bottom Right) and the transparency of the background color.
Crosses: The script can detect when two MAs cross over each other (1st MA crosses 5th MA and vice versa), indicating a potential trend reversal. It will plot crosses on the chart at the point of the crossover and give an alert if the "Bullish Cross Detected" or "Bearish Cross Detected" condition is met.
How to use:
Once the script is added to your chart, you can customize the settings to fit your preferences. You can choose the type and length of each MA, whether to turn them into a color ribbon, whether to plot crosses, and whether to draw the MA Value Table.
The MA Value Table can be moved to a different location on the chart by selecting the "Location of Table" option and choosing Top Left, Top Right, Bottom Left, or Bottom Right.
Watch for MA crossovers and alerts to identify potential trend reversals. The script can help you identify bullish and bearish trends by color-coding the area between the MAs and displaying the current values of each MA in the table.
Breakdown of the script:
User Inputs
The first section of the script defines several user inputs that allows you to customize the indicator. These include options for turning the MAs into a color ribbon, plotting crosses when there is a bullish or bearish cross of the MAs, drawing a table of the MA values, and setting the transparency of the ribbon. You can also select the location of the MA value table and customize the settings for each individual MA.
Moving Average Calculation
The script defines a function called "getMA" that calculates the moving average for a given type and length. The function uses a switch statement to determine which type of moving average to use, such as an exponential moving average (EMA), simple moving average (SMA), Hull moving average (HMA), weighted moving average (WMA), double exponential moving average (DEMA), volume-weighted moving average (VWMA), or volume-weighted average price (VWAP).
The script then calls this function to calculate the values of up to five different MAs, depending on the user input. The ATR (average true range) is also calculated using the TA library.
Color Filter and Cross Detection
The script sets a color filter based on the relationship between the MAs. If the shorter-term MAs are above the longer-term MAs, the filter is set to green to indicate a bullish trend, and if the shorter-term MAs are below the longer-term MAs, the filter is set to red to indicate a bearish trend. You can adjust the transparency of the ribbon to make it more or less visible.
The script also detects when there is a bullish or bearish cross of the MAs and can generate alerts to notify you.
MA Plotting
The script plots up to five MAs on the chart, depending on the user input. The MAs are plotted as lines with different colors and thicknesses, and you can choose to turn them into a color ribbon if desired.
Cross Plotting
The script plots crosses on the chart when there is a bullish or bearish cross of the MAs. The crosses are plotted as X shapes at the location of the cross and are color-coded to indicate the direction of the cross.
MA Value Table
Finally, the script draws a table of the MA values on the chart, displaying the values of each MA as well as the current trend and the ATR. You can customize the location of the table, and the table is colored to match the color filter of the MAs.
Feel free to message me or comment on the post with any questions or issues!
Much more to come!
Thanks for reading, enjoy!

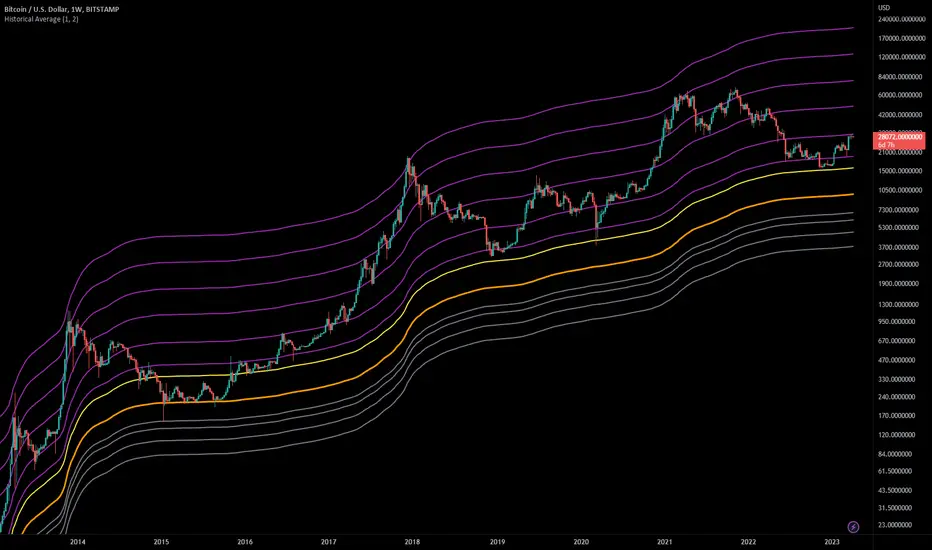
Historical AverageThis indicator calculates the sum of all past candles for each new candle.
For the second candle of the chart, the indicator shows the average of the first two candles. For the 10th candle, it's the average of the last ten candles.
Simple Moving Averages (SMAa) calculate the average of a specific timeframe (e.g. SMA200 for the last 200 candles). The historical moving average is an SMA 2 at the second candle, an SMA3 for the third candle, an SMA10 for the tenth, an SMA200 for the 200th candle etc.
Settings:
You can set the multiplier to move the Historical Moving Average along the price axis.
You can show two Historical Moving Averages with different multipliers.
You can add fibonacci multipliers to the Historical Moving Average.
This indicator works best on charts with a lot of historical data.
Recommended charts:
INDEX:BTCUSD
BLX
But you can use it e.g. on DJI or any other chart as well.
Colorful Moving Averageswhat is Colorful Moving Averages?
This indicator allows you to use your favorite moving averages in their advanced form.
what it does?
It gives you easy access to the following information with a single indicator: the direction and momentum of the price,
rate of change of momentum (acceleration),
time-dependent change in momentum,
and all the other information a moving average provides.
it paints the selected moving average type according to the momentum it has, and also shows the momentum and acceleration values in a table. colors are interpreted as follows: the color of the moving average is red, the momentum is negative; A green color means the momentum is positive, and a yellow color means the momentum is 0. As the momentum changes, the moving average takes on different shades of these 3 colors. how it actually works can be easily understood at a glance.
"Δ" sign indicates momentum compressed between 100 and -100.
"Γ" sign indicates the momentum of the momentum, that is the acceleration. its values are compressed between 100 and -100.
how it does it?
it uses this formulas:
how to use it?
First, select the moving average type you want to use. then set the length and source. Now, with a single indicator, you can observe both the distance of the price from the mean, its instantaneous momentum relative to the last candle by looking at the symbol "Δ", the current change of momentum by looking at the symbol "Γ", and the time-dependent change in its momentum by looking at the colors. you can also see the maximum and minimum points where the momentum is equal to 0.

Moving Average Lab - by InFinitoThe Moving Average Lab allows to create any possible combination of up to 3 given MAs. It is meant to help you find the perfect MA that fits your style, strategy and market type.
This script allows to average, weight, double and triple multiple types and lengths of Moving Averages
Currently supported MA types are:
SMA
EMA
VWMA
WMA
SMMA (RMA)
HMA
LSMA
DEMA
TEMA
Features:
- Double or Triple any type of Moving Average using the same logic used for calculating DEMAs and TEMAs:
In the following example you can see a normal, double and triple 200 VWMA
- Average 2 or 3 different types and lengths of Moving Average:
In the example you can see the average between a Double LSMA and a SMA
- Weight each MA manually:
The example shows the average of an HMA and a VWMA with the HMA having a weight of 2 and the VWMA having a weight of 1
- Average up to 3 personalized MAs:
The example shows the average of an EMA + a Double WMA + a Triple SMA with a 3:2:1 weighting
- Average different Moving Averages with different length each:
The example shows the average of an 800 SMA + a 400 VWMA + a 200 EMA

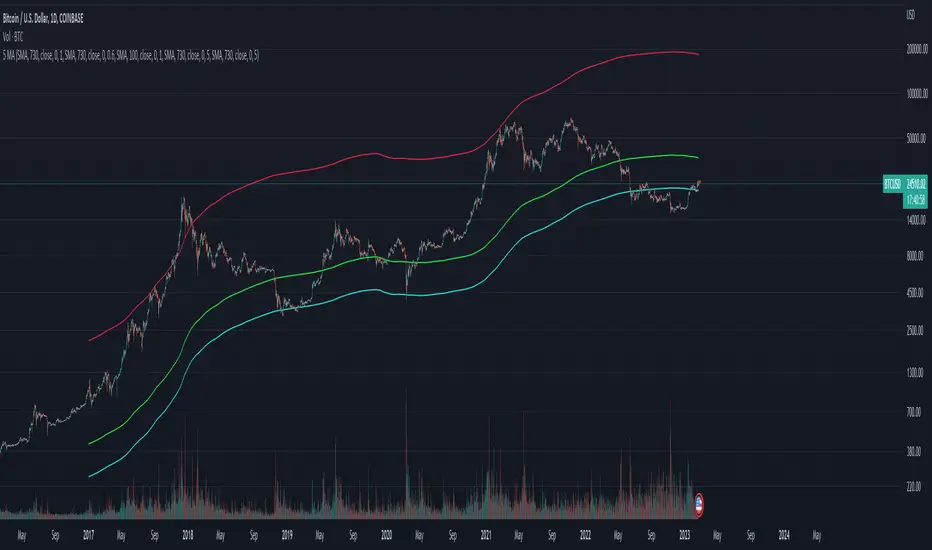
Rainbow Moving AverageA Rainbow Moving Average script. There are many like it, but this one is mine. It is designed to be easy to read without too much noise in the number of lines and shading, with the moving average to be some of the commonly used ones. Using commonly referenced moving average values help us to understand "the crowd" and what moving average or trend lines they might be looking at. The default values are derived from hourly charts, but work well on any time frame.
The moving average function is simple to change so you can use it for any moving average type that you like, including volume-weighted.
Inspired by my daughter's love of rainbows, she has approved the colors.

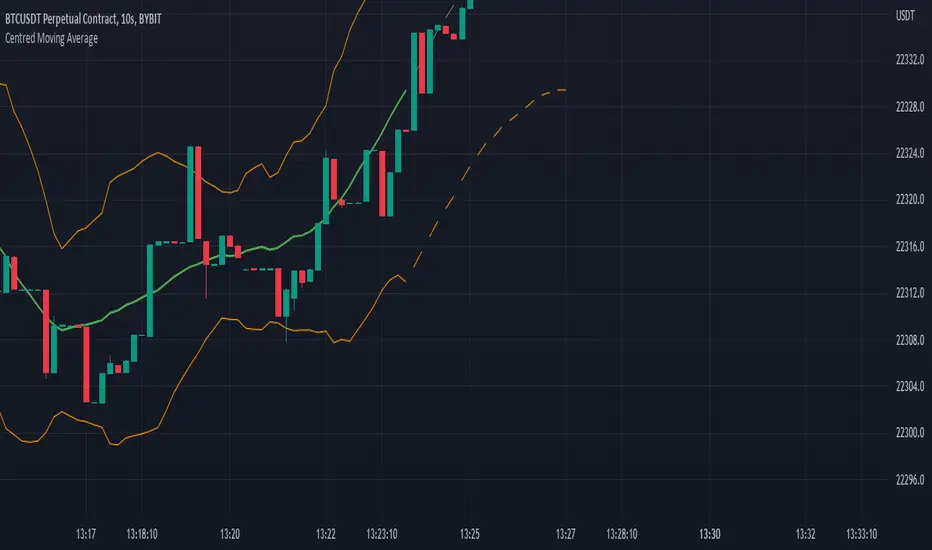
Centred Moving AverageBased around the Centered Moving Average as published by Vailant-Hero this script is revised and improved to aid with execution time & server load. For full description follow the link as above, as Valiant-Hero explains the idea perfectly well.
While the original script worked fine for small values of length, once length was extended significantly or chart timeframe set to short values then the script is prone to exceeding computation requirements. The original script was attempting to delete and re-draw (length x 3) lines on the chart for each tick. In addition to server load, once length is greater than 167 (500/3) then the first drawn lines start disappearing, so the predicted values no longer appear connected to the offset averages calculated from the candle data. A further error resulted with larger values of "length" and future data selected, in that the script would try and move lines more than 500 bars into the future.
Improvements and major code changes
All values for the predicted moving average lines are calculated from a single run through of the data, rather than having to loop back through the data "length" times (and then through it again "length" times if you selected double moving average). Each loop also inefficiently calculated the sum of "length" values by recalling each one individually.
Number of lines are thus reduced so that we're never attempting to plot more than "max_lines_count" onto the chart. User is able to select the granularity of the lines - more sections will mean a smoother line but at the expense of processing speed.
No matter the combination of "length" and the selected granularity of the lines, no line will be drawn if its endpoint would be more than 500 bars in the future.
Code for "Double SMA" only affected the predicted data values, rather than affecting the historic calculations (and standard deviation calcs) as well as the predictions. This has been included and results in much smoother lines when "Double Moving Average" is selected.
Striped lines for the predicted values - firstly to make it obvious where the "predictions" begin, and also because they look funky.
Rekt Edge Reversion BandRekt Edge Reversion band is a technical indicator that utilizes a combination of moving averages and standard deviations to determine optimal entry and exit points in the market. By comparing the current price to its moving average, the indicator identifies potential trends and determines how you can position around them by plotting buy/sell signals and two channels based on user input parameters. The user can choose between Simple Moving Average ( SMA ) or Exponential Moving Average ( EMA ) and select the moving average period, the unit of separation, the multiples of the unit, and other important parameters. The indicator's inputs can be adjusted to suit different trading styles, and it can be used on any time frame. The indicator can be used to identify potential trend reversals or breakouts (or breakdowns) when the price moves outside of the channels. The indicators potential use cases include identifying overbought or oversold conditions. With its ability to provide a clear signal on when to enter and exit a trade, this indicator is a popular tool among traders looking to make more informed and profitable trading decisions. This indicator can also be used in conjunction with other technical analysis tools to confirm or invalidate trading signals.

5 Moving AveragesFive Moving averages. Choose from several types, SMA, EMA, SMMA etc... Has X and Y offset.
Exponential Bollinger Bands (EBB)This script is a variation of the popular Bollinger Bands indicator, which uses exponential moving averages (EMA) instead of simple moving averages (SMA) as its core calculation. The indicator is designed to provide a visual representation of volatility, with the distance between the upper and lower bands being determined by the standard deviation of the underlying data.
The script starts by defining a number of helper functions that are used to calculate the moving averages and standard deviations required for the indicator. The first helper function is sma(), which calculates the simple moving average of the input data over a specified length. This function uses linear interpolation to smooth the data when the length is not an integer. The stdev() function calculates the standard deviation of the input data using the simple moving average calculated by the sma() function.
The bes() function calculates the exponential moving average of the input data over a specified length. The estdev() function calculates the standard deviation of the input data using the exponential moving average calculated by the bes() function.
The estdev function calculates the standard deviation using an exponential moving average method, rather than the traditional simple moving average method used by the stdev function. The exponential moving average method gives more weight to recent data, which can make the estdev more responsive to recent changes in volatility. This can make it more useful in certain types of analysis, such as identifying trends in volatility. Additionally, it also uses the same EMA algorithm to calculate the average value of the data set, which can help to keep the output of the estdev and average functions consistent.
The script also defines two more helper functions, average() and standard_deviation(), which allow the user to switch between using simple moving averages (SMA) and exponential moving averages (EMA) as the basis for the indicator. These functions take three arguments, the input data, the length of the moving average, and a string that specifies whether to use SMA or EMA.
The script then defines the input parameters for the indicator. The user can choose whether to use SMA or EMA as the basis for the indicator using the select parameter. The user can also specify the length of the moving average and the multiplier for the standard deviation using the length and multiplier parameters, respectively.
Finally, the script calculates the average and standard deviation of the input data using the selected method (SMA or EMA), and plots the upper and lower bands of the indicator. The upper band is calculated as the average plus the standard deviation multiplied by the specified multiplier, while the lower band is calculated as the average minus the standard deviation multiplied by the specified multiplier.

SMMA slope deviation alertThis indicator alerts when the deviation of close value from SMMA is more than 30% of the average deviation for the last 14 bars. The period of SMMA can be adjusted.
This indicator has 3 hardcoded timeframes so there is almost no sense what timeframe you use. It gathers data from 15m, 1H and 4H timeframes and combines then on one chart.
The markers are drawn one over another, for example, if you set 1H timeframe on you chart green markers from 15m can be placed under the same 1h-candle where the blue one lights on 1H. The algo is made to lower the risks of traders, so if you use 15m timeframe you will see green marker but if you use 1H you will see the blue marker on 1H (and don't see the green one because the blue is over the green). This is somewhat a "hardcoded scalp screener". You can "zoom in" and "zoom out" the row of markers by toggling between 15m and 1H and 4H but conditions for the signals are the same.
Black and blue markers light when the price is too far from the SMMA . "Too far" means that deviation is greater than the average deviation (for 14 bars) multiplied by 1.3.
Red and green markers light when besides the condition mentioned above, the price change is accelarating. Acceleration is considered in terms of the speed of running from SMMA . if SMMA was crossed by the priceline less than 8 bars ago and now it went so far that the condition of 30% is triggered then red and green markers light.

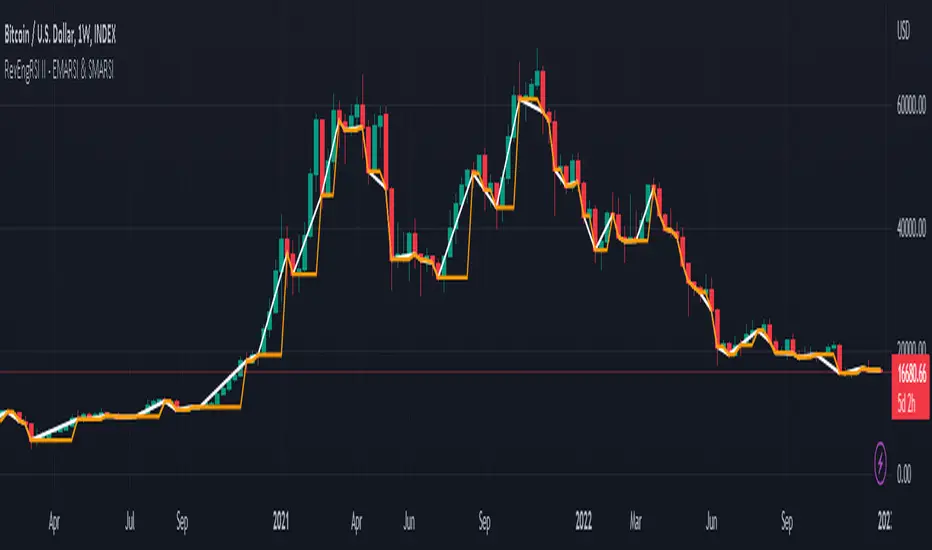
Reverse Engineering RSI II - EMARSI and SMARSIThis is the Reverse Engineering EMARSI and SMARSI Indicator.
It’s based on the work of Giorgos Siligardos on Reverse Engineering RSI.
The Reverse Engineering EMARSI and SMARSI Indicator shows the Exponential Moving Average and the Simple Moving Average of the RSI line but plotted in the price chart.
This script is also a complement of "Reverse Engineering RSI, by Giorgos Siligardos" script by HPotter but can also be used alone.
By default the RevEngSMARSI is turned off.
The RevEngEMARSI is the white line.
I’ve also added to the indicator:
1) Simple Moving Average (MA) of the EMARSI (EMARSI SMA) - Orange Line
2) Standard Deviation Bands for the EMARSI SMA - turned off by default
Using the settings I left in default (Length's = 1), we can see that when the EMARSI SMA is horizontal the price rises and so does the EMARSI. Also when the EMARSI SMA rises that's a signal that there is a resistance/support at that price. We can observe such thing if we draw horizontal lines at those prices. We can use this to help us put stop-losses and take profits. Also, those resistance/suport prices are ALWAYS the closing price of the first red candle after a bullish trend (big or small trends). Interesting...
When the EMARSI SMA rises and touches the EMARSI 3 things can happen:
- Bullish Trend slows down
- Correction of price
- Trend reversal
So, when the EMARSI SMA rises that can be interpreted as a signal for taking profits.
We should always wait for the price to close in the timeframe we're using, because sometimes the EMARSI SMA rises before the closing price and flattens again when is about to close.
However we should never take decisions based on 1 indicator. Our trading decision should always take in consideration multiple sources of information.
Of course we can use other settings for the trading. And if we do that we will observe different behaviours. And we should also study those behaviours. We can then use the crosses between the lines.
If there is something wrong with the code or its calculations, please let me know.
If you want to modify or improve the code, feel free to do that, but please let me know the changes you made.
This Indicator works in all timeframes. I hope you enjoy it!
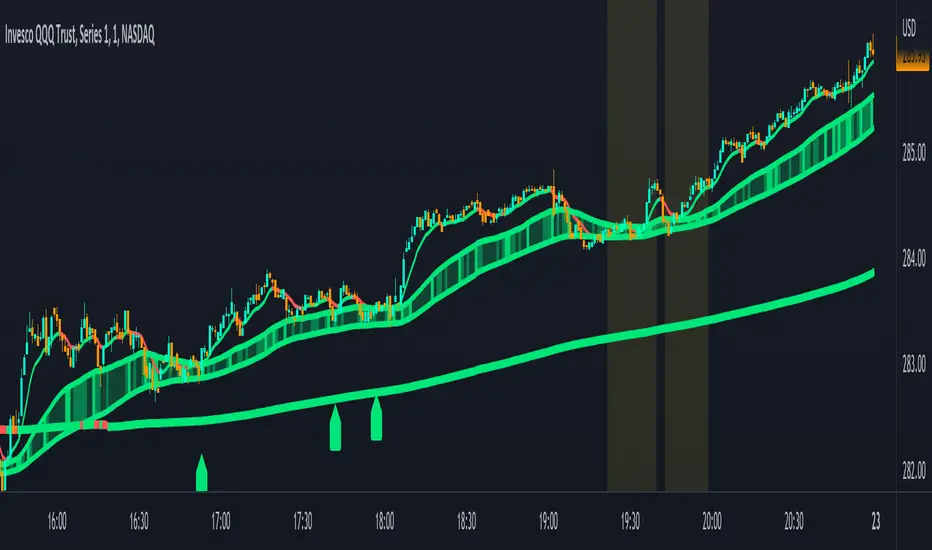
Combined Moving Averages + Squeeze & Volume Spike SignalsThis is a set of 4 combined moving averages. Each moving average is a combination of an EMA, SMA, HMA, RMA, WMA and VWMA with the same length as set in your input settings. All 6 of them are added together and then divided by 6 for an average of all of them. This is based on the theory that most traders use their own preference of moving averages, so combining them all should give us a better idea of where price should actually react since we are using the average of what most traders are using on their charts. It also smooths the moving averages out as well so you get a much easier to read moving average than any of them on their own which should help you hold positions longer and time your entries better.
The default lengths used for this indicator are as follows: 10, 50, 100 and 500. These lengths can be updated in the settings. The 10 and 500 will change colors when the individual moving average is less than or greater than its previous value. Price above or below the moving average does not affect the colors. The 50 and 100 are colored based on whether the 50 is greater/less than the 100.
The two middle length moving averages by default are the 50 and 100. This has been turned into a cloud because it is the area where price typically bounces, since tons of traders use the 50 and 100 moving averages. This should be your long/short zone when price is trending.
Each moving average can be set to use a different source such as close, open, high, low, ohlc4, etc. You can also adjust the length of each moving average. Default settings work well, but feel free to customize them to your liking. You can also change the colors of the lines in the settings.
Beware that changing the lengths of MA #2 and MA #3 will change the signals, squeezes and the cloud.
VOLUME SPIKES
The cloud will change to a brighter color when a volume spike is detected. When a major volume spike is detected, it will turn very bright colored green/red according to the direction of the cloud. This notifies you of volume spikes so you have a better idea of how strong the trend is. If the cloud is a dark green/red then that means that volume is less than or equal to the recent median volume.
SIGNALS
There are also signals that will be given when the current candle is in the cloud, the candle is going in the same direction as the cloud, the MA #2 and MA #3 is going in the same direction and a volume spike is detected. These help you identify good entries when markets are trending. Be cautious of these signals when the trend is sideways and not clearly moving in one direction. The signals can be turned on or off in the settings.
SQUEEZE
Many times when moving averages squeeze together, a big move happens shortly after. Because of this I added a yellow background color when a squeeze is detected. It looks at the median value difference of the MA #2 and MA #3 and if the current value difference is less than the median multiplied by the multiplier in the settings then it will change the background color to notify you. The default value of the multiplier is .6, meaning the squeeze signal will only show if the current value difference of the cloud is less than .6 of the median difference. The multiplier can be adjusted in the settings to suit your preferences. Lower values will only show tighter squeezes.
MARKETS
This indicator can be used on all markets including stocks, crypto, futures and forex.
TIMEFRAMES
This indicator can be used on all timeframes.
PAIRINGS
We recommend pairing this combined moving average with Trend Friend Swing Trade And Scalp Signals for extra confluence. Look for price to bounce in the cloud with good volume and a confirming signal from Trend Friend for highly probable moves.
TRIX With Moving Average - Didi's Needles setupTrix with Moving Average ( SMA or EMA ) and Fill Color. Pre-set for the Didi's Needles setup
Length: Trix Length
Use Ema: True will use an EMA , False will use an SMA .
Moving Average: Moving average used in the TRIX value.
Fill: True will fill the interior between the Trix and the MA with the color of the line above it.
-------
Trix com Média Movel ( MMS e MME) pré configurado para o setup de Agulhadas do Didi
Length: Comprimento do Trix
Use Ema: Verdadeiro usará uma MME , Falso usará uma MMS .
Moving Average: Média móvel utilizada no valor TRIX .
Fill: Verdadeiro irá preencher o interior entre o Trix e a MA com a cor da linha que está em por cima

Centered Moving AverageThe Centered moving averages tries to resolve the problem that simple moving average are still not able to handle significant trends when forecasting.
When computing a running moving average in a centered way, placing the average in the middle time period makes sense.
If we average an even number of terms, we need to smooth the smoothed values.
Try to describe it with an example:
The following table shows the results using a centered moving average of 4.
nterim Steps
Period Value SMA Centered
1 9
1.5
2 8
2.5 9.5
3 9 9.5
3.5 9.5
4 12 10.0
4.5 10.5
5 9 10.750
5.5 11.0
6 12
6.5
7 11
This is the final table:
Period Value Centered MA
1 9
2 8
3 9 9.5
4 12 10.0
5 9 10.75
6 12
7 11
With this script we are able to process and display the centered moving average as described above.
In addition to this, however, the script is also able to estimate the potential projection of future data based on the available data by replicating where necessary the data of the last bar until the number of data necessary for the calculation of the required centered moving average is reached.
If for example I have 20 daily closings and I look for the moving average centered at 10, I receive the first data on the fifth day and the last data on the fourteenth day, so I have 5 days left uncovered, to remedy this I have to give the last value to the uncovered data the closing price of the last day.
The deviations work like the bollinger bands but must refer to the centered moving average.

Trend Slope Meter - KaspricciTrend Slope Meter
This indicator measures the slope of the trend defined by a moving average or an external source. The slope is calculated by the change of price in ticks for a defined number of bars divided by the number of bars.
Settings
Source - Default: close price. Used to calculate the moving average as basis for slope measurement. Can be an external source of a different indicator as well. In case you select an external source, you can disable the moving average calculation.
Moving Average Settings
Type - Default: EMA. Type of moving average calculation. All provided out of the box by TradingView.
Length - Default: 50. Length used to calculate moving average.
Slope Settings
Length - Default: 50. Length used to calculate slope.

Simple RSI and SMA Long and Short (by Coinrule)The relative strength index ( RSI ) is a momentum indicator used in technical analysis . RSI measures the speed and magnitude of a security's recent price changes to evaluate overvalued or undervalued conditions in the price of that security. The RSI is displayed as an oscillator (a line graph) on a scale of zero to 100. The RSI can do more than point to overbought and oversold securities. It can also indicate securities that may be primed for a trend reversal or corrective pullback in price. It can signal when to buy and sell. Traditionally, an RSI reading of 70 or above indicates an overbought situation. A reading of 30 or below indicates an oversold condition.
A simple moving average ( SMA ) calculates the average of a selected range of prices, usually closing prices, by the number of periods in that range.
The Strategy enters and closes the trade when the following conditions are met:
LONG
SMA100 is greater than SMA150
RSI is greater than 50
SHORT
SMA100 is less than SMA150
RSI is less than 50
When a long position is opened, it remains open until the conditions for a short are met at which point the long position is closed and the short position is opened. Then, when the conditions for the long position are met, the short will be closed and a long will be opened.
This strategy is back tested from 1 January 2022 to simulate how the strategy would work in a bear market. The strategy provides good returns.
The strategy assumes each order is using 30% of the available coins to make the results more realistic and to simulate you only ran this strategy on 30% of your holdings. A trading fee of 0.1% is also taken into account and is aligned to the base fee applied on Binance.

rt maax EMA cross strategythis just sample of our strategies we published with open source, to learning our investor the way of trading and analysis, this strategy just for study and learning
in this strategy we use expontial moving avarage 20 , 50 , 200 and the we build this strategy when the price move up ema 200 and ema 20,50 cross up the 200 ema in this conditions the strargey will open long postion
and the oppisit it is true for short postion in this sitation the price should be under ema 200 and the ema 20 , 50 should cross under 200 ema then the strategy will open the short postion
we try this strategy on forex ,crypto and futures and it give us very good result ,, also we try this postion on multi time frame we find the stragey give us good result on 1 hour time frame .
in the end our advice for you before you use any stratgy you should have the knowledg of the indecators how it is work and also you should have information about the market you trade and the last news for this market beacuse it effect so much on the price moving .
so we hope this strategy give you brefing of the way we work and build our strategy

Bandas de Bollinger + 3 Medias Moviles SimplesDenota de una forma poco invasiva, cuando el precio alcanza las Bandas de Bollinger, y permite apreciar al mismo tiempo las medias móviles de 200,100 y 50 a fin de estar alerta a sus cruces, nos obstante, dicho indicador, debe ser apoyado junto con otros indicadores en los mercados financieros que estén al alza o a la baja.
Descargo de responsabilidad: Este contenido los datos, indicadores y valores reflejados, es solo para fines informativos y no debe interpretarse como asesoramiento legal, fiscal, de inversión, financiero o de otro tipo.
FieryTrading: Buy The Dip - Sell The RipDear Tradingview community,
Today I want to share a very powerful, yet easy to use indicator with you. The indicator will find local tops or bottoms and will help you determine when it's a good time to trade a potential reversal.
How does it work?
The indicator makes use of the RSI to detect extremities and waits until the RSI reverses. Furthermore, a long-term moving average is used to determine whether we're in bullish or bearish market conditions. In bullish conditions the indicator will only go long, in bearish conditions the indicator will only go short.
How do I use it?
Favorite the indicator and apply it to your chart! You can add an alert to the indicator to receive a message once it has detected a good point for a reversal trade.
The indicator can be used on all assets and on all timeframes. Personally, I've found the 1 - 4 hourly timeframes to yield the best results.
Good luck!

SUPER MULTI MOVING AVERAGE [Gabbo]📈 Moving Average Indicator Update - Version 2
🔹 New Features and Improvements:
1️⃣ Enhanced MA Selection for Table Lines:
Previously, the indicator did not allow users to choose a different Moving Average type for the table lines. Now, you can select the MA type for the table.
2️⃣ New Table Text Customization Inputs:
Added inputs to choose the table text color and size for a more personalized display.
3️⃣ Improved Input Visibility and Organization:
We’ve reorganized the inputs so that the most commonly used options are now placed at the beginning for quicker and more convenient configuration.
4️⃣ Bug Fixes and Code Improvements:
Minor bugs have been fixed, and the code has been optimized for improved stability and performance. The code is now cleaner and fully functional in version 6.
5️⃣ Cometreon Public Library Integration:
To lighten the code and improve modularity, we’ve integrated the Cometreon public library. This makes the code more efficient and reduces the need to duplicate common functions.
☄️ With this update, the Moving Average indicator becomes even more versatile and user-friendly, offering a refined table interface and enhanced customization options!
