Sundays Suck for Bitcoin - Daily StrategyBitcoin tends to have bad Sundays, so this strategy just sells on Saturday, and buys back the next Wednesday if the price is kinda going up!
(Its Jonnys first script, so is this really just published for people looking for simple code to learn from :-)
(The strategy works best if you set your chart time period to 1 day.)
Média Móvel Simples (MMS)

C320up Strategy Tester Start TimeC320up Strategy Tester Start Time
This is a little snippet you can paste into your Strategy to set the testing start date and time.
It is not a Strategy per se, though is an example with the timestamp script included.
Instructions are fairly straight forward, and are listed in the script.
If for some reason you also wanted an end date, that too is possible. Just leave a note in the comments.
Disclaimer: We searched for a similar script on TV, and could not find anything at this point in time.
You can set your preferred date and time in the input section of the settings.
Enjoy!

Kozlod - Yet Another Moving Average Cross Strategy (9 MA types)You can choose one of these MA types in params:
Simple Moving Average (SMA)
Exponential Moving Average (EMA)
Weighted Moving Average (WMA)
Arnaud Legoux Moving Average (ALMA)
Hull Moving Average (HMA)
Volume-weighted Moving Average (VWMA)
Least Square Moving Average (LSMA)
Smoothed Moving Average (SMMA)
Double Exponential Moving Average (DEMA)
Also you can select SL/PT % levels.

SB_CM_RSI_2_Strategy_Version 2.0(New: Profit booking present which is not present in the previous indicator)
The strategy is based on the indicator posted by @ChrisMoody "CM RSI-2 Strategy Lower Indicator" which is based on "Larry Connors RSI-2 Strategy - Lower RSI"
In this strategy, the longs are placed when a green color is encountered in the rsi in the previous candle and short when the red color is encountered in the rsi.
Although the profits are booked when the rsi crossover the 10 level mark or crossunder the 90 level mark.
Just message in the script if you have any different idea regarding this indicator.
For the original indicator you can refer to :
For Tips to continue :) -
BTC: 1BjswGcRR6c23pka7qh5t5k56j46cuyyy2
ETH: 0x64fed71c9d6c931639c7ba4671aeb6b05e6b3781
LTC: LKT2ykQ8QSzzfTDB6Tnsf12xwYPjgq95h4

Rainbow StrategyThe strategy is based on the following idea:
www.youtube.com
Not a fan of this but no script was present to show this idea's performance.
Best suitable for the 1-minute chart. You can change the ema values as per your needs.
For Tips to continue :) -
BTC: 1BjswGcRR6c23pka7qh5t5k56j46cuyyy2
ETH: 0x64fed71c9d6c931639c7ba4671aeb6b05e6b3781
LTC: LKT2ykQ8QSzzfTDB6Tnsf12xwYPjgq95h4

SB_CM_RSI_2_Strategy_Version 1.0The strategy is based on the indicator posted by @ChrisMoody "CM RSI-2 Strategy Lower Indicator" which is based on "Larry Connors RSI-2 Strategy - Lower RSI"
In this strategy the longs are placed when a green color is encountered in the rsi and short when red color is encountered in the rsi.
Although the profits can be booked at different interval.
Just message in the script if you have any different idea regarding this indicator.
For the original indicator you can refer to :
For Tips to continue :) :
BTC: 1BjswGcRR6c23pka7qh5t5k56j46cuyyy2
ETH: 0x64fed71c9d6c931639c7ba4671aeb6b05e6b3781
LTC: LKT2ykQ8QSzzfTDB6Tnsf12xwYPjgq95h4

Stratergy CM_Ultimate_MA_MTFThis is the script for the idea published by @ChrisMoody
Below is the link to the idea
()
Try the scripts for longer periods (e.g. 1 D).
The script still requires some tweaks as one of the issue is that the shorts and puts are being placed 2 candles after a confirmation is there. So use this strategy at your own risk.
Any inputs will really be helpful.
(Also thanks to @ChrisMoody for such a good indicator).

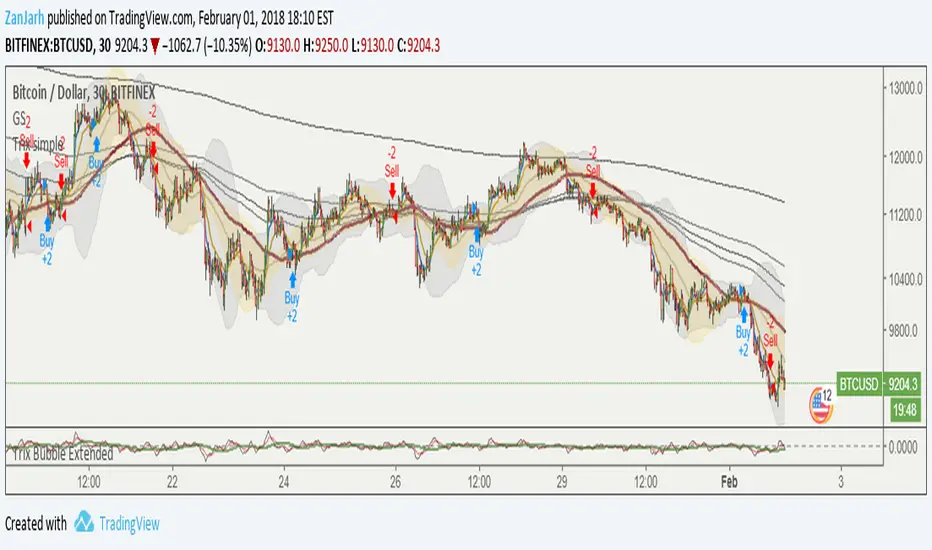
Trend'n Stuff_(MA's and Trix)It's a simple trend following system. Play with the setups. Works best on 30min and up timeframes. Look at the code for better understanding.

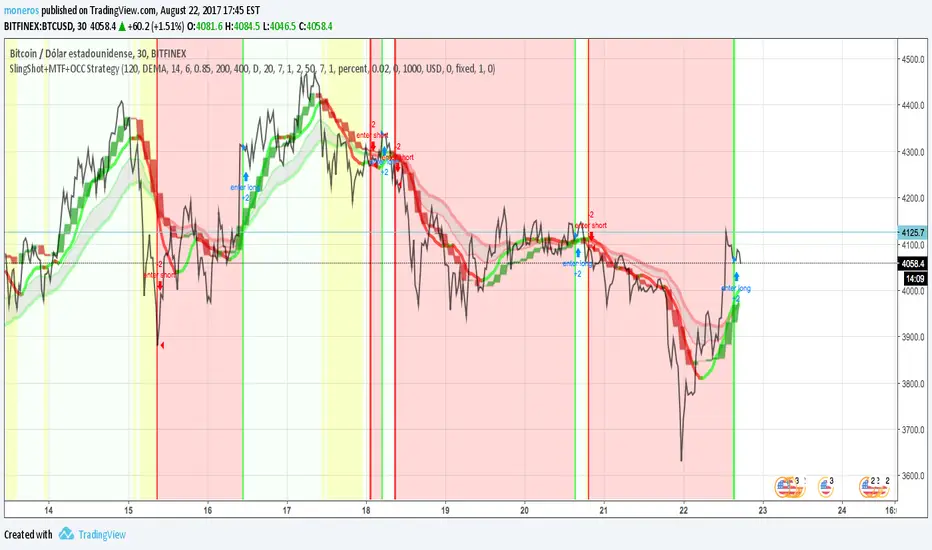
SlingShot + MTF + Open Close Cross StrategyIt's a merge of three really good scripts CM sling shot, CM MTC and Open Close Cross
Indicates open and close with Sling shot and shots after peaks by MTC and OCC.
Yellow zones before drop prices, green bar, red bar for open and close.
imgur.com
Help needed with strategy - Entry is off by 2 candlesHi,
I'm new to TradingView, and would greatly appreciate some help with figuring out where I'm going wrong with this script.
This is a overly simplified version of what I'm actually trying to do, but hopefully it's easier to see the problem.
Here I'd like to create a Buy signal when the fast moving average crosses over the slow moving average, and Sell when the reverse happens.
If I draw arrows when the condition is met then they are one candle later than expected (probably because I'm using the closing values ??).
That not great, but workable.
My real problem comes when I try turning this into a strategy.
Now the signal only triggers 2 candles after the crossover.
What am I doing wrong here?
Thanks,
Gordon

LONG TERM INVESTMENT TECHNICAL STRATEGY SCRIPT200 - WEEKLY MOVING AVERAGE
GREEN LINE IS 200 WEEKS MOVING AVERAGE OF CLOSE
BLUE LINE IS 200 WEEKS MOVING AVERAGE OF LOW MULTIPLIED BY 0.90
RED LINE IS 100 WEEKS MOVING AVERAGE OF CLOSE
CONDITION: GREEN LINE SHOULD BE ABOVE RED LINE AND PRICE SHOULD BE ABOVE GREEN LINE
BUY ONCE THE PRICE IS ABOVE GREEN LINE AND FULFILLS THE CONDITION.
TARGET 1 FOR TIME FRAME 1 YEAR= 2 X GREEN LINE VALUE WHEN PRICE CROSSED IT
TARGET 2 FOR TIME FRAME 3 YEARS= 3 X GREEN LINE VALUE WHEN PRICE CROSSED IT
TARGET 3 FOR TIME FRAME 5 YEARS= 5 X GREEN LINE VALUE WHEN PRICE CROSSED IT
TARGET 4 FOR TIME FRAME 10 YEARS= 10 X GREEN LINE VALUE WHEN PRICE CROSSED IT
STOP LOSS IS TRAILING TO BLUE LINE

Golden Cross, SMA 200 Moving Average Strategy (by ChartArt)This famous moving average strategy is very easy to follow to decide when to buy (go long) and when to take profit.
The strategy goes long when the faster SMA 50 (the simple moving average of the last 50 bars) crosses above the slower SMA 200. Orders are closed when the SMA 50 crosses below the SMA 200. This simple strategy does not have any other stop loss or take profit money management logic. The strategy does not short and goes long only!
Here is an article explaining the "golden cross" strategy in more detail:
www.stockopedia.com
On the S&P 500 index (symbol "SPX") this strategy worked on the daily chart 81% since price data is available since 1982. And on the DOW Jones Industrial Average (symbol "DOWI") this strategy worked on the daily chart 55% since price data is available since 1916. The low number of trades is in both cases not statistically significant though.
All trading involves high risk; past performance is not necessarily indicative of future results. Hypothetical or simulated performance results have certain inherent limitations. Unlike an actual performance record, simulated results do not represent actual trading. Also, since the trades have not actually been executed, the results may have under- or over-compensated for the impact, if any, of certain market factors, such as lack of liquidity. Simulated trading programs in general are also subject to the fact that they are designed with the benefit of hindsight. No representation is being made that any account will or is likely to achieve profits or losses similar to those shown.

Simple Moving Average StrategyThis is a modification of MOVINGAVG CROSS with different inputs of bar lengths that work with a great average percentage with not much drawdown. I ran the strategy tester with GBPUSD on 1 hour time frame.
MACD + SMA 200 Strategy (by ChartArt)Here is a combination of the classic MACD (moving average convergence divergence indicator) with the classic slow moving average SMA with period 200 together as a strategy.
This strategy goes long if the MACD histogram and the MACD momentum are both above zero and the fast MACD moving average is above the slow MACD moving average. As additional long filter the recent price has to be above the SMA 200. If the inverse logic is true, the strategy goes short. For the worst case there is a max intraday equity loss of 50% filter.
Save another $999 bucks with my free strategy.
This strategy works in the backtest on the daily chart of Bitcoin, as well as on the S&P 500 and the Dow Jones Industrial Average daily charts. Current performance as of November 30, 2015 on the SPX500 CFD daily is percent profitable: 68% since the year 1970 with a profit factor of 6.4. Current performance as of November 30, 2015 on the DOWI index daily is percent profitable: 51% since the year 1915 with a profit factor of 10.8.
All trading involves high risk; past performance is not necessarily indicative of future results. Hypothetical or simulated performance results have certain inherent limitations. Unlike an actual performance record, simulated results do not represent actual trading. Also, since the trades have not actually been executed, the results may have under- or over-compensated for the impact, if any, of certain market factors, such as lack of liquidity. Simulated trading programs in general are also subject to the fact that they are designed with the benefit of hindsight. No representation is being made that any account will or is likely to achieve profits or losses similar to those shown.

