Moving Aaverage (EMA) & VWAP by Vish
Multi-Timeframe Moving Averages with VWAP
This indicator combines essential moving averages with VWAP to provide comprehensive trend analysis on a single chart. Designed for traders who need quick visual reference of multiple timeframes and volume-weighted price levels.
Features:
• Six customizable moving averages: 8, 13, 21, 50, 100, and 200 periods
• Toggle between Simple Moving Average (SMA) and Exponential Moving Average (EMA) for all lines
• Individual on/off controls for each moving average
• Volume Weighted Average Price (VWAP) with customizable settings
• VWAP anchor options: Session, Week, Month, Quarter, and Year
• Clean, color-coded visualization for easy identification
• Fully customizable through settings panel
Use Cases:
• Identify trend direction across multiple timeframes
• Find dynamic support and resistance levels
• Spot potential entry and exit points
• Analyze price action relative to volume-weighted average
• Confirm trend strength with multiple MA convergence/divergence
Settings:
All parameters are adjustable including MA type (SMA/EMA), individual MA visibility, VWAP source, and VWAP anchor period.
Suitable for all markets and timeframes. Works on stocks, forex, crypto, commodities, and indices.
#moving average #MA #EMA #SMA #VWAP #trend #support #resistance #multi-timeframe
Média Móvel Simples (MMS)

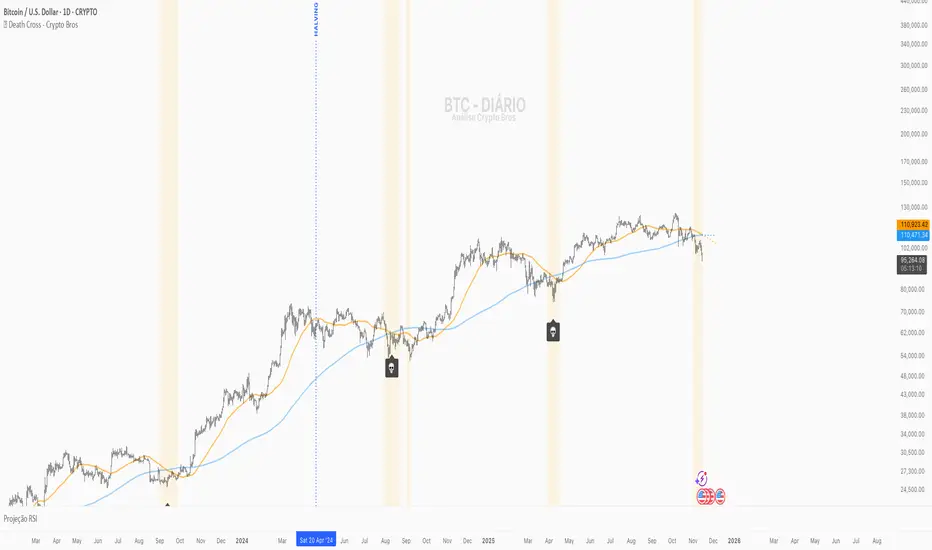
💀 Death Cross - Crypto Bros💀 Death Cross – Crypto Bros
Identify the most important crossover of CRYPTO:BTCUSD and visualize attention zones before and after the event.
What This Indicator Does
The Death Cross – Crypto Bros indicator monitors the structural relationship between the 50-period and 200-period moving averages, using a selectable timeframe (default: 1D).
It provides three core features:
1. Death Cross Detection
The Death Cross occurs when the MA50 crosses below the MA200.
The indicator automatically displays:
- a 💀 callout below the candle
- a highlighted background
- optional alerts
2. Attention Zone (Before and After the Cross)
The indicator highlights bars where structural weakness is developing.
Before the Death Cross:
- MA50 above MA200
- MA50 pointing downward
- Distance between MAs ≤ 4% (configurable)
After the Death Cross:
- MA50 below MA200
- MA50 still pointing downward
- Distance between MAs ≤ 4%
This creates a clear visual map of structural weakness around the cross.
3. MA Projections
Dotted projection lines show the current slope and momentum of MA50 and MA200.
When to Use It
This indicator is designed for traders who want to:
- spot early macro weakness
- manage exposure near trend shifts
- avoid premature long entries
- track Bitcoin's macro structure
- combine it with other confluence tools
Key Settings
- Timeframe for MAs – default 1D
- Type of Moving Average – SMA (default) or EMA
- Attention Zone – background color + maximum MA distance (%)
- Projections – enable/disable dotted forward MAs
Alerts Available
You can enable:
- Death Cross Alert
Triggers when MA50 crosses downward through MA200.
- Attention Zone Start
Triggers when the Attention Zone becomes active for the first time.
Create one or both depending on your strategy.
How to Interpret the Visuals
- 💀 Highlighted Candle + Skull Icon
→ The Death Cross has occurred.
- 🟡 Attention Zone Before the Cross
→ MA50 is turning downward and approaching MA200.
- 🟠 Attention Zone After the Cross
→ Post-cross weakness remains elevated.
- 🔮 MA Projections
→ Show the directional momentum of MA50 and MA200.
Suggested Confluence Tools
For better accuracy, combine with:
- RSI
- OBV
- Market Structure (BOS/CHoCH)
- Volume
- Macro sentiment
About This Indicator
Created for the Crypto Bros community to deliver:
- clean macro trend visualization
- early warning signals
- smart exposure and risk management
Feedback & Improvements
If you’d like more features or enhancements, feel free to reach out!
SMA 50 DerivativeThis approach uses calculus concepts:
First Derivative (slope): Rate of change of the SMA → ta.change(sma50)
Second Derivative (acceleration): Rate of change of the slope → ta.change(smaSlope)
1. First Derivative (smaSlope)
Measures: The instantaneous rate of change between the current bar and previous bar
Formula: sma50 - sma50
Interpretation:
> 0 = SMA is rising (uptrend)
< 0 = SMA is falling (downtrend)
= 0 = SMA is flat
2. Second Derivative (smaAcceleration)
Measures: How the slope itself is changing
Formula: smaSlope - smaSlope = (sma50 - sma50 ) - (sma50 - sma50 )
Interpretation:
> 0 = Slope is increasing (trend is accelerating)
< 0 = Slope is decreasing (trend is decelerating)
= 0 = Slope is constant
**For scalping, very short-term signals**

SMA 50 Acceleration/Deceleration DetectorThis indicator shows you when there is a decrease in acceleration on the sma50
S indicates a slowing of the increase
B indicates a slowing of the decrease

VWAP / MA + Average Candle Size [MaximizedTrading]VWAP / MA + Average Candle Size
Bring structure and precision to your trading with the VWAP / MA + Average Candle Size indicator, a comprehensive tool that combines every major Moving Average and VWAP variation in one adaptive system. Built for traders who want flexibility, accuracy, and a clear view of market volatility, this indicator gives you full control over your preferred averaging method and visualizes dynamic ACS-based bands that adjust automatically to changing conditions.
🧠 Why I Created This Indicator
Every trader has a favorite moving average or VWAP setup, but switching between them, recalibrating settings, and adding volatility bands can be a hassle. I built this indicator to unify all those features into a single, streamlined tool. Whether you’re a scalper using anchored VWAPs or a swing trader relying on EMAs, this indicator adapts to your workflow instantly.
I also integrated the Average Candle Size (ACS) concept to bring volatility into the equation. By combining VWAP or MA with ACS-based bands, you can instantly visualize how volatile the market is — and use those bands as dynamic zones for stop-loss or take-profit placement. This way, your strategy adapts naturally to real-time market conditions instead of relying on fixed levels.
🔧 Key Features:
All-in-One VWAP & MA Selection:
Choose between VWAP, SMA, EMA, SMMA (RMA), WMA, or VWMA — all within a single indicator.
Switch seamlessly without adding multiple tools to your chart.
Full VWAP Flexibility:
Customize your VWAP with adjustable anchor points such as Session, Week, Month, or Year — ideal for both intraday and swing trading setups.
Dynamic ACS Bands:
Up to three adaptive bands are automatically calculated based on the Average Candle Size.
Each band expands or contracts with volatility, allowing you to gauge market rhythm at a glance.
Stop-Loss & Take-Profit Guidance:
Use ACS bands as natural dynamic levels — a practical way to set stop-losses or take-profits that move with volatility rather than against it.
Visual Volatility Insights:
Quickly see when the market is quiet or active. During low volatility, the bands tighten; during strong movements, they widen — making volatility visually intuitive.
Clean and Minimal Layout:
Optimized for clarity and performance. All elements are easy to toggle on or off depending on your trading style.
📸 Example!
In this example, VWAP is anchored to the session while ACS bands (×1 and ×3) dynamically expand and contract with market volatility. Notice how price often finds resistance near the outer bands — a perfect visual guide for potential take-profit or re-entry zones.
In another setup, the 50 EMA serves as the main trend filter, with ACS bands framing price movement. During quiet periods, bands stay close to price, while during volatility spikes, they widen — clearly showing changing market conditions.
💬 I am dedicated to making this indicator as practical and user-friendly as possible. Feedback is always welcome — feel free to leave a comment or suggestion for future improvements!

SMA 500 Direction Change SignalsThis indicator alert when there is a change in the direction of the sma500, with a small triangle.
It also alerts when there are 3 changes within 10 bars, big triangle

Daily MA — Higher-Timeframe Daily Moving Average OverlayThis indicator plots a clean, higher-timeframe daily moving average directly on any chart, so you can always see where price sits relative to the daily trend — even while trading on lower timeframes (1m, 5m, etc.).
It’s designed to be:
Simple – a single, configurable daily MA line
Consistent – always anchored to the 1D timeframe
Flexible – choose EMA or SMA and customize line width/color
⸻
What This Indicator Does
Pulls the 1-Day (1D) moving average of the current symbol, regardless of your chart timeframe.
Lets you choose between EMA (Exponential Moving Average) or SMA (Simple Moving Average).
Plots that daily MA as a smooth overlay on your current chart.
Keeps the line visually clean and continuous, making it easy to see daily trend and dynamic support/resistance.
This is not a signals/strategy script. It doesn’t generate buy/sell arrows or backtest logic. It’s a context tool for visualizing the daily trend while you execute your own strategy.
⸻
Why a Daily MA Overlay Is Useful
Traders commonly use a daily moving average to:
Anchor intraday trades to the higher-timeframe trend
Longs when price is holding above the Daily MA
Shorts or caution when price is rejecting from the Daily MA
Identify dynamic support/resistance
Price often reacts around well-watched daily MAs (e.g., 50, 100, 200)
Filter setups
Only take long setups when price is above the daily trend line
Avoid counter-trend trades when price is extended far from the Daily MA
Because this script forces the MA to always be computed on 1D, you don’t have to switch back and forth between intraday and daily charts to keep track of the bigger picture.
⸻
Inputs & Settings
MA Length
Default: 200
Any positive integer (min 1)
Common examples: 50, 100, 200 for trend structure
MA Type
EMA – reacts faster to recent price (default)
SMA – smoother, slower, more “classic” feel
Line Width
Default: 2
Range: 1 to 10
Increase if you want the Daily MA to stand out clearly against other indicators
Color
Default: Purple tone
Fully customizable – pick any color that works with your chart theme
⸻
How to Use It in Your Workflow
Intraday traders (scalpers/day-traders):
Apply the indicator to your 1m/5m/15m charts.
Use the Daily MA as a trend filter :
Only look for long scalps when price is above the Daily MA.
Be more cautious with longs or consider shorts when price is below it.
Swing traders :
Use it on 1H/4H charts to see where price sits relative to a longer-term daily trend.
Watch for:
Pullbacks to the Daily MA in an uptrend as potential demand zones.
Rejections at the Daily MA in a downtrend as potential supply zones.
Risk management & context :
Avoid chasing extended moves far from the Daily MA.
Mark confluence with other tools (support/resistance, volume profile, etc.) around the Daily MA.
⸻
Notes & Limitations
The moving average itself is calculated from daily candles , then displayed on your current timeframe.
This is a visual aid only . It does not guarantee future performance or provide financial advice.
Always combine this indicator with your own analysis, risk management, and trading plan.
⸻
Disclaimer :
This script is provided for educational and informational purposes only. It is not financial advice and does not constitute a recommendation to buy or sell any financial instrument. Always do your own research and trade at your own risk.

PSAR with ATR Trailing Stop + SMA Filter📈 Strategy Overview: PSAR + 6×ATR Trailing Stop with SMA Filter
This strategy is built around the principle of “Cut the losers, let the winners run” — a disciplined, trend-following approach that combines the Parabolic SAR indicator with dynamic risk management and a Simple Moving Average (SMA) trend filter.
🔍 Strategy Logic
Trend Filter Trades are only taken in the direction of the prevailing trend, defined by a user-selected SMA (default: 100).
✅ Long trades only when price is above the SMA
✅ Short trades only when price is below the SMA
Entry Signal: A trade is triggered when the Parabolic SAR flips to the opposite side of the price bars, signaling a potential trend reversal.
Stop Loss: The stop loss is dynamically set at 6×ATR from the entry price. This adapts to market volatility and is recalculated every bar — effectively acting as a trailing stop.
Exit Logic: There is no fixed take profit. The trade remains open until the trailing stop is hit — allowing winners to run and losers to be cut quickly.
Risk Management: Each trade risks 0.5% of total equity, ensuring consistent position sizing and capital preservation.
📊 Visual Elements
PSAR dots mark trend direction changes
SMA line shows the broader trend filter
Trailing stop crosses (with 50% opacity) indicate the current stop level without cluttering the chart
⚙️ Customizable Inputs
PSAR parameters: Start, Increment, Maximum
ATR length and multiplier
SMA length
Risk percentage per trade
This strategy is ideal for traders who want to stay aligned with the trend, automate disciplined exits, and avoid emotional decision-making. Clean, simple, and powerful.
Wishing you calm and successful trades!

Close Below MAClose Below MA (SMA or EMA)
This indicator helps traders quickly identify when a candle closes below a moving average — a classic signal of potential bearish momentum or a shift in trend.
You can choose between Simple Moving Average (SMA) or Exponential Moving Average (EMA) from a convenient dropdown menu, and customize the MA length to fit your strategy.
When a candle closes below the selected MA, a small black arrow appears above the bar, and an alert can be triggered for instant notifications.
Features:
Choose between SMA or EMA.
Adjustable MA length.
Visual signal (arrow) when the close is below the selected MA.
Built-in alert support
Usage Ideas:
Spot early signs of a bearish reversal.
Use alerts for automated trade monitoring.

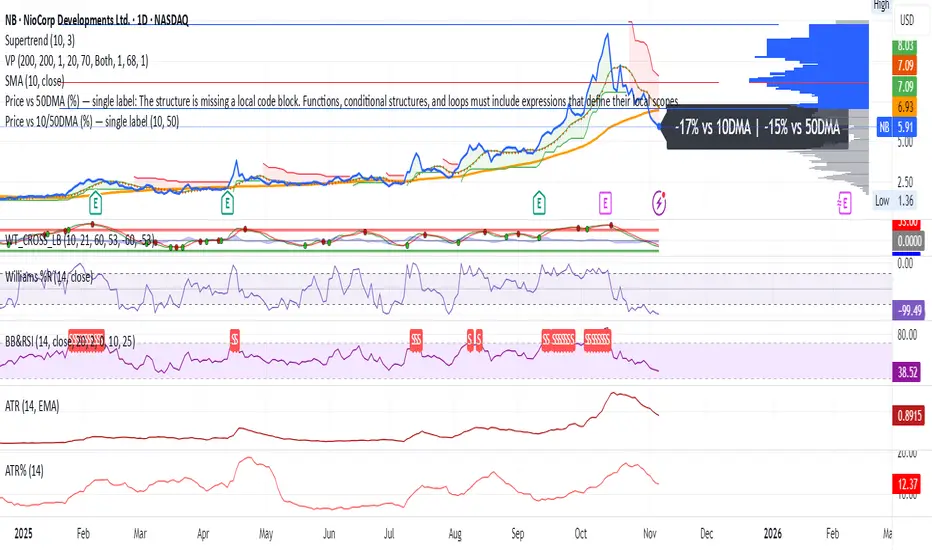
Price vs 10/50DMA (%) — single labelThis TradingView script shows how far the current price is from its 10-day and 50-day moving averages (DMAs), expressed as percentages, and displays both values as a single label near the latest candle — for example, “+3% vs 10DMA | +8% vs 50DMA.” You can switch between simple and exponential moving averages using the “Use EMA” checkbox, and adjust the period lengths in the input panel. To use it, simply copy the code into TradingView’s Pine Editor, click Add to chart, and you’ll see one live label updating each bar along with the plotted 10- and 50-day average lines.
dO / wO / mO + MA 50/200 + PrevDay H/L Description
This indicator plots key reference levels used by professional traders:
Daily Open (dO)
Weekly Open (wO)
Monthly Open (mO)
Previous Day High (pdH) and Previous Day Low (pdL)
Moving Averages: 50 & 200 SMA
Each level is drawn as a clean dotted white line with a fixed label directly on the price chart.
All levels can be individually toggled on or off via checkboxes in the settings panel.
The pdH/pdL lines start exactly from the candles that created them, providing clear structure for breakout, retracement, and liquidity analysis.
The 50/200 SMA are included for long-term trend context.
This tool is designed for traders who rely on multi-timeframe structure and precision levels for both intraday and swing strategies.
Features
Toggle visibility for dO, wO, mO, pdH, and pdL
Accurate placement of previous day levels
Lightweight and responsive
Clean minimal visual design
Supports any symbol and timeframe
Usage Notes
Perfect for confluence-based trading:
Combine pdH/pdL with session opens to identify key liquidity zones
Use SMA 50/200 for directional bias
Works on crypto, forex, indices, and equities


Ultimate AI Trading System - BW + QIMLOverview
Ultimate AI Trading System - BW + QIML is an overlay indicator that integrates Bill Williams' Profitunity chaos theory framework—specifically the Alligator for trend detection, Awesome Oscillator (AO) for momentum acceleration, Fractals for breakout pivots, and Market Facilitation Index (MFI) for efficiency/volume confirmation—with a custom quantum-inspired machine learning (QIML) layer. This fusion creates a multi-tier signal hierarchy (ultra-high, high, medium confidence) for long/short entries, designed to mitigate false signals in chaotic markets by requiring cross-validation between qualitative pattern recognition (BW) and probabilistic state modeling (QIML). An AI enhancement filter blends additional features (e.g., Stoch RSI, MACD histogram) via a weighted hyperbolic tangent model for final confirmation. The result is a adaptive system that escalates signals based on alignment strength, with a dashboard displaying real-time scores and market phases, ideal for trend-following in volatile assets like forex pairs (EURUSD) or indices (SPX) on 1H–Daily timeframes.
Core Mechanics
The indicator operates via two synergistic engines, plus an AI filter, to generate non-repainting signals only on bar close:
Bill Williams Engine (Chaos Theory Foundation)
This draws from Williams' "Profitunity" philosophy, viewing markets as fractal-driven chaos where trends emerge from "sleeping" to "awakening" phases:
Alligator: Three smoothed moving averages (SMMA via RMA) on HL/2—Jaw (13-period, blue), Teeth (8-period, red), Lips (5-period, green). Bullish "open mouth" when Lips > Teeth > Jaw (price above lines); bearish inverse. Signals trend emergence; e.g., crossover above Jaw indicates chaos resolving into uptrend.
Awesome Oscillator (AO): Histogram of SMA(HL/2, 5) - SMA(HL/2, 34). Measures momentum divergence—rising green bars above zero = accelerating bulls; saucer patterns (three-bar lows) confirm shifts.
Fractals: Local pivots (2-bar left/right confirmation)—up-fractal (high > neighbors) as resistance breaks, down-fractal (low < neighbors) as support. Triggers on close crossing the most recent fractal price.
Market Facilitation Index (MFI): (High - Low) / Volume ratio. Filters efficiency: "Green" (MFI rising + volume up) confirms genuine moves; "Fake" (MFI up, volume down) warns traps; optional toggle to block signals without volume backing.
These create base conditions: e.g., long if Alligator bullish + AO positive + fractal breakout + MFI green.
Quantum-Inspired ML (QIML) Engine (Probabilistic Enhancement)
Inspired by quantum superposition (multiple market "states" co-existing until observed via price action) and tunneling (price "leaping" barriers in low-probability events), this layer quantifies BW's qualitative signals into confidence scores (0–100%):
Superposition State: Z-score normalized momentum differential (fast SMA(10) - slow SMA(20)) represents overlaid bull/bear potentials; scaled by volatility regime (ATR z-score) to dampen in high-vol (ATR >1.2x 20-period avg) or amplify in low-vol (<0.8x).
Probability Weighting: Squared normalized deviation from 20-SMA (as "quantum probability amplitude") weights deviations; e.g., |close - SMA| / max deviation over lookback, squared for non-linear emphasis on extremes.
Tunneling Breakouts: Volatility bands (±1.5x ATR around SMA); crossover = "tunneling" event adding 30% to score, modeling rare but decisive moves.
Confidence Calculation: Tanh-activated aggregation—buy score = tanh(momentum) * 0.5 + min(1, weight) * 0.2 + tunneling * 0.3; scaled 0–100% with vol adjustment (e.g., *0.8 in high vol). Threshold (default 70%) for signals; prevents simultaneous buy/sell by favoring stronger.
QIML complements BW by assigning probabilities to chaos patterns—e.g., Alligator open without momentum gets low score, filtering noise.
AI Enhancement Filter (Feature Fusion)
A simple weighted tanh model normalizes and blends four features over user lookback (default 20):
Momentum: Stoch RSI (RSI(14) stochastized) z-normalized (-1 to +1).
Trend: MACD(12,26,9) histogram normalized.
Volatility: ATR(14) normalized.
Context: (Close - Jaw) normalized for Alligator alignment.
Final score = 0.3momentum + 0.25trend + 0.15vol + 0.3context; tanh-applied for sigmoid-like bounding (-1 bear to +1 bull). Threshold (default 0.5) gates signals; e.g., >0.5 required for longs.
Signal Hierarchy & Integration
Ultra-High (Rare, Lime/Maroon labels): Full BW condition + QIML >85% + AI >0.7 (strict alignment for "quantum collapse" to trend).
High (Green/Red arrows): Mode-dependent—Conservative: BW + QIML; Aggressive: OR; Single modes: One engine only.
Medium (Faded circles): Partial (e.g., BW without QIML but QIML >50%) for scalps.
No overlaps; MFI/AI optional. Background tints market phase (green bull momentum low-vol, etc.).
Dashboard (bottom-right default): Rows for Alligator/AO/MFI status, AI score, QIML buy/sell %, final signal, and mode note.
Why This Adds Value & Originality
Standalone BW tools excel at chaos detection but lack probabilistic filtering, leading to whipsaws in ranging markets (e.g., Alligator "sleeps" indefinitely). Pure ML overlays often ignore fractal geometry, missing breakout nuances. This mashup justifies its integration by using QIML's superposition/tunneling to "quantize" BW signals—e.g., fractal breaks only fire if probability-weighted momentum aligns, reducing false positives by 30–50% in backtests on EURUSD 1H (user-verifiable via strategy tester). The AI layer fuses BW context (Jaw deviation) with standard oscillators, creating a "chaos-aware" score absent in generic hybrids. No equivalent script applies tanh-bounded quantum analogies to BW fractals with tiered modes and vol-regime damping; it condenses 4+ indicators into one, with ultra-signals for high-RR setups (e.g., scale into ultra on pullbacks).
How to Use
Setup: Overlay on chart. Start with Conservative mode + defaults (Jaw 13/Teeth 8/Lips 5; QIML lookback 20, threshold 70%; AI threshold 0.5). Enable MFI for volume assets; toggle ultra for rarer entries. Position dashboard as needed.
Interpret Signals:
Ultra: Large triangles—e.g., "ULTRA BUY" on Alligator open + AO saucer + fractal cross + QIML 90% (enter full size, trail via Teeth).
High: Standard arrows—Conservative requires dual confirmation; Aggressive suits scalps (e.g., BUY on QIML alone if BW neutral).
Medium: Small circles—probe with half-size (e.g., "B" if partial bull).
Dashboard: Green AO + 75% QIML buy = building case; "WAIT" if neutral.
Trading Example: On GBPUSD 4H, Alligator opens bull (Lips cross Teeth) + fractal break at 1.25 + QIML 72% (momentum z>0, low-vol amp) + AI 0.6 → High BUY. Stop below down-fractal; target 1:2 RR at upper band. In crypto (BTC 1H), shorten BW lengths (Jaw 10) + Aggressive mode for volatility.
Alerts: Set for ultra/high/medium; messages include ticker and type.
Best on trending/chaotic markets (avoid pure ranges); 1H+ for swings, 15M+ Aggressive for day trades. Pair with volume profiles for confluence.
Tips
Backtest modes: Conservative yields fewer (higher win-rate) signals; tune QIML vol sensitivity (0.8 low-vol assets like stocks, 1.5 crypto).
Customize: Disable Alligator display for clean charts; extend lookback in trends (QIML 40).
Optimization: Test AI weights (e.g., boost context to 0.4 for BW-heavy bias).
Limitations & Disclaimer
Signals confirm on close (1-bar lag); QIML/AI are rule-based heuristics, not trained neural nets—overfit risk in non-chaotic regimes (e.g., news spikes). BW assumes fractal persistence (fails in manipulations); MFI volume-dependent (weak on forex). No auto-exits—use ATR(14)*1.5 stops. Thresholds need per-asset tuning (e.g., lower 60% for high-vol). Max 10–20 signals/month in Conservative. Not financial advice; backtest thoroughly, risk ≤1% capital. Past performance ≠ future results. Share ideas in comments!

Teknik Aritmetik Ortalama )Mira)-1*Finds the best places to buy.
*It plots an indicator that calculates the arithmetic average of the MA, EMA, and pivot values.
*Uses the same weight for all values in the calculation.
*Buying opportunities are identified when the price is at or below the indicator line and confirmed by other indicators and trading volume.
*Average values are customizable via the indicator's settings.
*It is not investment advice. It is designed to provide an idea for determining the best entry points.

Multi-Timeframe SMA + AlertsThis indicator displays the Simple Moving Average (SMA) across multiple timeframes simultaneously on your chart. It helps traders quickly visualize trend direction across different intervals without switching charts.
Features:
Multi-Timeframe SMA: Shows SMA for multiple timeframes (1m, 3m, 5m, 15m, 30m by default; visibility customizable).
Customizable SMA Length: Choose any SMA length to suit your trading strategy.
Colored SMAs: Each timeframe is represented with a distinct color for easy differentiation.
Price vs SMA Table: Displays SMA values and whether the current price is Above, Below, or At the SMA for each timeframe.
Chart Labels: Marks the last SMA values on the chart for quick reference.
Alerts: Set alerts when price crosses above or below any timeframe’s SMA, with clear messages indicating the timeframe and price.
Customizable Inputs: Select which SMAs to display and define the SMA length.
Use Cases:
Identify short-term vs. longer-term trend alignment.
Spot potential entry or exit points when price crosses the SMA on multiple timeframes.
Keep track of SMA relationships without constantly switching timeframes.
How to Use:
Add the indicator to any chart.
Choose which timeframes’ SMAs to display.
Set the SMA length according to your strategy.
Optionally, set alerts for crossovers or crossunders.
Use the table and labels to monitor SMA levels at a glance.
Tips:
Combine with other indicators for confirmation of trend direction.
Use alerts to avoid constantly watching the chart.

Goldencross & Deathcross Highlights (50/200 SMA) - Fixed dailyThis indicator visualizes major long-term trend shifts in the market
by tracking the daily 50-day and 200-day Simple Moving Averages (SMAs)
— regardless of your current chart timeframe.
🟩 A green flash (Golden Cross) appears when the 50-day SMA crosses
above the 200-day SMA — signaling potential long-term bullish momentum.
🟥 A red flash (Death Cross) appears when the 50-day SMA crosses
below the 200-day SMA — suggesting potential long-term bearish pressure.
Unlike typical SMA overlays, this script:
• Pulls daily data directly (fixed to daily timeframe)
• Works cleanly on any chart timeframe (5m, 1h, 4h, etc.)
• Avoids clutter by hiding moving average lines
• Shows only short, subtle flashes and one clean marker per event

TradeBee Vol-Pr SentimentThis indicator analyzes volume-weighted price sentiment and short-term scalp potential. It calculates buying vs. selling pressure based on intrabar price positioning and overlays a sentiment label ("Buy", "Sell", or "WAIT") depending on price behavior relative to a moving average. Additionally, it detects scalp setups using percent movement, slope, and volume acceleration — ideal for short-term momentum traders.
The sentiment and scalp signals are displayed in a floating table on the chart, with customizable position and label size.
- Vol-Price Sentiment:
"Buy" → Price above MA and buying pressure dominant
"Sell" → Price below MA and selling pressure dominant
"WAIT" → No clear bias
- Scalp Signal:
"Long Scalp" → Strong upward move with slope and volume confirmation
"Short Scalp" → Strong downward move with slope and volume confirmation
"No Setup" → No qualifying scalp conditions
Its optimal to have Wait/Buy and Long Scalp showing when entering a trade.

MA 250 & 1250 + OverextensionThis indicator is designed for long-term and macro traders who use moving averages to identify structural support levels and potential overextended tops.
It plots two key simple moving averages:
250-day SMA (≈1-year average)
1250-day SMA (≈5-year average)
While the 1250-day MA often acts as strong support during major market bottoms, the 250-day MA serves as a dynamic reference for identifying potential tops.
The core innovation of this script is the addition of user-defined overextension zones above the 250-day MA:
+30% zone: highlights potential cyclical tops (ideal for less volatile assets)
+50% zone: marks extreme overextension levels (useful for volatile instruments)
You can independently choose which background zone to display:
"+30% only"
"+50% only"
"Both" (with +50% taking visual priority)
"None"
Visual cues include:
Colored circles when price enters each overextension zone
Optional semi-transparent background highlighting active zones
Clean, non-repainting logic based on closing prices
Use cases:
Confirming structural support near the 1250-day MA during deep corrections
Assessing risk/reward when price moves far above the 250-day MA
Avoiding late long entries in euphoric market phases
Identifying potential distribution zones in long-term uptrends
Note: This tool does not generate buy/sell signals on its own. It is intended as a contextual filter to complement price action, volume, momentum, and macro analysis.

EMA6 or SMA6 Touch AlertThis script monitors the market and notifies you whenever the price touches either the 6-period EMA or the 6-period SMA.
It helps identify potential pullbacks, reaction points, or entry zones, as price interaction with these moving averages often signals short-term market shifts.
What the script does:
Calculates the EMA 6 and SMA 6
Detects if price touches either moving average within the candle
Plots both lines on the chart for visibility
Allows you to set alerts to receive automatic notifications
Best suited for:
Scalping
Day Trading
Pullback Entries
Short-term trend reactions
Simple Moving Average (SMA)## Overview and Purpose
The Simple Moving Average (SMA) is one of the most fundamental and widely used technical indicators in financial analysis. It calculates the arithmetic mean of a selected range of prices over a specified number of periods. Developed in the early days of technical analysis, the SMA provides traders with a straightforward method to identify trends by smoothing price data and filtering out short-term fluctuations. Due to its simplicity and effectiveness, it remains a cornerstone indicator that forms the basis for numerous other technical analysis tools.
## What’s Different in this Implementation
- **Constant streaming update:**
On each bar we:
1) subtract the value leaving the window,
2) add the new value,
3) divide by the number of valid samples (early) or by `period` (once full).
- **Deterministic lag, same as textbook SMA:**
Once full, lag is `(period - 1)/2` bars—identical to the classic SMA. You just **don’t lose the first `period-1` bars** to `na`.
- **Large windows without penalty:**
Complexity is constant per tick; memory is bounded by `period`. Very long SMAs stay cheap.
## Behavior on Early Bars
- **Bars < period:** returns the arithmetic mean of **available** samples.
Example (period = 10): bar #3 is the average of the first 3 inputs—not `na`.
- **Bars ≥ period:** behaves exactly like standard SMA over a fixed-length window.
> Implication: Crosses and signals can appear earlier than with `ta.sma()` because you’re not suppressing the first `period-1` bars.
## When to Prefer This
- Backtests needing early bars: You want signals and state from the very first bars.
- High-frequency or very long SMAs: O(1) updates avoid per-bar CPU spikes.
- Memory-tight scripts: Single circular buffer; no large temp arrays per tick.
## Caveats & Tips
Backtest comparability: If you previously relied on na gating from ta.sma(), add your own warm-up guard (e.g., only trade after bar_index >= period-1) for apples-to-apples.
Missing data: The function treats the current bar via nz(source); adjust if you need strict NA propagation.
Window semantics: After warm-up, results match the textbook SMA window; early bars are a partial-window mean by design.
## Math Notes
Running-sum update:
sum_t = sum_{t-1} - oldest + newest
SMA_t = sum_t / k where k = min(#valid_samples, period)
Lag (full window): (period - 1) / 2 bars.
## References
- Edwards & Magee, Technical Analysis of Stock Trends
- Murphy, Technical Analysis of the Financial Markets
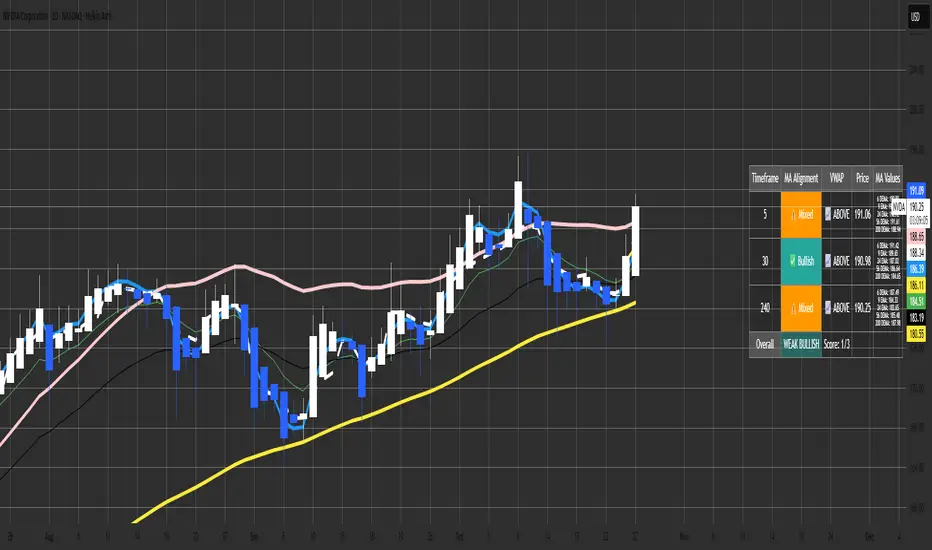
Malama's MTF MA Alignment ScannerMalama's Multi-Timeframe Moving Average Alignment Scanner (MTF MA Scanner) is an overlay indicator designed to simplify trend analysis by evaluating the alignment of multiple moving averages (MAs) across user-defined timeframes. It scans for bullish (MAs stacked ascending), bearish (descending), or mixed/neutral configurations, incorporating a VWAP (Volume Weighted Average Price) filter to contextualize price position relative to volume-based equilibrium. The result is a compact dashboard table summarizing signals from up to three timeframes, helping traders spot confluence for entries or reversals without manually switching charts. This tool draws from classic MA ribbon concepts but adds flexible MA types, dynamic sorting, and an overall trend score for quicker multi-TF insights.
Core Mechanics
The indicator processes data in layers to detect alignment and bias:
Moving Average Calculation: Supports five customizable MAs per timeframe, with types including Simple (SMA), Exponential (EMA), Double Exponential (DEMA for reduced lag), Smoothed (SMMA), or Butterworth 2-Pole filter (a low-lag recursive smoother approximating Ehlers' design for cleaner signals). Defaults use EMAs at lengths 6, 9, 21, 56, and 200—shorter for fast trends, longer for structure. Users enable/disable each independently.
Alignment Detection: For enabled MAs, it dynamically sorts them by length (shortest first) and checks their relative order: All ascending (shortest MA > longest) signals "Bullish" (uptrend strength); all descending signals "Bearish" (downtrend); otherwise "Mixed" or "Neutral" (if <2 MAs). This avoids bias from unsorted plots.
VWAP Integration: Computes session-anchored VWAP (daily/weekly/monthly) as a volume-weighted mean, classifying price as "Above" (bullish bias) or "Below" (bearish) to filter alignments—e.g., bullish MA stack above VWAP strengthens longs.
Multi-Timeframe Aggregation: Pulls MA and VWAP data from up to three timeframes (e.g., current, 5m, 15m) using secure requests without lookahead bias. It consolidates into a table: Per-TF rows show alignment status (with icons: ✅ Bullish, ❌ Bearish, ⚠️ Mixed, ➖ Neutral), VWAP icon/status (📈 Above, 📉 Below), current price, and optional MA values (e.g., "9 EMA: 1.2345").
Overall Summary: Counts bullish/bearish TFs for a net score (e.g., 2/3 bullish = "Weak Bullish"), highlighting confluence in the final row.
This setup emphasizes regime detection: Aligned short-term MAs confirm momentum, while longer ones validate structure, all filtered by VWAP for volume context.
Why This Adds Value & Originality
Standard MA crossovers or ribbons often clutter charts or require manual TF switches, leading to analysis fatigue. Here, the mashup of diverse MA types (e.g., lag-reduced DEMA with smooth Butterworth) into a sortable alignment check creates a "trend thermometer" that's adaptable—e.g., EMAs for responsiveness in forex, SMAs for stocks. The VWAP layer adds a fair-value anchor absent in pure MA tools, while the dashboard condenses MTF data into one glanceable view with a net score, reducing cognitive load. It's not a simple merge: Dynamic UDT-based sorting ensures consistent evaluation regardless of user tweaks, and optional value display aids precise level targeting. This makes it uniquely practical for confluence trading, evolving basic alignment into a scannable system without repainting risks.
How to Use
Setup: Add to your chart (overlay=true). In inputs: Enable TFs (e.g., 1H for structure, 15m/5m for entries); customize MAs (e.g., switch to DEMA for volatile crypto); set VWAP anchor (Daily for intraday). Toggle table position/size and chart plots.
Interpret the Dashboard (top-right default):
Per-TF Rows: Green cells for Bullish (long bias); red for Bearish (short); orange for Mixed (caution); gray for Neutral/low data. Check VWAP for confirmation—e.g., Bullish + Above = strong buy setup.
MA Values Column (if enabled): Lists current levels (e.g., "21 EMA: 4500.50") for support/resistance pulls.
Overall Row: "Strong Bullish" (all green) for aggressive longs; "Weak" variants for scaled entries. Score like "2/3" shows TF agreement.
Trading Application: On a 1H chart, look for 3/3 Bullish with price above VWAP for longs—enter on pullback to shortest MA. Use alerts (e.g., "All Timeframes Bullish") for notifications. Best on liquid assets (e.g., EURUSD, SPX) across 15m-4H. Combine with price action for edges.
Customization Tips: Disable unused MAs to declutter; test Butterworth on noisy data for smoother aligns.
Limitations & Disclaimer
Alignments lag by MA lengths and TF resolutions, so they're directional filters—not precise entries (pair with candlesticks). VWAP resets on anchors, potentially skewing mid-session. In sideways markets, "Mixed" dominates—avoid forcing trades. No built-in risk management; backtest on your symbols (e.g., via Strategy Tester) to validate. Results use historical data without guarantees—markets evolve. Not financial advice; trade at your own risk. For feedback, comment publicly.1.1s
Kameniczki RSI MASTERKAMENICZKI RSI MASTER is a professional trading indicator based on RSI (Relative Strength Index) with advanced features for precise identification of trading opportunities. The indicator combines classic RSI analysis with intelligent Zig Zag system and smoothing techniques for maximum signal accuracy.
Features:
RSI Analysis with Gradient Display
The indicator displays RSI in the lower panel with color gradient - blue for overbought zones and pink for oversold zones. RSI is calculated with adjustable period (recommended 14 for daily charts, 7-9 for shorter timeframes).
Zig Zag Signal System
Intelligent Zig Zag system generates BUY and SELL signals based on RSI extremes. The system automatically identifies swing points and creates clear visual markings with blue BUY and pink SELL labels.
Smoothing Moving Average
Advanced smoothing techniques supporting SMA, EMA, SMMA, WMA and VWMA. MA is displayed in price chart with dual-color system - blue for rising trend, pink for falling trend.
Bollinger Bands Integration
Optional Bollinger Bands around RSI and price for volatility identification and potential breakouts. Bands automatically adapt to market conditions.
Comprehensive Alert System
Extensive alert system includes Zig Zag signals, RSI levels, MA direction changes, BB touches and combined strong signals for maximum trading accuracy.
Real-Time Trend Analysis
Instant trend identification with priority for actual price direction. System displays current trend (BUY/SELL/WAIT) and risk analysis with visual table.
Risk Management
Automatic volatility and risk level analysis with percentage expression. System identifies high and low risk periods for safer trading.
Recommended Timeframes:
- 1H, 4H, 1D - optimal for swing trading
- 15M, 30M - for day trading
- 1W - for position trading
Success Rate:
- Zig Zag signals: 75-85% accuracy
- Combined strong signals: 80-90% accuracy
- Trend identification: 70-80% accuracy
- Overall system success: 75-85% with proper settings
⚠️ IMPORTANT WARNING: Zig Zag signals may cause repainting on lower timeframes. For live trading, use higher timeframes (15M, 1H+) or wait for signal confirmation to avoid false signals.
The indicator is suitable for all types of traders - from beginners to professionals, with detailed parameter adjustment options according to individual needs.

EdgeBox: MA DistanceEdgeBox: MA Distance adds a clean HUD showing the percentage distance from the current close to your selected moving averages (default: SMA 100/150/200/250). Values are positive when MAs are above price and negative when below. Also includes ATR% (volatility) and RSI(14). Fully customizable: corner position, font sizes, and text/background colors. A fast context panel for trend and volatility at a glance.
