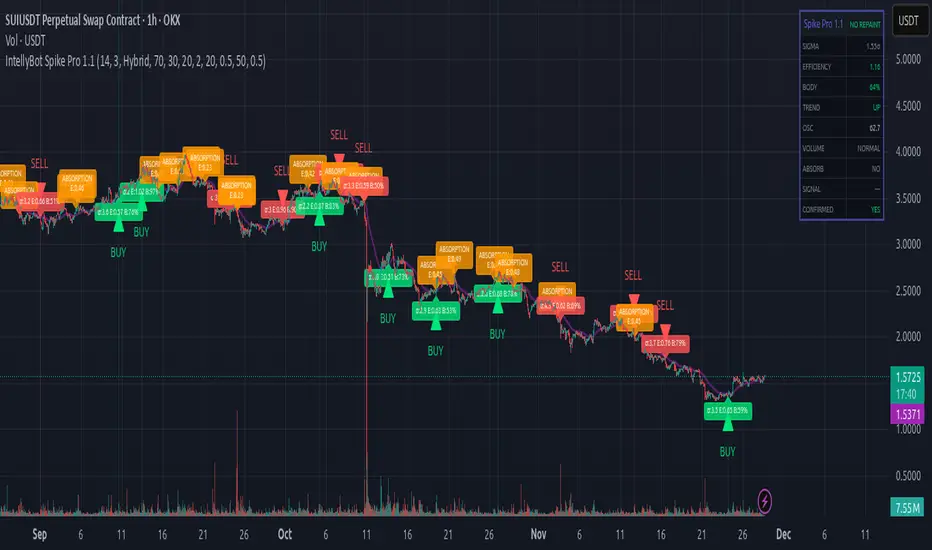
IntellyBot Spike ProIntellyBot Spike Pro
IntellyBot Spike Pro helps you quickly spot unusual market activity and highlights only the signals that truly matter. It cuts out the noise and marks candles where something “big” is happening – whether it's strong buying, strong selling, or a possible trend reversal.
What the script does for you
Detects real volume spikes:
It identifies moments when trading activity suddenly increases, often caused by large market orders or the start of a new move.
Generates clean Buy and Sell signals:
A signal is only shown when multiple conditions line up (trend direction, candle strength, momentum, etc.). This reduces false alerts and keeps things simple.
Spots absorption (hidden strength or weakness):
The script highlights candles where volume is high but price barely moves.
This can be a sign that big players are absorbing orders before a potential reversal.
No repainting:
All signals are based on confirmed candles and will not change later.
Includes a visual dashboard:
A small on-chart panel shows key information at a glance, such as trend, volume strength, efficiency, oscillator reading, and active signals.
Perfect for traders who want to…
use volume as an early indicator
catch real breakouts and avoid fake moves
identify trend shifts sooner
get clean, visual signals without combining many tools
Sigma
Anchored Three Sigma RangeThis indicator serves to display the standard deviation model based on open price from the selected anchored timeframe. Per statistics the price may stay within the three sigma range most of the time, most significantly within first sigma range 68% of the time.
If price breaks the statistical probabilities and out of the three sigma range entirely it could be considered anomalous and perhaps useful for trade planning, use the fib extensions in various ways to have dynamic profit targets, support or resistance.
How is this different
This indicator differs from others in that I've not really seen any others generating solely horizontal levels, anchored from open price and including fib extensions.
How to use
To use this indicator add to the chart, select anchor timeframe, fib display mode and adjust style to liking. Depending on trade plans use the range breaks, consolidations or fib extensions as required.
One could utilize range consolidation for advanced options neutral trades, range breaks for scalping directionally or high fib extensions for rejection based trades. Based on timeframe anchorage there could be some really amazing combinations for any style of trading, comment any unique findings!
What markets
This indicator can be used on anything that has a price :D
Conditions
Any condition is applicable.

Outliers Detector with N-Sigma Confidence Intervals (TG fork)Display outliers in either value change, volume or volume change that significantly deviate from the past.
This uses the standard deviation calculation and the n-sigmas statistical rule of significance, with 2-sigma (a value of 2) signifying that the observed value is stronger than 95% of past values, and 3-sigma 98.5% of past values, and so on for higher sigma values.
Outliers in price action or in volume can indicate a strong support for the move, and hence potentially more moves in the same direction in the future. Inversely, an insignificant move is less likely to be supported. And of course the stronger, the more support.
This indicator also doubles as a standard volume indicator if volume is selected as the source, but with the option of highlighting outliers.
Bars below significance can be uncolored (gray) to unclutter the visuals.
Differently to almost all other similar indicators, the background highlighting is dynamical, so that all values will be highlighted differently, not just 2-sigma or 3-sigma, but also 4-sigma, 5-sigma, etc, with a different value of transparency.
The dynamical transparency value can be calculated in two ways: either statically proportionally to the n-sigma but capped at 10-sigma, or either as a ratio relative to the highest observed sigma value over the defined lookback period (default: 300).
If you like this indicator, which is an extension of previously published indicators, please give some love to the original authors:
* tvjvzl :
* vnhilton :
This extension, authored by Tartigradia, extends tvjvzl's indi, implements vnhilton's idea of highlighting the background, and go further by adding dynamical background highlighting for any value of sigma, add support for volume and volume change (VolumeDiff) as inputs, add option to uncolor insignificant bars, allow plotting in both directions and more.

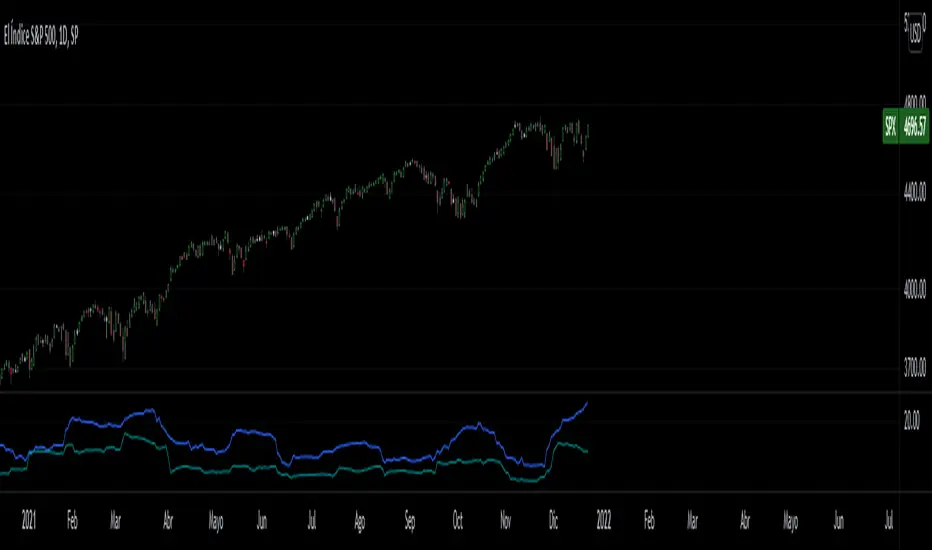
Historical Volatility Close to Close VS High to LowClose to Close Volatility VS high to low, to evaluate volatility regimes.
Both are Volatilities of 40 periods (Modifiable), calculated on 252 days (Average trading days in the American market) (Also modifiable in the case of cryptocurrency analysis).
The Moving Average is a 20 periods (Modifiable) Simple Moving Average of the average of both volatilities.
Blue = Close to Close Volatility
Green = High to Low Volatility
Orange = Moving Average
Volatilidad Close to Close VS High to Low, para evaluar regimenes de volatilidad historica.
Ambas son Volatilidades de 40 periodos (Modificable), calculadas sobre 252 dias (Promedio de dias operables en el mercado americano)(Tambien modificable para el caso de analisis de criptomonedas).
La Media movil, es una media movil Simple de 20 periodos del promedio de ambas volatilidades.
Azul = Volatilidad Close to Close
Verde = Volatilidad High to low
Naranja = Media Movil
Aqua Flow ChartAqua Flow Chart by Angel Algo
Aqua flow chart (AFC) is a new chart type that not only displays price in an efficient way but also performs statistical analysis of price moves. It filters out noise and shows buy and sell signals.
Signals generated by AFC often are leading ones. This means they allow to forecast future movement of the price before it begins.
How does it work?
AFC does not show open and close for each bar, it only shows the price range of the bar i.e. its diapason between the high and the low. The reason is, that most types of orders including SL and TP are being executed on price touch. So, in terms of triggering orders the price range of the bar is the only thing that matters.
For each bar AFC measures the price move within this bar (current close minus previous close) and compares it to the mean price movement within one bar for this time frame. If it is significantly higher than the mean movement and exceeds it by a certain number of standard deviations specified in the Threshold parameter, then the range of this bar is being colored as red or green, depending on the direction of the price movement in this bar. If the movement of the price is less than the threshold value the bar’s range is colored in blue.
Financial analysts call bars in which the price movement is higher than the mean price movement for this time frame by N standard deviations N-sigma moves. You can see 1-2-sigma moves quite often. More than 5-sigma moves are extremely rare and correspond to market shocks caused by some unexpected news and events.
In terms of this financial jargon you can think of Threshold parameter of AFC as of number of sigma that a price move of a bar should exceed for this bar to be colored in green or red.
Higher sigma moves in most cases carry some information cause they statistically can not be described by a some sort of market noise. There are evidences that if a high sigma move occurs it may be a leading predictor for the future trend.
If you set Threshold parameter to be equal or more than 1.5 then you can consider the red and green colored bars to be buy and sell signals. The greater value you set for the Threshold parameter the stronger will these signals be, but at the same time they will occur more rarely.
The default value for the Threshold parameter is 1.5 which works good for many markets. You can adjust the value of this parameter to find the optimal sensitivity for the signals. You can set the values from the range 1-7. The less the value is the more colored bars you get, but the less strong are the signals given by these bars.
Please drop a comment if you have any questions and a like if you find this useful!

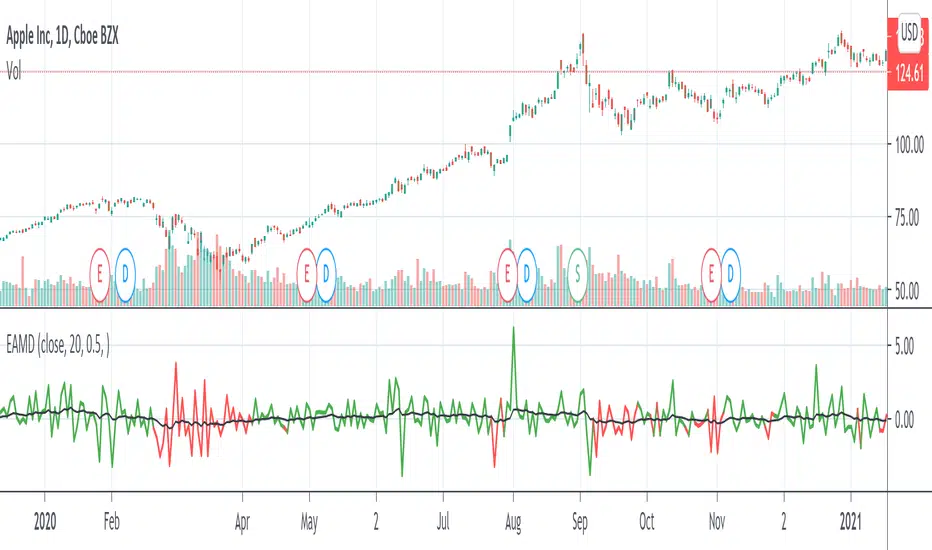
Outlier Detector with N-Sigma Confidence IntervalsA detrended series that oscilates around zero is obtained after first differencing a time series (i.e. subtracting the closing price for a candle from the one immediately before, for example). Hypothetically, assuming that every detrended closing price is independent of each other (what might not be true!), these values will follow a normal distribution with mean zero and unknown variance sigma squared (assuming equal variance, what is also probably not true as volatility changes over time for different pairs). After studentizing, they follow a Student's t-distribution, but as the sample size increases (back periods > 30, at least), they follow a standard normal distribution.
This script was developed for personal use and the idea is spotting candles that are at least 99% bigger than average (using N = 3) as they will cross the upper and lower confidence interval limits. N = 2 would roughly provide a 95% confidence interval.

Sigma Spikes [CC]Sigma Spikes were created by Adam Grimes and this is one of the best volatility indicators out there. This indicator not only gives you positive or negative volatility but with my version I can identify any sudden changes from the underlying trend. Buy when the line turns green and sell when it turns red.
Let me know if there were any other indicators you wanted to see me publish!
Enhanced Sigma by Cryptorhythms [CR] - AdvancedEnhanced Sigma - Advanced Volatility-Normalized Returns Analysis
The Enhanced Sigma indicator measures volatility-adjusted price returns to identify statistical extremes, regime changes, and mean reversion opportunities. By normalizing returns against their standard deviation, the indicator reveals when markets are experiencing unusual moves relative to recent volatility—highlighting potential exhaustion points, capitulation events, and statistical anomalies.
█ OVERVIEW
Sigma (σ) represents how many standard deviations current returns deviate from normal behavior. Readings beyond ±2.0 indicate statistically unusual moves, while extreme readings beyond ±3.0 occur less than 1% of the time under normal distribution. This version adds multi-layered analysis including regime detection, multi-timeframe confirmation, and adaptive thresholds.
█ KEY FEATURES
Return Calculation Methods
The indicator supports multiple return calculation approaches:
- Simple Returns — Standard percentage change calculation
- Log Returns — Logarithmic returns for better statistical properties
- Geometric Returns — Square root based calculation
- Percentage Returns — Scaled percentage format
Volume Weighting
Optional volume weighting emphasizes high-volume moves while dampening low-volume noise. When enabled, returns are weighted by normalized volume to give more significance to moves occurring on institutional participation.
Threshold Methods
Two threshold calculation approaches:
- Fixed Thresholds — Manual static levels
- Percentile-Based — Adaptive thresholds calculated from historical distribution
Percentile-based thresholds automatically adjust to changing volatility regimes over configurable lookback periods.
Statistical Significance Testing
Built-in t-test functionality determines whether current sigma readings are statistically significant or merely random noise. Configurable confidence levels (80-99.9%) filter out insignificant moves. Non-significant readings are visually dimmed.
Multi-Timeframe Analysis
Analyzes sigma across multiple timeframes simultaneously. Confluence signals trigger when all timeframes (current, 3x, 5x) align at extremes—indicating stronger conviction and reduced false signals. MTF sigma values are plotted as reference lines.
Regime Detection
Automatically classifies current volatility environment into four regimes:
- Low Volatility — Market in compression
- Normal — Standard volatility conditions
- High Volatility — Elevated movement
- Extreme — Unusual volatility expansion
Regime classification uses percentile ranking and statistical deviation analysis.
Adaptive Threshold System
Three methods for automatic threshold adjustment:
- ATR-Based — Adjusts based on Average True Range ratio
- Volatility Regime — Tightens in low volatility, widens in high volatility
- Range Expansion — Responds to recent sigma range changes
When enabled, thresholds dynamically scale with market conditions to maintain consistent sensitivity.
Cluster Analysis
Detects and scores clusters of threshold breaches within rolling windows. High cluster scores can indicate capitulation or exhaustion phases. Visual labels "C" show active clusters.
Mean Reversion Signals
Generates entry and exit signals based on extreme sigma readings returning to mean:
- Long Entry — Triggered on oversold extremes
- Short Entry — Triggered on overbought extremes
- Exit Signals — When sigma normalizes or time-based exit reached (marked as gray "X")
Optional statistical significance filter ensures only high-probability setups generate signals. Position tracking displays unrealized P&L.
Distribution Histogram
Displays sigma value distribution as a horizontal histogram showing Point of Control (POC)—the most frequently occurring sigma level. Configurable bin size and lookback period.
Statistics Dashboard
Real-time table displaying:
- Current sigma value and percentile rank
- Statistical measures (mean, std dev, skewness, kurtosis)
- Volatility regime classification
- Extreme event frequency
- Bars since last extreme
- Position status and P&L (when mean reversion enabled)
█ VISUAL ELEMENTS
Threshold Lines
- Aqua/Cyan lines — Positive (high) thresholds
- Fuchsia/Magenta lines — Negative (low) thresholds
- Solid lines — Short-term dynamic thresholds
- Circles — Long-term dynamic thresholds
- Crosses — Percentile-based static thresholds (when enabled)
Sigma Histogram
Primary histogram uses momentum-based coloring:
- Purple shades — Negative sigma (declining)
- Cyan shades — Positive sigma (advancing)
- Darker shades indicate weakening momentum
- Brighter shades indicate strengthening momentum
Statistically significant threshold breaches are highlighted with intensified colors.
Shape Markers
- Small triangles — Statistically significant threshold breaches
- Diamonds — Multi-timeframe confluence signals
- Large triangles with text — Mean reversion entry signals (LONG/SHORT)
- X markers — Mean reversion exit signals
- Labels — Cluster detection alerts
█ ALERTS
The indicator includes comprehensive alert conditions. Use confirm on bar close if repainting is enabled.
█ HOW TO USE
Identifying Extremes
Sigma readings beyond ±2.0 indicate unusual moves. Look for:
- Threshold breaches with statistical significance markers (triangles)
- Multi-timeframe confluence (diamonds) for stronger signals
- Cluster formation indicating potential exhaustion
Regime-Aware Trading
Use regime detection to adjust expectations:
- In Low Volatility regimes, smaller sigma moves may be significant
- In Extreme regimes, higher thresholds prevent overtrading
Mean Reversion Strategy
Enable mean reversion signals for systematic entries:
- LONG signals appear after statistically significant oversold extremes
- SHORT signals appear after statistically significant overbought extremes
- Exit signals trigger on return to mean or time-based stops
Distribution Analysis
Use the histogram to identify:
- POC level — Where sigma spends most time (equilibrium)
- Current position relative to distribution

Indices Sector SigmaSpikes█ OVERVIEW
“The benchmark Dow Jones Industrial Average is off nearly 300 points as of midday today...”
“So what? Is that a lot or a little? Should we care?”
-Adam H Grimes-
This screener aims to provide Bird-Eye view across sector indices, to find which sector is having significant or 'out-of-norm' move in either direction.
The significance of the move is measured based on Sigma Spikes, a method proposed by Adam H. Grimes, where Standard Deviation of returns used as a baseline.
*You can google his blog or read his book, got some gold in there, especially on how he use indicators for trading
█ Understanding Sigma Spikes
As described by Grimes, moves in markets are only meaningful when we consider what “normal” is for that market.
Without that baseline, the daily change number, and even the percent change on the day doesn’t really mean much.
To overcome that problem, Sigma Spikes, as a measure of volatility, attempt to put todays change in price (aka return) in context of the standard deviation of 20 days daily's return.
Refer chart below:
1. The blue bars refer to each days return
2. The orange line is 1 time standard deviation of past 20days daily's return (today not included)
3. The red line is 2 time standard deviation of past 20days daily's return (today not included)
Using the ratio of today's return over the Std Deviation, determining your threshold (1,2,3,etc) will be the key that tells if today's move is significant or not.
*Threshold referring to times standard deviation, and different market may require different threshold.
*20 Days period are based on the Lookback Period, adjustable from user input window.
█ Features
- Scan up to 13 symbols at a time (Bursa (MYX) indices are defaulted, but you may change to any symbols/index from the user input setting)
█ Limitation
- Due to multiple use of security() function required to call other symbols, expect the screener to be slow at certain times
- Custom Timeframe currently accept only Daily and Weekly. I'll try to include lower timeframe in the next update
█ Disclaimer
Past performance is not an indicator of future results.
My opinions and research are my own and do not constitute financial advice in any way whatsoever.
Nothing published by me constitutes an investment recommendation, nor should any data or Content published by me be relied upon for any investment/trading activities.
I strongly recommends that you perform your own independent research and/or speak with a qualified investment professional before making any financial decisions.
Any ideas to further improve this indicator are welcome :)

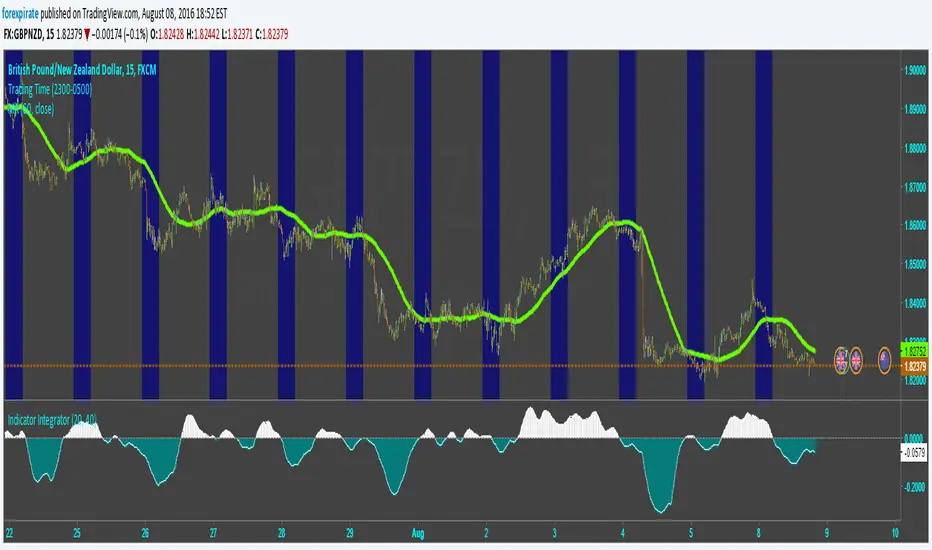
Indicator IntegratorHere is a light piece of code, The Indicator Integrator. It sums up a function (like an integral for you calculus folks). Unlike the 'cum' function that does a million bars of look back you can change the look back period, like limits of integration.
Built in is a difference of the close from an SMA. And there is an ROC. By changing what is summed up in the loop you can sum up the differences from the SMA or sum up the ROC. Pick your SMA length/ROC length. Then pick your look back period of how much to add up (bars to add up). There is a built in SMA smoother of three bars on the final summation.
Comments welcomed
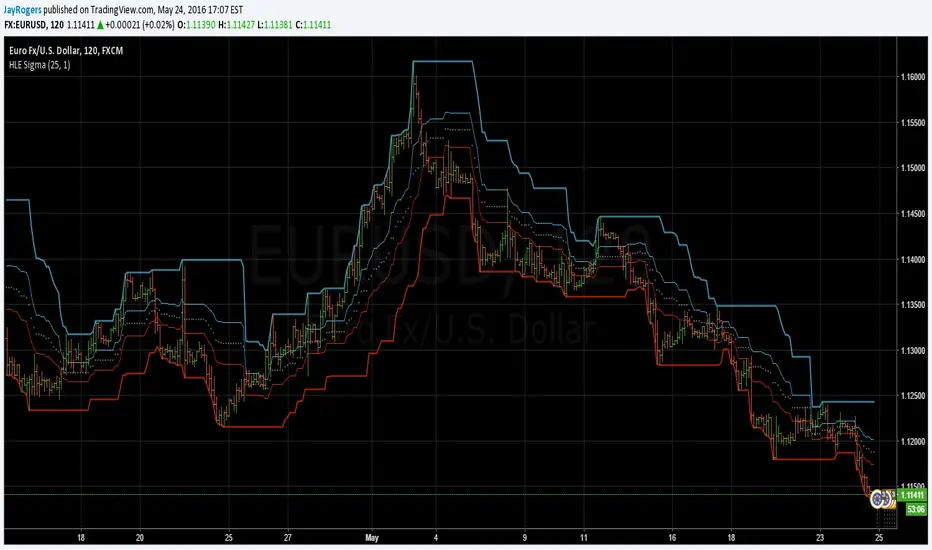
High Low Envelope SigmaDescription:
High and Low Envelope channel with median line and 'sigma' offsets to try and encapsulate price flow and quickly locate likely areas of support and resistance on the fly.