Sentiment
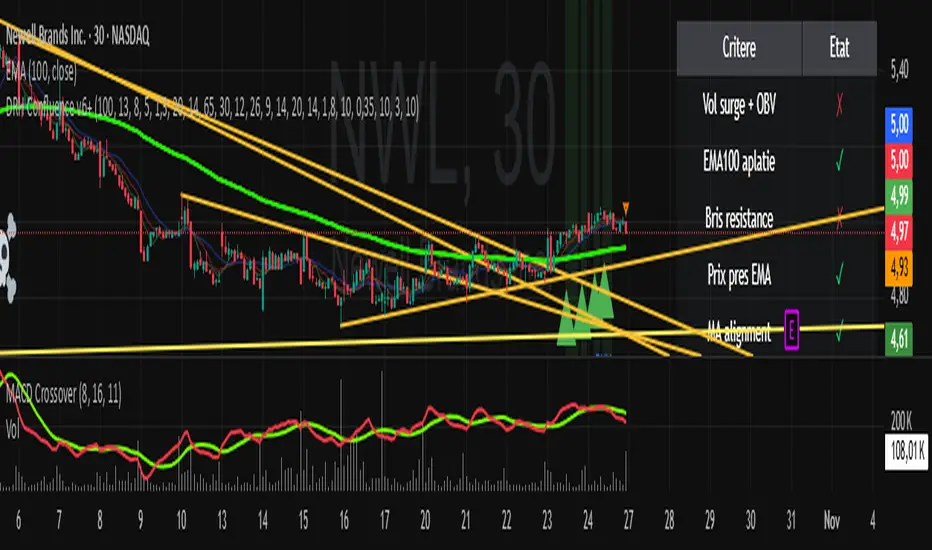
SC_Reversal Confirmation 30 minutes by Claude (Version 1)📉 When to Use
Use this setup when the stock is in a downtrend and a bullish reversal is anticipated.
🔍 Recommended Usage This model is designed for pullback phases, where the asset is declining and a reversal is expected. It helps filter out weak signals and waits for technical confirmation before triggering an entry.
✅ Entry Signal Green triangles appear only when all reversal conditions are fully met. Entry may occur slightly after the bottom, but with a reduced likelihood of false signals.
📊 Suggested Settings Apply on a 30-minute chart using a 100-period Exponential Moving Average (EMA) based on close. Recommended for Cobalt Chart 0.
--------------------------------------------------------------------------------------
Dow Jones Trading System with PivotsThis TradingView indicator, tailored for the 30-minute Dow Jones (^DJI) chart, supports DIA options trading with a trend-following approach. It features a 30-period SMA (blue) and a 60-period SMA (red), with an optional 90-period SMA (orange) drawn from rauItrades' Dow SMA outfit. A bullish crossover (30 SMA > 60 SMA) displays a green "BUY" triangle below the bar for potential DIA longs, while a bearish crossunder (30 SMA < 60 SMA) shows a red "SELL" triangle above for shorts or exits. The background turns green (bullish) or red (bearish) to indicate trend bias. Pivot points highlight recent highs (orange circles) and lows (purple circles) for support/resistance, using a 5-bar lookback. Alerts notify for crossovers.

NASDAQ Trading System with PivotsThis TradingView indicator, designed for the 30-minute NASDAQ (^IXIC) chart, guides QQQ options trading using a trend-following strategy. It plots a 20-period SMA (blue) and a 100-period SMA (red), with an optional 250-period SMA (orange) inspired by rauItrades' NASDAQ SMA outfit. A bullish crossover (20 SMA > 100 SMA) triggers a green "BUY" triangle below the bar, signaling a potential long position in QQQ, while a bearish crossunder (20 SMA < 100 SMA) shows a red "SELL" triangle above, indicating a short or exit. The background colors green (bullish) or red (bearish) for trend bias. Orange circles (recent highs) and purple circles (recent lows) mark support/resistance levels using 5-bar pivot points.
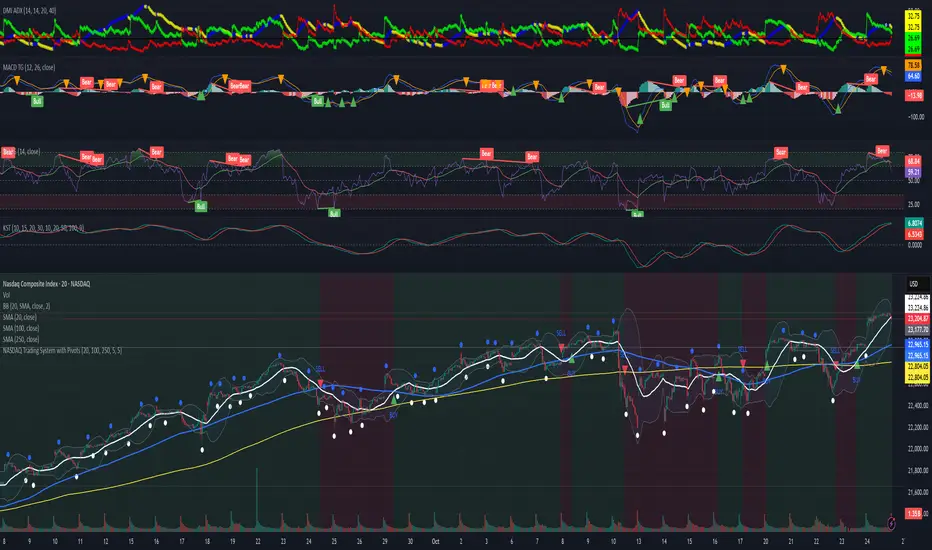
S&P Trading System with PivotsThe S&P Trading System with Pivots is a TradingView indicator designed for the 30-minute SPX chart to guide SPY options trading. It uses a trend-following strategy with:
10 SMA and 50 SMA: Plots a 10-period (blue) and 50-period (red) Simple Moving Average. A bullish crossover (10 SMA > 50 SMA) signals a potential buy (green triangle below bar), while a bearish crossunder (10 SMA < 50 SMA) signals a sell or exit (red triangle above bar).
Trend Bias: Colors the background green (bullish) or red (bearish) based on SMA positions.
Pivot Points: Marks recent highs (orange circles) and lows (purple circles) as potential resistance and support levels, using a 5-bar lookback period.

Broad Market for Crypto + index# Broad Market Indicator for Crypto
## Overview
The Broad Market Indicator for Crypto helps traders assess the strength and divergence of individual cryptocurrency assets relative to the overall market. By comparing price deviations across multiple assets, this indicator reveals whether a specific coin is moving in sync with or diverging from the broader crypto market trend.
## How It Works
This indicator calculates percentage deviations from simple moving averages (SMA) for both individual assets and an equal-weighted market index. The core methodology:
1. **Deviation Calculation**: For each asset, the indicator measures how far the current price has moved from its SMA over a specified lookback period (default: 24 hours). The deviation is expressed as a percentage: `(Current Price - SMA) / SMA × 100`
2. **Market Index Construction**: An equal-weighted index is built from selected cryptocurrencies (up to 15 assets). The default composition includes major crypto assets: BTC, ETH, BNB, SOL, XRP, ADA, AVAX, LINK, DOGE, and TRX.
3. **Comparative Analysis**: The indicator displays both the current instrument's deviation and the market index deviation on the same panel, making it easy to spot relative strength or weakness.
## Key Features
- **Customizable Asset Selection**: Choose up to 15 different cryptocurrencies to include in your market index
- **Flexible Configuration**: Toggle individual assets on/off for display and index calculation
- **Current Instrument Tracking**: Automatically plots the deviation of whatever chart you're viewing
- **Visual Clarity**: Color-coded lines for easy differentiation between assets, with the market index shown as a filled area
- **Adjustable Lookback Period**: Modify the SMA period to match your trading timeframe
## How to Use
### Identifying Market Divergences
- When the current instrument deviates significantly above the index, it shows relative strength
- When it deviates below, it indicates relative weakness
- Assets clustering around zero suggest neutral market conditions
### Trend Confirmation
- If both the index and your asset are rising together (positive deviation), it confirms a broad market uptrend
- Divergence between asset and index can signal unique fundamental factors or early trend changes
### Entry/Exit Signals
- Extreme deviations from the index may indicate overbought/oversold conditions relative to the market
- Convergence back toward the index line can signal mean reversion opportunities
## Settings
- **Lookback Period**: Adjust the SMA calculation period (default: 24 hours)
- **Asset Configuration**: Select which cryptocurrencies to monitor and include in the index
- **Display Options**: Show/hide individual assets, current instrument, and market index
- **Color Customization**: Personalize colors for better visual analysis
## Best Practices
- Use on higher timeframes (4H, Daily) for more reliable signals
- Combine with volume analysis for confirmation
- Consider fundamental news when assets show extreme divergence
- Adjust the asset basket to match your trading focus (DeFi, L1s, memecoins, etc.)
## Technical Notes
- The indicator uses `request.security()` to fetch data from multiple symbols
- Deviations are calculated independently for each asset
- The zero line represents perfect alignment with the moving average
- Index calculation automatically adjusts based on active assets
## Default Assets
1. BTC (Bitcoin) - BINANCE:BTCUSDT
2. ETH (Ethereum) - BINANCE:ETHUSDT
3. BNB (Binance Coin) - BINANCE:BNBUSDT
4. SOL (Solana) - BINANCE:SOLUSDT
5. XRP (Ripple) - BINANCE:XRPUSDT
6. ADA (Cardano) - BINANCE:ADAUSDT
7. AVAX (Avalanche) - BINANCE:AVAXUSDT
8. LINK (Chainlink) - BINANCE:LINKUSDT
9. DOGE (Dogecoin) - BINANCE:DOGEUSDT
10. TRX (Tron) - BINANCE:TRXUSDT
Additional slots (11-15) are available for custom asset selection.
---
This indicator is particularly useful for cryptocurrency traders seeking to understand market breadth and identify opportunities where specific assets are diverging from overall market sentiment.

Leveraged ETF Volume Ratio3x/2x Long/short etf pairs for popular tickers, including TSLA, QQQ, META, PLTR... Extreme values indicate bullish/bearish sentiment.

10Y–2Y Treasury Yield Curve Spread & MES % Change📝 Description:
This indicator tracks the U.S. 10-Year minus 2-Year Treasury yield spread — a powerful macroeconomic signal often used by professional traders to gauge market sentiment and recession risk — and overlays an optional MES % change line to help intraday futures traders spot macro–price divergences in real time.
Features:
🏦 Plots the 10Y–2Y spread, with optional EMA smoothing.
📉 Highlights yield curve inversion (background turns red when spread < 0).
📊 Optional MES % change line from daily or RTH open for directional bias.
🔔 Alert conditions for:
Yield curve inversion / un-inversion.
Sudden spread spikes in basis points (customizable).
🧮 Optional correlation plot to visualize relationship strength between MES and the yield curve.
🧭 Z-score normalization allows both series to be viewed in one pane without scaling issues.
Why it matters:
A falling or inverted 2s10s spread often signals risk-off behavior and pressure on equities.
A steepening curve tends to support risk-on rallies.
Divergences between MES price action and the spread can provide early warning signals of reversals or fakeouts.
Best used with:
MES (MES1!) or MYM charts for intraday & swing bias.
Fed event days, CPI/NFP, or any macro-sensitive sessions.
VWAP or structure-based intraday trading strategies.
⚠️ Note: This indicator is for informational purposes only and does not constitute financial advice. Always combine macro context with your own trade plan and risk management.

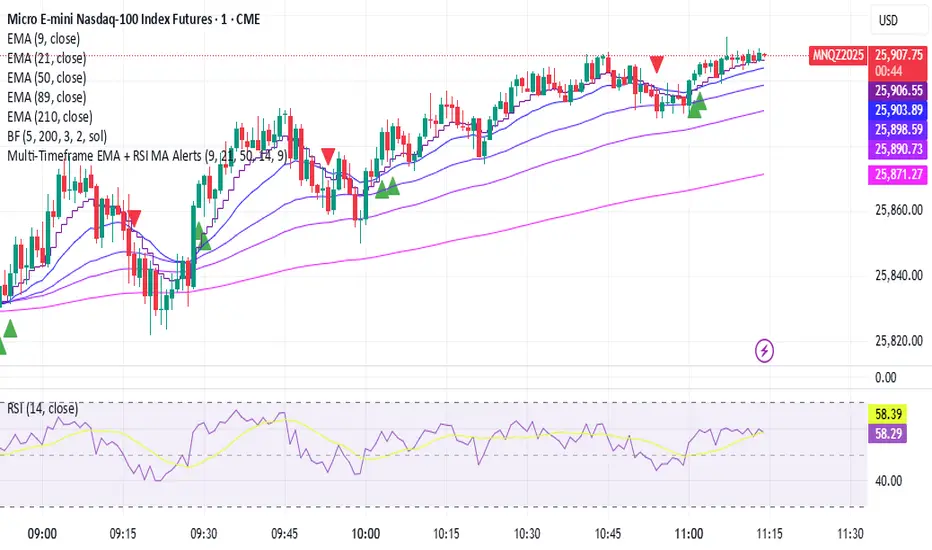
Pullback Finder AutoPullback Finder Auto — Intraday Momentum Cooling Detector
Pullback Finder Auto is designed to find stocks that have made a strong intraday run from the open and are now cooling off while still positive — the classic pullback zone where continuation entries often form.
It automatically measures the percentage change from today’s open and highlights bars where:
the stock has already run at least a chosen amount (for example +10 % above its open), and
the current price is still up but within a defined pullback range (for example between +3 % and +8 % above the open).
When those two conditions are met, you’ll see green graphics on your chart:
Green triangle markers under the candle.
Optionally, small green PB labels such as “PB 5.2 %” showing the exact percentage from open when the setup occurs.
A green highlight in the sub‑window or line plot if you left the “Change from Open %” plot active.
These are your visual cues that a pullback has formed — a stock that previously ran and is now pulling back while holding strength.
How it works
The script continuously monitors:
• High % from Open = (high − open) / open × 100
• Current % from Open = (close − open) / open × 100
A “Pullback” condition triggers only if:
the high % is greater than or equal to your minimum run threshold, and
the current % sits between your minimum and maximum pullback percentages.
When both are true, the indicator plots the green triangle and optional label.
Default parameters
Min Run % = 10
Min Current % = 3
Max Current % = 8
Session Start = 09:30 – 16:00 US Eastern
All can be changed to fit different volatility levels.
Lower values catch smaller moves; higher values restrict signals to explosive runners.
Using it in real time
During live trading, Pullback Finder Auto updates with each candle.
When a bar first enters the target zone, a green triangle and PB label will appear immediately under that candle.
These are dynamic: if price moves out of the valid zone on the same bar, the marker may disappear.
You can create an alert on “Pullback Finder Auto – Pullback Candidate” to be notified whenever new triangles appear across your active symbols.
This works on any timeframe:
use shorter timeframes such as 1‑minute or 5‑minute charts for fast, intraday detection,
use longer timeframes for a broader view of the day’s market structure.
Using it on past data (scanning backwards)
When you scroll back through history, past green triangles remain visible at every bar where the condition was true at that time.
The PB labels next to those candles show exactly how far above the open the stock was trading during the historical setup.
Use this for visual back‑testing: study how price reacted after these pullback points, adjust the thresholds, and refine your criteria for different markets.
The grey or teal line under the chart (if enabled) shows the percent‑from‑open curve so you can see the full run‑and‑cool pattern leading into each triangle signal.
If you convert the indicator into a strategy, the same condition becomes historical entry points you can test with the Strategy Tester.
Summary
1. Pullback Finder Auto paints green triangles and PB labels whenever an intraday pullback fits your criteria.
2. It runs dynamically in real‑time and also preserves markers for historical review.
3. Adjust the thresholds to match volatility or timeframe.
4. Ideal for visual scanning, watchlist alerts, or integration into a lightweight screening strategy.

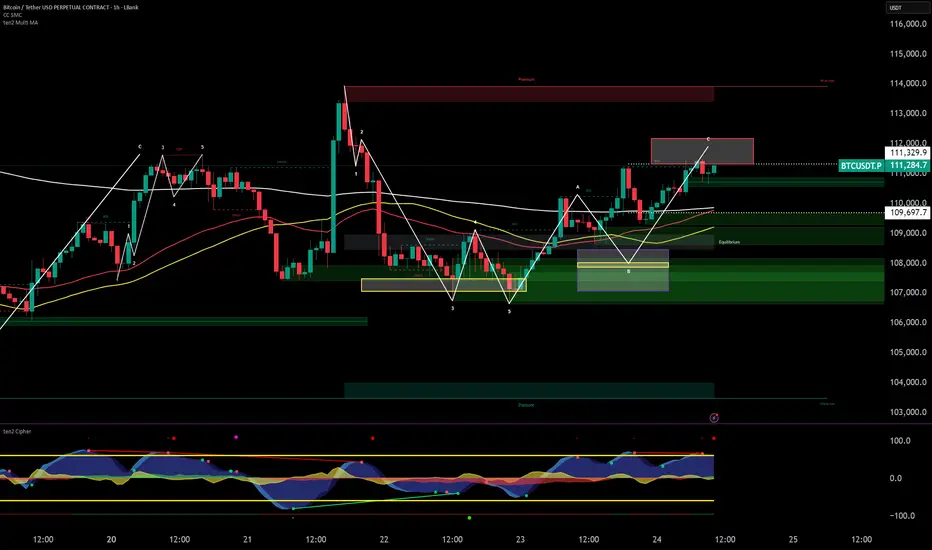
ten2 Multi MAThis powerful all-in-one indicator allows you to display three Exponential Moving Averages (EMAs) and three Simple Moving Averages (SMAs) on your chart from a single script. Save indicator slots and get a comprehensive view of market trends across different timeframes. Every moving average is fully customizable in length, colour, and source, giving you complete control over your technical analysis setup.
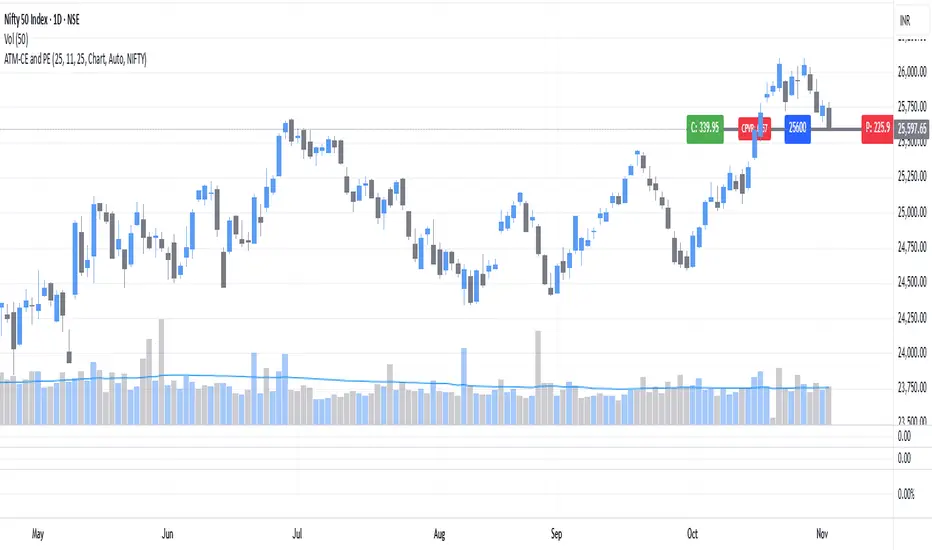
ATM Strike Line with Call & Put Premiums (ARJO)This indicator is designed specifically for the Indian market (NSE) and helps traders visualize the At-The-Money (ATM) strike line along with real-time Call (CE) and Put (PE) option premiums.
Key Features
Automatic ATM Detection: The script automatically identifies the ATM strike based on the underlying price, with an option for manual input.
Dynamic Expiry Control: Select expiry date easily (Year, Month, Day) in YYMMDD format.
Flexible Timeframe Support: Choose between the chart’s current timeframe or custom intervals.
Smart Symbol & Strike Interval: Automatically adapts to the selected underlying symbol (e.g., NIFTY, BANKNIFTY, RELIANCE, etc.) or allows manual setup.
Visual Representation:
ATM line plotted clearly on the chart.
CE and PE premium labels are displayed on each side of the ATM line.
ATM strike price label shown at the center.
Call–Put Volume Ratio (CPVR): Displays the live CPVR value to quickly assess market sentiment.
CPVR Interpretation
Bullish Bias: CPVR ≥ 1.25
Bearish Bias: CPVR ≤ 0.75
Neutral Zone: Between 0.75 and 1.25
⚙️ Customization
Adjustable colors for ATM line, CE/PE labels, and CPVR.
Option to manually select strike, symbol, and interval for maximum flexibility.
This tool may help to track option sentiment directly on the price chart, making it ideal for option traders and intraday analysts focusing on NIFTY, BANKNIFTY, and other NSE stocks.
Happy Trading. ARJO
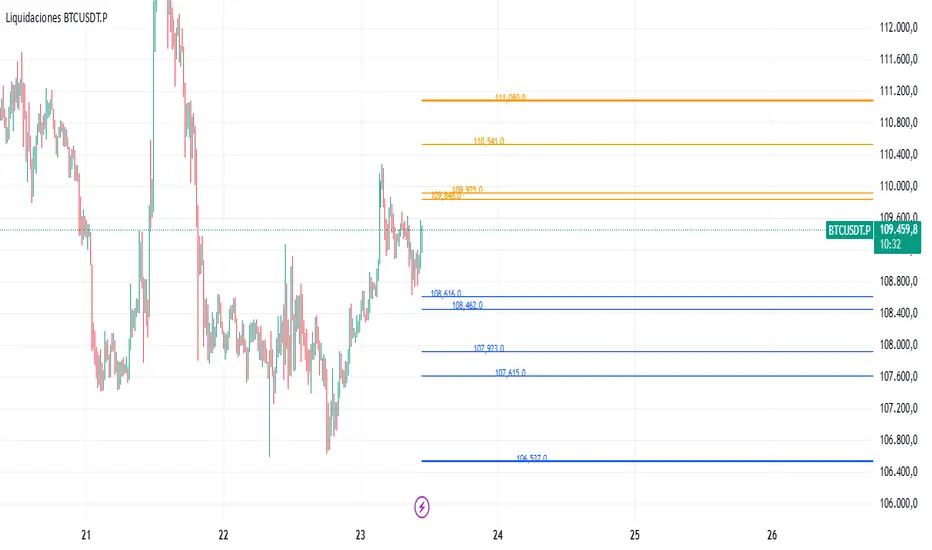
Liquidaciones BTCUSDT.PAllows you to manually record liquidation prices for both short and long positions, which are then displayed on the chart:
Orange: Short liquidations
Blue: Long liquidations
Optionally, a specific liquidation price can be highlighted to indicate higher-volume liquidations
Note: All liquidation prices must be entered manually.
WorldCup Dashboard + Institutional Sessions© 2025 NewMeta™ — Educational use only.
# Full, Premium Description
## WorldCup Dashboard + Institutional Sessions
**A trade-ready, intraday framework that combines market structure, real flow, and institutional timing.**
This toolkit fuses **Institutional Sessions** with a **price–volume decision engine** so you can see *who is active*, *where value sits*, and *whether the drive is real*. You get: **CVD/Delta**, volume-weighted **Momentum**, **Aggression** spikes, **FVG (MTF)** with nearest side, **Daily Volume Profile (VAH/POC/VAL)**, **ATR regime**, a **24h position gauge**, classic **candle patterns**, IBH/IBL + **first-hour “true close”** lines, and a **10-vote confluence scoreboard**—all in one view.
---
## What’s inside (and how to trade it)
### 🌍 Institutional Sessions (Sydney • Tokyo • London • New York)
* Session boxes + a highlighted **first hour**.
* Plots the **true close** (first-hour close) as a running line with a label.
**Use:** Many desks anchor risk to this print. Above = bullish bias; below = bearish. **IBH/IBL** breaks during London/NY carry the most signal.
### 📊 CVD / Delta (Flow)
* Net buyer vs seller pressure with smooth trend state.
**Use:** **Rising CVD + acceptance above mid/POC** confirms continuation. Bearish price + rising CVD = caution (possible absorption).
### ⚡ Volume-Weighted Momentum
* Momentum adjusted by participation quality (volume).
**Use:** Momentum>MA and >0 → trend drive is “real”; <0 and falling → distribution risk.
### 🔥 Aggression Detector
* ROC × normalized volume × wick factor to flag **forceful** candles.
**Use:** On spikes, avoid fading blindly—wait for pullbacks into **aligned FVG** or for aggression to cool.
### 🟦🟪 Fair Value Gaps (with MTF)
* Detects up to 3 recent FVGs and marks the **nearest** side to price.
**Use:** Trend pullbacks into **bullish FVG** for longs; bounces into **bearish FVG** for shorts. Optional threshold to filter weak gaps.
### 🧭 24h Gauge (positioning)
* Shows current price across the 24h low⇢high with a mid reference.
**Use:** Above mid and pushing upper third = momentum continuation setups; below mid = sell the rips bias.
### 🧱 Daily Volume Profile (manual per day)
* **VAH / POC / VAL** derived from discretized rows.
**Use:** **POC below** supports longs; **POC above** caps rallies. Fade VAH/VAL in ranges; treat them as break/hold levels in trends.
### 📈 ATR Regime
* **ATR vs ATR-avg** with direction and regime flag (**HIGH / NORMAL / LOW**).
**Use:** HIGH ⇒ give trades room & favor trend following. LOW ⇒ fade edges, scale targets.
### 🕯️ Candle Patterns (contextual, not standalone)
* Engulfings, Morning/Evening Star, 3 Soldiers/Crows, Harami, Hammer/Shooting Star, Double Top/Bottom.
**Use:** Only with session + flow + momentum alignment.
### 🤝 Price–Volume Classification
* Labels each bar as **continuation**, **exhaustion**, **distribution**, or **healthy pullback**.
**Use:** Align continuation reads with trend; treat “Price↑ + Vol↓” as a caution flag.
### 🧪 Confluence Scoreboard & B/S Meter
* Ten elements vote: 🔵 bull, ⚪ neutral, 🟣 bear.
**Use:** Execution filter—take setups when the board’s skew matches your trade direction.
---
## Playbooks (actionable)
**Trend Pullback (Long)**
1. London/NY active, Momentum↑, CVD↑, price above 24h mid & POC.
2. Pullback into **nearest bullish FVG**.
3. Invalidate under FVG low or **true-close** line.
4. Targets: IBH → VAH → 24h high.
**Range Fade (Short)**
1. Asia/quiet regime, **Price↑ + Vol↓** into **VAH**, ATR low.
2. Nearest FVG bearish or scoreboard skew bearish.
3. Invalidate above VAH/IBH.
4. Targets: POC → VAL.
**News/Impulse**
Aggression spike? Don’t chase. Let it pull back into the aligned FVG; require CVD/Momentum agreement before entry.
---
## Alerts (included)
* **Bull/Bear Confluence ≥ 7/10**
* **Intraday Target Achieved** / **Daily Target Achieved**
* **Session True-Close Retests** (Sydney/Tokyo/London/NY)
*(Keep alerts “Once per bar” unless you specifically want intrabar triggers.)*
---
## Setup Tips
* **UTC**: Choose the reference that matches how you track sessions (default UTC+2).
* **Volume threshold**: 2.0× is a strong baseline; raise for noisy alts, lower for majors.
* **CVD smoothing**: 14–24 for scalps; 24–34 for slower markets.
* **ATR lengths**: Keep defaults unless your asset has a persistent regime shift.
---
## Why this framework?
Because **timing (sessions)**, **truth (flow)**, and **location (value/FVG)** together beat any single signal. You get *who is trading*, *how strong the push is*, and *where risk lives*—on one screen—so execution is faster and cleaner.
---
**Disclaimer**: Educational use only. Not financial advice. Markets are risky—backtest and size responsibly.

Scalp BTC/ETH — Reversal & Continuation (v1, Pine v6)Scalp BTC/ETH — Reversal & Continuation (1m à 10m)
Cet indicateur détecte des opportunités de micro-scalping sur futures (BTC/ETH) basées sur deux mécaniques courtes validées par structure de prix :
A) Reversal de pression (contre-mouvement contrôlé)
Détection d’une sur-extension brutale suivie d’une absorption sur la bougie suivante.
Objectif : capturer la première respiration après un excès de prix (rejet court).
B) Continuation courte (momentum + reprise)
Détection de 3 bougies directionnelles consécutives suivies d’un pullback léger, puis signal sur la reprise du mouvement initial.
Gestion intégrée (scénario standard TP dynamique)
TP1 → 50% de la position à un gain fixe (% adaptable au timeframe)
Stop déplacé au Break-Even sur le restant
Sortie finale sur bougie inverse significative
(correction ≥ X% du corps précédent) ou timeout (max bars en trade)
Scalp BTC/ETH — Reversal & Continuation (1m to 10m)
This indicator detects short-term futures scalping setups on BTC & ETH using two mechanical price-action models designed for fast execution:
A) Reversal Compression (counter-move entry)
Identifies a sharp impulse (overextension) followed by absorption / failure to extend on the next candle.
Objective: capture the first corrective pullback after exhaustion.
B) Controlled Continuation (momentum follow-through)
Identifies 3 consecutive trend candles, then a shallow pullback, and triggers an entry on the resumption of the main leg.
Built-in trade logic (dynamic TP structure)
TP1 → scale out 50% of the position at a fixed percentage (auto-scaled per timeframe)
Stop moved to Break-Even after TP1
Final exit on either:
• a meaningful opposite candle (≥ X% correction of prior body), or
• a timeout (max bars in trade)
Technical characteristics
Designed for 1m / 3m / 5m / 7m / 10m
No repainting (bar-close confirmed logic)
Works for both LONG & SHORT
Built-in alert events:
ENTRY_LONG / ENTRY_SHORT / TP1 / EXIT_STOP / EXIT_INVERSE / EXIT_TIMEOUT
Suitable for manual execution, semi-automation (alerts) or full bot integration (webhook JSON)
Purpose
Provide a repeatable, rule-based, non-subjective framework to harvest micro-moves with controlled risk, without relying on lagging indicators or long-term prediction.
(A Strategy / backtesting version is planned as a next iteration.)

USD Session 8FX - LDN & NY (TF-invariant, Live + Table)What it is
A USD strength/weakness meter for the London (08:00–08:45) or New York (15:30–16:00/16:15) session. It blends the movement of 8 markets—EURUSD, GBPUSD, AUDUSD, NZDUSD, USDCHF, USDCAD, USDJPY, XAUUSD—into one Score that is timeframe-invariant (it uses a 1-minute “boundary TF” under the hood so changing chart TF doesn’t change the math).
Core logic (simple)
During the chosen session window, it records each symbol’s start and live end prices, computes returns, optionally normalizes by ATR (volatility), applies your weights, and averages anti-USD (EUR/GBP/AUD/NZD/XAU) vs USD-base (CHF/CAD/JPY) groups.
The final Score is the normalized sum of weighted contributions:
Score > 0 → “USD Strong”
Score < 0 → “USD Weak”
At the session close it freezes (“Locked”) the results so you can review them later.
What you see
Main plot: the USD Score line (with a 0 baseline).
Optional lines: Anti-USD average vs USD-base average (post-normalization, pre-weights).
Session background shading (London silver, New York aqua).
Live table with:
Each symbol’s % change, its weight, and its contribution to the Score.
TOP badges for the two biggest drivers (by absolute contribution).
A Side column (only for the two TOPs) showing BUY/SELL aligned with the USD verdict (e.g., if USD Strong → SELL anti-USD pairs like EURUSD, BUY USD-base like USDCHF).
Verdict row with USD Strong/Weak, the Score value, the window text, and whether you’re LIVE / CLOSED / FROZEN.
Trade Gate panel:
Shows Verdict (USD Strong/Weak), Bias OK/weak (|Score| vs your threshold), Top-1/Top-2 VWAP checks, an overall GATE: OK/NO, and an Entry hint string (e.g., “SELL EURUSD, BUY USDCHF”) when conditions align.
VWAP “Trade Gate”
It confirms alignment between the USD bias and price vs VWAP for the top movers:
If USD Strong: anti-USD symbols should be below VWAP (short bias), USD-base symbols above VWAP (long bias).
If USD Weak: the opposite.
Gate = OK only if |Score| ≥ minAbsScore and at least one of the two TOP symbols is on the correct side of VWAP.
Tip: set vwapTF to an intraday value (“1”, “5”, “15”) for reliable VWAP on higher-TF charts.
Alerts
At session close: “USD Strong/Weak – session close”.
Live threshold: alerts when |Score| crosses your intraday threshold up/down.
Entry hint (Gate OK): triggers when the Gate flips from NO → OK inside the window.
If you create an alert of type “Any alert() function call”, you also get a dynamic message like:
ENTRY HINT • Hint: SELL EURUSD, BUY USDCHF
Key inputs you can tweak
Session: London vs New York; NY end time 16:00 or 16:15.
Timezone: default Europe/Tirane.
Boundary TF: default “1” (keeps the indicator TF-invariant).
minAbsScore: sensitivity threshold for “Bias OK”.
ATR normalization (len): stabilizes comparisons across different volatility regimes.
VWAP settings: toggle panel and set vwapTF.
How to use (playbook)
Choose the session (e.g., New York 15:30–16:15), keep Boundary TF = 1.
If you’re on a higher-TF chart, set vwapTF = "1" or "5".
Watch Score and Verdict; when |Score| ≥ minAbsScore, bias is meaningful.
Check Top-1/Top-2 and the Trade Gate:
If Gate = OK, use the Entry hint (e.g., “SELL EURUSD, BUY USDCHF”) as the aligned idea.
Use your own execution rules (e.g., structure, risk, stops) on the suggested symbols.
After close, review the Frozen table to validate behavior and refine thresholds/weights.
Notes & edge cases
If some markets are illiquid/holiday, a few returns may be na; the script handles that gracefully.
If ta.vwap is na on high TFs, the Gate will simply not confirm—set vwapTF intraday.
You can customize weights (e.g., reduce XAUUSD to -0.3 or similar) to suit your basket philosophy.
If you want, I can add toggles to show Side for all 8 symbols, or print a one-line summary (e.g., “USD Strong • Score 0.23 • Gate OK • SELL EURUSD, BUY USDCHF”) in the top-left of the pane.

Previous TPOIndicator Summary
This Pine Script indicator, "Previous TPO," is designed to calculate and display five key price levels from the previous trading day's market activity. It uses a 30-minute TPO (Time Price Opportunity) profile, which is a method of organizing price by time to find areas of high and low activity.
The five levels it plots on the current day are:
1. Previous Value Area High (VAH)
2. Previous Value Area Low (VAL)
3. Previous Point of Control (POC)
4. Previous Initial Balance High (IBH)
5. Previous Initial Balance Low (IBL)
The script is built to be efficient, running its main calculation only once at the beginning of each new day. It also includes an automatic line management system to delete old lines, preventing the "Too many lines" error and keeping the chart clean.
How the Code Works
1. Data Collection: At the start of a new day (00:00), the script looks back at the chart's history. It uses request.security to access 30-minute bar data.
2. Collector Loop: It then loops backward, bar by bar, to find and store 48 unique 30-minute High/Low data points, which represents the full 24-hour range of the previous day.
3. TPO Profile: With this 30-minute data, it builds a TPO profile. It divides the previous day's price range into small bins (price levels) and counts how many 30-minute periods "touched" each price bin.
4. Level Calculation:
o POC: It finds the price bin with the highest TPO count (the most traded price) and sets it as the Point of Control.
o VAH/VAL: It starts at the POC and expands outward, adding the next-most-traded price bins until 70% (or the user-defined percentage) of the day's TPOs are included. The highest and lowest prices of this range are the Value Area High and Value Area Low.
o IBH/IBL: It identifies the high and low of the first hour (the first two 30-minute bars) of the previous day to set the Initial Balance High and Initial Balance Low.
5. Drawing: The script draws these five levels as horizontal lines across the current trading day, providing a constant reference.
6. Line Management: It keeps track of all lines in an array. When the total number of lines exceeds the user's limit (e.g., 50 days * 5 lines = 250), it automatically deletes the oldest lines from the chart.
Usefulness for Trading
This indicator provides a powerful framework for intraday traders by contextualizing the current day's price action against the previous day's "auction."
• Key Support/Resistance: The VAH, VAL, and POC act as significant support and resistance lev-els. Price reacting at these levels can signal mean reversion, while acceptance beyond them can signal a trend or expansion day.
• Value Area as Context: Trading inside the previous day's value area (between VAH and VAL) is often seen as "balanced" or "range-bound" trading. Trading outside of it is "unbalanced" or "trending."
• POC as a "Magnet": The POC, being the area of highest volume/time, often acts as a "magnet" or "center of gravity" for price.
• Opening Range: The Initial Balance (IB) levels show the opening range. A breakout from this range is often a key signal for the day's initial direction.
• 80% Rule: The script contains (currently commented-out) setup logic for the "80% Rule." This is a specific Market Profile strategy where:
1. The market opens inside the previous day's Value Area.
2. The Initial Balance fails to extend outside the VA (e.g., in a short setup, the IB high stays below the VAH).
3. This setup suggests an 80% probability that the price will rotate and test the other side of the Value Area (e.g., test the VAL).
Publication and restrictions
This script is published under the Mozilla Public Licence 2.0 (MPL 2.0) and is therefore suitable for publi-cation as an open source indicator on TradingView.
Timeframe limitation: The indicator is designed for intraday timeframes. Timeframes below 10 minutes do not work and lead to an error. Recommended time frame 30 minutes.
It will not work correctly on:
Time frame under 10 minutes: The data collection loop (max_bars_to_check = 3000) is not large enough to collect the bars required for a full day on a 5-minute chart or smaller.
High time frames (e.g. 1H, 4H, Daily): The script's logic is based on a chart timeframe 30-minute data that it requests. If higher time frames are selected, the script works but the zones are no longer correct or become irrelevant.

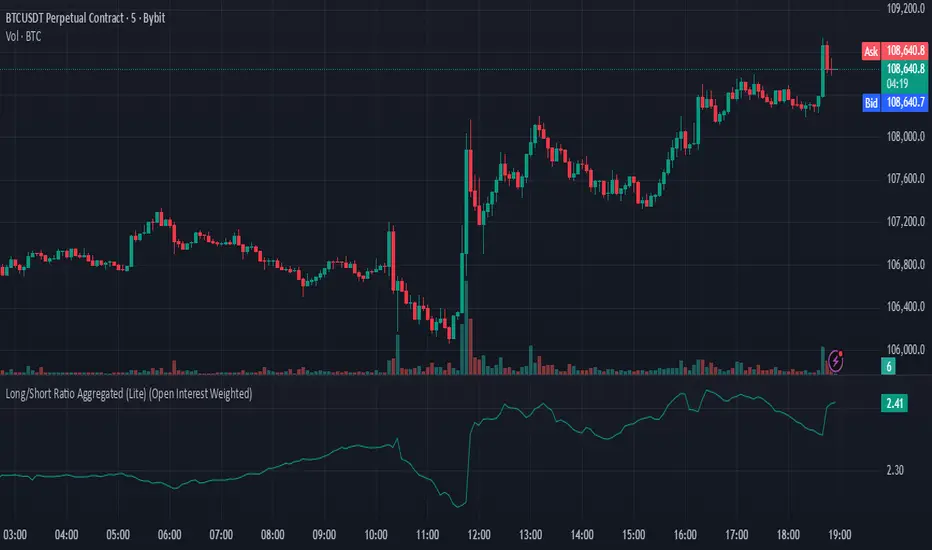
Long/Short Ratio Aggregated (Lite)Description — Long/Short Ratio Aggregated (Lite)
This indicator provides a cross-exchange, open-interest-weighted aggregation of the Long/Short Ratio (LSR) for the cryptocurrency asset currently on your chart. It is designed to unify fragmented derivatives positioning data from multiple major exchanges into a single normalized signal that more accurately reflects real market sentiment and positioning bias across platforms.
Concept and Originality
Traditional Long/Short Ratio indicators are exchange-specific. They show how many traders are long versus short, but only within the scope of one venue (e.g., Binance or Bybit). This makes them incomplete and often misleading for directional bias analysis, since different exchanges host different participant profiles, levels of leverage, and quote-currency exposures.
This script addresses that limitation by:
Aggregating LSR data across multiple exchanges (Binance and Bybit).
Weighting each ratio by Open Interest (OI) — ensuring exchanges with higher open positions contribute proportionally more to the overall sentiment.
Normalizing all contract types (USDT, USDC, and USD-margined) into a consistent base-currency format.
This step corrects for structural differences between coin- and stablecoin-margined instruments, producing a true like-for-like comparison.
The result is a globalized Long/Short Ratio, normalized by exposure and liquidity, suitable for multi-venue orderflow estimation and directional bias assessment.
Note for moderators: I know there are already other scripts out there, but they may not support Open Interest Weighting or the same number of pairs. They also might not support proper normalization like in my script.
Calculation Methodology
For each supported exchange and contract type:
The script retrieves the latest Long/Short Ratio (LSR) and Open Interest (OI) values.
OI is used as the weighting factor, creating a proportional representation of positioning volume.
Values denominated in USD are normalized into base currency using close-price adjustment.
The final value is computed as:
Weighted LSR = (Σ (LSRᵢ × OIᵢ)) / (Σ OIᵢ)
This ensures that if, for example, Binance has twice the open interest of Bybit, its LSR contributes twice as much to the total weighted sentiment.
Interpretation
Value > 1.0 → Market participants are net-long (bullish bias).
Value < 1.0 → Market participants are net-short (bearish bias).
Strength of deviation from 1.0 indicates positioning imbalance magnitude.
Because the ratio is OI-weighted, large players or heavily margined exchanges influence the output proportionally more than smaller, low-volume venues — making this metric a better reflection of true market positioning rather than isolated retail sentiment.
Usage and Applications
Use this indicator as a component in:
Orderflow and sentiment confirmation, alongside price action and volume.
Funding rate correlation studies.
Intraday reversals or exhaustion zones, when combined with volatility or OI delta metrics.
Overlaying or combining this indicator with open interest change, cumulative volume delta, or funding rate divergence allows traders to build a high-resolution understanding of positioning shifts and crowd behavior.
Notes
The “Lite” version is optimized for execution and accessibility, focusing on accuracy while staying within Pine Script’s computational limits.
Exchange data availability may vary by symbol; unsupported pairs automatically return na and are automatically not included in the weighted calculation.
In summary:
This indicator transforms fragmented, exchange-specific Long/Short Ratio into a unified, OI-weighted global sentiment measure — a foundational tool for traders seeking to quantify derivative-side orderflow bias with cross-venue accuracy.
ATR DAILY PROGRESSION)Indicator: ATR Daily Progression — Final Compact Edition
1. Indicator Objective
The ATR Daily Progression indicator measures the progression of intraday volatility as a percentage of the daily Average True Range (ATR).
It provides a quick visual overview of whether the market has reached or exceeded its average daily range of movement.
This helps traders avoid entering low-probability continuation trades once the day’s ATR is already completed.
2. Visual Presentation
Horizontal bar ranging from 0% to 150% of the ATR.
Green color up to 100%, then red beyond that point.
Main ticks: 0, 25, 50, 75, 90, 100, and 150%.
Full-height white vertical lines at 0%, 100%, and 150%.
A floating badge displaying the current ATR completion percentage, always visible.
Compact Height mode enabled by default for optimal visual integration.
3. Key Features
Function Description
Precise alignment The transition from green to red occurs exactly after the 100% tick.
Audio & visual alerts Triggered at 75%, 90%, 100%, and 150%.
Session flash effects The filled bar blinks when the ATR is reached (100%) or exceeded (150%).
Dynamic badge Displays the current ATR %, green before 100%, red after.
Compact layout Three-line table format for better chart integration.
4. Recommended Settings
ATR Length (Daily): 14
Bar width (steps): 32–40 (depending on chart size)
Always green below 100%: enabled
Show floating % badge: enabled
Compact Height: enabled by default
Flash at 75% and 90%: enabled
Flash at 100% and 150%: enabled
5. Strategic Use
The ATR Done Today is a visual discipline tool designed to help traders:
Identify when the market has likely completed its daily move.
Avoid late-session counter-trend trades.
Visualize volatility compression or expansion.
Determine optimal times to take profits or pause trading.

Leverage & Liquidations (Margins) Plotter - [SANIXLAB]Leverage & Liquidations (Margins) Plotter —
This indicator visualises liquidation zones across multiple leverage tiers and helps traders manage margin exposure .
It dynamically plots the liquidation ranges for 5x → 100x positions, highlighting where leveraged traders could get wiped out.
Add manual long / short markers , choose leverage and margin size, and the script calculates your exact liquidation prices — buffered for realism.
A clean control panel shows entries, liquidation levels, and percentage distance to liquidation.
Features
Visual leverage zones (5x → 100x)
Manual Long / Short marker system
Margin-based liquidation math with buffer
Toggleable entry & liq lines
Compact top-right control panel
Floating mid-zone leverage labels
Fully customizable colors
Use Case
Quickly see:
Where 10x / 20x traders get squeezed
How far your own trade can move before margin burn
Where cascading liquidations might begin
Perfect for futures & leverage traders who want to keep one eye on price … and the other on survival.
— MR.L ☕
Brewed with caffeine, coded with care.

BTC Flow Dashboard (Spot Premium + OI + Funding)It builds a single flows dashboard that shows whether real spot demand (fiat buyers) or leveraged perps (futures traders) are driving BTC, and then cross-checks that with Open Interest (OI) and funding pressure—all normalized so you can spot regime shifts and squeeze risk fast.
How to read it (practical playbook)
Continuation (healthier trend)
Price ↑, premium > 0 and rising, oiZ ≥ 0 → spot sponsoring the move; perps chase → add on pullbacks.
Leverage-led & vulnerable
Price ↑, premium < 0, fundZ > 0 (expensive longs) → crowding → fade extensions / expect sharp pullbacks.
Buyable dip / absorption
Price ↓, premium ≥ 0 (spot supporting), oiZ flat/down, fundZ ≤ 0 → selling looks weak → scale into reversals.
Exhaustion / mean reversion
premZ ≥ +2 after a run → flows unusually hot → take profits / tighten risk.
premZ ≤ −2 into key support → capitulation risk but also bounce setups if OI/funding aren’t pressuring.


Liquidations Aggregated (Lite)Liquidations Aggregated (Lite)
The Liquidations Aggregated (Lite) script provides a unified cross-exchange visualization of short and long liquidation volumes, allowing traders to identify high-impact market events and sentiment reversals driven by forced position closures. It aggregates normalized liquidation data from Binance, Bybit, and OKX into a single coherent output, offering a consolidated perspective of derivative market stress across major venues.
Core Concept
Liquidations are involuntary closures of leveraged positions when margin requirements are breached. They represent points of structural orderflow imbalance, often triggering localized volatility spikes and price pivots. This indicator isolates and aggregates those liquidation volumes by direction (short vs. long), allowing traders to map where leveraged traders are being forced out and whether current market movement is driven by short covering or long capitulation.
Underlying Methodology
Each connected exchange provides liquidation feeds via standardized symbols (e.g., BTCUSDT.P_LQBUY or BTCUSD.P_LQSELL).
The script differentiates between:
Short Liquidations → Buy Volume: Forced covering of shorts, representing upward pressure.
Long Liquidations → Sell Volume: Forced selling of longs, representing downward pressure.
Bybit’s inverse data is normalized to align directional logic with Binance and OKX. Data is drawn through the request.security() function per symbol and per exchange, with per-exchange scaling adjustments applied to compensate for differences in reported nominal sizes (USD vs. coin-margined). The script is meant to match the calculation methods of professional-grade data sources (e.g., Velodata, Coinalyze). The value is denominated in the base currency at all times.
Computation Logic
Liquidation volumes are fetched separately for USD- and USDT-margined pairs on each exchange.
Exchange-specific magnitude adjustments are applied to account for nominal denomination differences.
Normalized liquidation buy and sell volumes are summed into two global aggregates:
combinedBuyVolumeLiquidationsShort → aggregated buy volume from forced short positions closes (Short Liquidations)
combinedSellVolumeLiquidationsLong → aggregated sell pressure from forced long position closes (Long Liquidations)
Final series are plotted as mirrored column charts around a zero baseline for direct comparison.
How to Use
Apply the script to any crypto perpetual futures symbol (e.g., BTCUSDT, ETHUSDT).
Observe teal bars (Buy Volume from Short Liquidations) for short squeezes and red bars (Sell Volume from Long Liquidations) for long wipes.
Strong teal spikes during downtrends often indicate aggressive short liquidations leading to short-term bounces.
Strong red spikes during uptrends often mark long unwinds that can trigger sharp retracements.
Sustained asymmetry in either direction suggests systemic imbalance across leveraged positioning.

Open Interest + Continuation/Discontinuation Patterns📈 Open Interest + Continuation/Discontinuation Patterns
This indicator analyzes Open Interest data to detect four key convergence/divergence patterns that signal potential trend continuation or reversal:
Buyer Continuation
Seller Continuation
Buyer Discontinuation
Seller Discontinuation
Each pattern is identified by comparing price action with Open Interest behavior, using pivot-based logic and ATR filtering for precision. When a valid pattern is detected, the indicator draws visual lines on the chart and triggers custom alert conditions for each type, enabling timely decision-making.
The Open Interest data is plotted as a candle-style oscillator, offering a clear view of momentum shifts. The detection logic is fully configurable, allowing users to adjust pivot sensitivity, lookback ranges, and ATR filters to suit different market conditions.
Key features:
🔍 Detects continuation and discontinuation patterns via convergence/divergence logic
🔔 Alerts for all four pattern types
🕯️ Candle-style visualization of Open Interest
⚙️ ATR-based filtering and pivot customization
Perfect for traders seeking to enhance their market timing using Open Interest dynamics and divergence-based signals.
