Coinmaster Holding ScriptRECOMMENDATION: I PREFFER USE THIS ON 4H OR 1D TIMEFRAME
In the following article, I have completed the creation of this semi-automatic script dedicated to institutional capital management in the different markets, its development was carried out under operations that exceed a balance greater than 1 million usd, which will allow you to summarize your technical analysis or you can request my support to automate your account after your previous studies.
Alerts have been created that you can program or automate through webhook, under which you can program for advice or consultancy to your account, either to integrate indexed, forex or cryptocurrency trading api keys or to perform leveraged operations either long or short with leverage especially cryptocurrencies, with a focus on BTC / USD, BTC / USDT, ETH / USD, ETH / USDT, LTC / USD, LTC / USDT, TRX / USD, TRX / USDT but adaptable to any asset
where I deliver 6 years of research, training, use, development and implementation of different analysis and trading mechanisms in financial markets.
It allows you to carry out simple technical analysis studies in a calculated way
Using wide and different methods, which are automatically arranged algorithmically, indicating a buy or sell signal based on the "Price Action + Average True Range or Atr", which also takes into consideration the increase or decrease in volume and different combined conditions are used to arrive at a "combined signal" between them:
Macd
- RSI
- ATR "Average True Range
- Retracement and Fibonacci Levels
- Pivot Points
- Sar Parabolic
- Volume
- Crossing Moving Averages
- Price per volume trend indicator (VPT)
- Calculated Analysis of Divergence, Bullish Divergence, Bearish Divergence
- Analysis of Divergence and Fibonacci Crosses
- Combination of Pivot Points and Fibonacci Levels with automatic price adjustment for all time frames
- Automatic support and resistance adjustment
- Automatic adjustment, entry of new levels, eliminate and readjust fibonacci retracement levels and pivot points as the price advances automatically
- Calculation and Analysis and Strategy for Buying and Selling Bollinger Bands
- Automatic Creation, Analysis, Calculation and Adjustment of Trend Lines
- Ichimoku periods
- Automatic Calculation and Analysis of Divergence, Trend, Price and Volume taking into account multiple factors such as: Trend Lines, MACD, Balanced Volume or "OBV", Relative Strength Index "RSI", Commodity Channel Index (CCI )
You could use my indicator to either:
1. Create summary Buy and Sell Alerts
2. Create Alerts with Customizable Conditions
3. Create Alerts and Automate these by means of webhook shipments
4. Open and Close Positions automatically through Alerts sent through webhook and conditioned on your platform by custom% profit, either take profit or stop loss
You can configure the following alerts in an unlimited way:
-Buy Signal Indicated by Atr
-Sale Signal Indicated by Atr
-Buy signal by volume price trend indicator (VPT)
-Sale signal by volume price trend indicator (VPT)
-Sar Parabolic -High
-Sar Parabolic - Baja
- Bullish divergence
-Bearly divergence
-Crossing moving averages
-Cross above the Downtrend of the Fibonacci Level 0.382
-Cross above the Bearish Trend of the Fibonacci Level 0.5
-Cross above the Bearish Trend of the Fibonacci Level 0.618
-Crossover above the Bullish Trend of the Fibonacci Level 0.382
-Crosses above the Bullish Trend of the Fibonacc Level 0.5
-Cross above the Bullish Trend of the Fibonacci Level 0.618
-Cross below the downtrend of the Fibonacci Level 0.382
- "Crossover below the downward trend of the Fibonacci Level 0.5
-Cross below the downtrend of the Fibonacci Level 0.618
-Cross below the uptrend of the Fibonacci Level 0.382
-Cross below the uptrend of the Fibonacci Level 0.5
- Cross below the uptrend of the Fibonacci Level 0.618
1. If you don't want to rely on a single truth from my indicator, combine this with either RSI, MACD, or ADX levels.
2. If you are going to use it for a leveraged trade, A) My indicator does not have the absolute truth, B) Try to assign a% of take profit or stop loss range to allow the price to move without closing your recommended trade in loss. 3 to 4% or greater than 1%
Postscript: Use it at your own risk, I have made this script based on my personal opinion and experience, which is not considered at any time a financial or investment advice or of any kind, which after reading this I free myself from Any financial responsibility for your personal decisions, what you read in any market or legal action will only be considered before any court, person, page, agency, broker, trader, tools, investors, developers or people of any field and of any situation such as If fidubit has given computer advice for educational purposes on the use of pine script, all investment in any type of economy, asset or financial markets is at risk of ups and downs, therefore you are fully responsible for your investment, administration, decision, analysis and use and you should use only your risk capital in the broker you choose
Sellsignal

RogTrader HFT AlgoThis is a simple algorithm to generate Buy, Sell, Short, and Cover Signals. It uses the following:
RSI , MACD , Stochastic , Bollinger Bands , Ketler Channels, ATR Trailing Stop, Trend, and Volume .
Usage is simple: Green Background is Long and Red Background is Short positions.
LE = Long Entry
LX = Long Exit
SE = Short Entry
SX = Short Exit
This is not a trade recommendation, rather informative signals, and please do your due diligence. Thanks!

Escaping of Rate from Avarage By Mustafa OZVEREscaping of Rate from Average By Mustafa OZVER
This code shows a location of a rate or price (or etc.) from the average, rated by the standard deviation.
To show that, calculates the ema and standard deviation of our data then calculates the distance between ema and the current data by the standard deviation.
In summary, we can say that this value is the current distance by the long term standard deviation.
This value is between +1 and -1 because we expect the absolute value of the standard distance does not get far from the long term standard deviation.
For scalping, we can use this value as
buy signal when the value is below -1,
sell signal when the value is above +1,
But only this value can not guarantee good results for trading. BE CAREFUL

Trend Chaser Pro Trend Chaser Pro( TCP ) is a powerful indicator that is made using several years of experience in trading and coding with a lot of backtesting. it can be used as a Stand-Alone indicator as well as in combination with other indicators to provide more confluence when trading. The main purpose of TCP is to help market participants by providing buy and sell signals as well as indication of Tops and Bottoms in any trading market.
- There are 3 main components to TCP :
1.Top/Bottom Indicators:
Tops are indicated with "❖". There are two colours that are used. light red for Tops and dark red for Max Tops
Bottoms are indicated with "✦". There are also two colours that are used to demonstrate Bottom conditions. light green indicates Bottoms and dark green indicates Max Bottoms
2. Buy/Sell indicator:
Buy signals are indicated with a green "●" and Sell signals are indicated with a red "●" using price volatilities with
calculation of price movement in trending and ranging environments .
3.Bars colour
for a clearer visualisation of Buy/Sell indicator signals , colour of bars change from light blue to orange and vice versa.
light blue bar colour is an indication of uptrend and provides buy signal
orange bar colour is an indication of downtrend and provides sell signal
p.s. Period can be changed to have more aggressive (if decreasing the number) or more conservative( if increasing the number) signals.
(*please always remember that past performance of this indicator is not an indication of its future performance and you always need to do your own research before taking action in financial markets*)
(** PM to request access**)

PT Trend BarsVersion 1.0 of our Trend Bars Indicator offers a visual of the current trend. The purpose of it is to help you avoid counter trading the trend. It will not identify the exact top or bottom, but it will help you identify overall in which direction the market wants to head. High time frame trend bar candles will allow you to ride the wave for multiple weeks.
White candles indicate bullish trend
Black candles indicate bearish trend
Strategy:
Daily is our favorite time frame to use when trying to identify the overall macro trend of the asset. Once we cross bull with three consecutive white candles, we can assume we are bullish until the candles flip bear again (black). On lower time frame, if the candles flip color but the price is going against trend, you can assume we are going for a retest.
This Oscillator is best used with the PT Buy Sell indicators we provide. It offers extra confluence for a stop loss & for a target for swing setups. It is included as part of the library. Just message us for access!

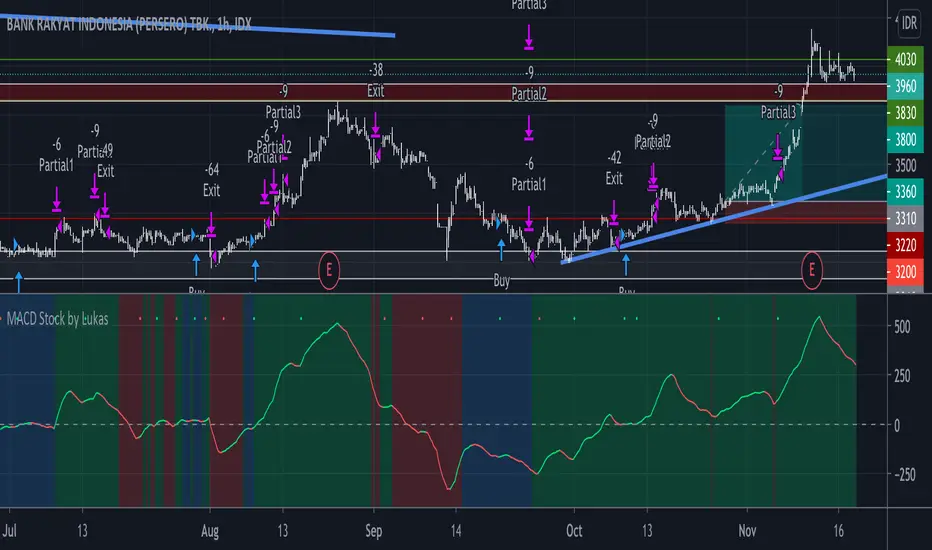
Strategy MACD Stock by LukasHello guys, long time no update.
This time I make strategy for Stock,
The strategy is for LONG only because where I live I can not Short Stock (Indonesia :) )
Basically I combine MACD, DEMA, RSI and EMA.
I try 1D, 4H, 1H and it's perfect for me, when you play higher timeframe try to turn "ON" "Filter" on the menu setting.
RED GREEN line is represent MACD
YELLOW ORANGE line represent Bull and Bear, useful when you play on high timeframe.
There is also setting for Stop Loss and Take Profit level.
Please give it try and give me some feedback.
Hope its useful,
Stay safe everyone :)
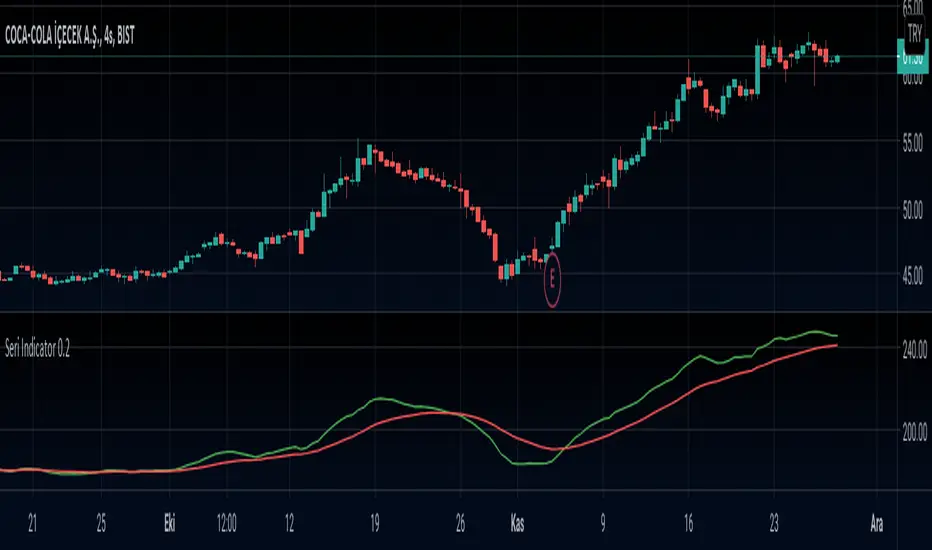
Seri Indicator 0.1This is a Moving Average based indicator that is inspired by the MACD indicator. The indicator is intended to indicate trend reversals, and works best in hourly charts (1h-2h-3h-4h).
The Seri Indicator is easy to interpret, which was one of the design goals. If the Fast Moving Average (Green Line) crosses ABOVE the Slow Moving Average (Red Line), it indicates a BULLISH Trend, therefore a BUY SIGNAL. If the Fast Moving Average (Green Line) crosses BELOW the Slow Moving Average (Red Line), it indicates a BEARISH trend, therefore a SELL SIGNAL. The indicator is in development phase so it is natural for it to give faulty signals, so it is good practice to use it on a longer-term chart than the intended one (Use 2h chart for hourly trades etc.).
Any suggestions for improvements are highly welcome!
ATR SL Buy/Sell w/ SMAsFirstly I'd like to state that this script's ATR buy/sell source is from the public script library here:
Additionally with the buy/sell signals from the original script, two more buy/sell conditions were added to give more entries/scaling in or out options. On top of that, two SMA lines were added, a 1 day moving average and a 5 day moving average.
This script is more so designed for scalping/scaling in and out of positions already made.
The SMAs add a level of confidence to the entry order, buy/sell triggers are not based on these SMAs.
For the confirmation on the entry, ideally you want a bullish cross on the SMAs, as well as the color of the SMA to correlate to the buy/sell color.

RogTrader AlgoA simple BUY/SELL algorithm based on Moving Averages (EMA), MACD, RSI, Stochastic, ADX, ATR, CCI, OBV, Pivot Points, and Parabolic Sar, and Volume averaged.
Simple algo that uses multiples indicator strengths and weight them to generate buy and sell signals
Indicator strengths are displayed on each candle (green is bullish and red is bearish)
Green Buy and Red Sell shall be primarily used for long positions
Bull and Bear Strengths are created based on Price Action, and Volume, the length of the array shows upward or downward strength
Indicators' Signal Strength shows number Indicators' indication for the direction.
Bollinger Bands are in red and green filled
VWAP Bands are in gray, green, and red
Linear Regression is the blue line
Check multiple timeframes.

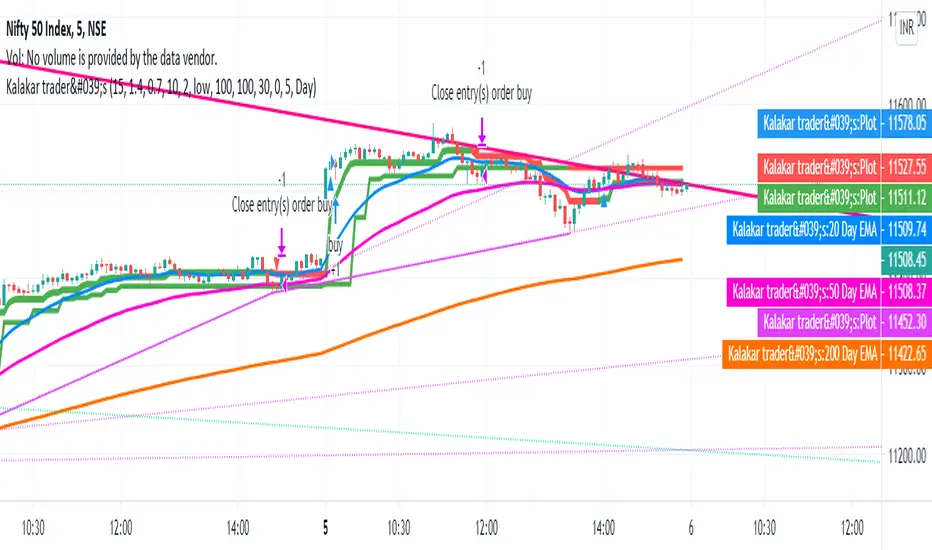
auto trend lines with buy sell signalKalakar trader's Tools is the tool where Buy and sell signals generates automatically according to the candles behavior.
It automatically made trend line
It as build in moving average also
It uses WD Gann Levels to calculate entry point with the help of VWAP .
Pivot points determines the recent support and resistance levels.
Trading rule for this indicator
This indicator is designed for Indian equity stocks
Best performance is expected on 10 minutes chart basic user can use 5 minutes chart for stock value less than 500 rupees, else 15 minutes chart
Plotted line shows the market sentiment, green for buy, red for sell and black for neutral market.
Order thumb rule
For buy signals there is a up triangle in green color
For sell signal there is a down triangle in red color
1. avoid any trade signal before 9:35 AM Indian time
2. signal and related stop loss candle must be formed in the same day
3. if order placed in 5 minutes chart then don't go for a target of 15 minutes chart
4. if order placed in 15 minutes time frame and target is too far then check the target in 5 minutes time frame
5. if signal candle touches the target then avoid the signal.
6. Money management is most important for this indicator.
7. Take trade only if it satisfy risk reward ratio.
8. It has long target but need patience.
Signal
using vwap calculates gann square of 9 levels and if any smart money activity on that level then checks the confirmation of the trend by higherhigh or lowerlow formation
Buy Entry : entry price should be on the high of the candle before signal for buy and sl on bottom of flagged candle just before signal
SellEntry : entry price should be on the low of the candle before signal for sell and sl on top of flagged candle just before signal
Please add some extra value to the Stop Loss for safe trading
Warning : Don't place any order without stop loss, This tool is made for educational and learning purpose only, take any trade at your own risk.
ATR Stop Buy StrategyThis strategy trial is let you to giving sell and buy orders with ATR (average true range) and an coefficent for them. it is my first strategy work, needs to be upgraded. USE IT WITH YOUR OWN RISK. IT IS NOT EVEN GUARANTEED TO WORK.
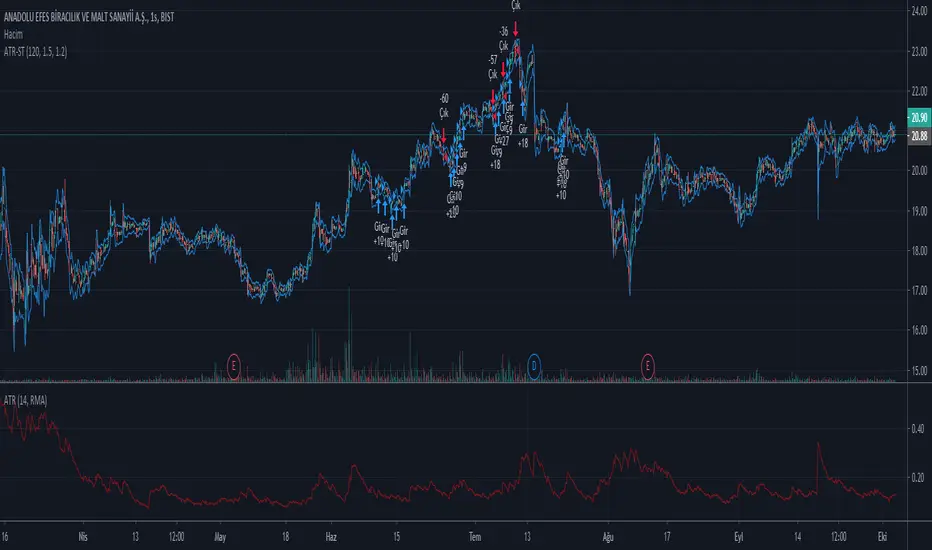
TRADERS COMPANION BUY AND SELL INDICATORTHE 'PROBLEM'
A lot of buy and sell strategies are based on price action being at a particular (support) level, crossovers of different moving averages or of price action over moving averages. Whilst this is a safe way to trade, the price paid is lost earnings , whilst one waits for price/moving averages to reach a particular level/configuration. So for instance price may have to move X% before it crosses over a critical level and only then is a trade taken - the X% is usually 'lost'.
THE 'SOLUTION'
My motivation was to write a buy and sell indicator which makes (long) calls as early as possible therefore maximising profits and minimising losses whilst also identifying local tops at which profits may be taken if so desired.
THE METHOD
The philosophy of this indicator is centred around analysis of candlestick parameters for the present candle and comparing these to those of previous candles at set points. The results of these comparisons are then correlated with moving averages of price action and in so doing one is able to detect shift reversals earlier than conventional indicators would. Consequently, a signal can be created very close to the bottom of a rally. In addition, a 'take profit' signal can be created from what has been identified as a local top. Please refer to the attached chart where it becomes evident quite immediately that buy and TP signals allow for maximisation of a given trend, hence maximisation of profits.
MARKETS
The script may be applied to any market i.e. crypto, forex, stocks - as long as there's a chart on Tradingview, it will work.
CONDITIONS
The script works well in all time frames. Obviously at higher time frames one gets 'cleaner' signals since high time frames are themselves a kind of filter, given that lower time frames are 'busy' by nature.
CAVEAT
Whilst great care and attention has been put into polishing and re-polishing this script, it needs to be stated that it's not perfect. Two issues that one needs to be aware of:
1.) Sometimes signals will not be made as early as the actual bottom of a rally.
Mitigation for this is two fold:
a.) Most of the calls made by the script are close to a bottom and therefore profits realised from this are far more than any losses accrued from a late call.
b.) The script should never be used in isolation but along with TA strategies and common sense.
2. Sometimes a 'bad' call will be made.
Mitigation for this is two fold:
a.) The script has a 'smart' feature that calls for exit signals as soon as it's realised that the long call was not a favourable one. This enables one to minimise losses by cutting them quickly.
b.) The script should never be used in isolation but along with TA strategies and common sense.
PLEASE PERUSE ATTACHED CHART
I encourage you to please peruse the attached 'GOBTC' chart for a demonstration of the script in play.
HOW TO GET AND USE THE SCRIPT
Since its invite only, please PM me and I will be happy to add you. Once added, you will see the list under Indicators>Inviteonlyscripts>TRADERS COMPANION at which point you click and it will show on your chart. It also needs to be stated that there is a no obligation trial period during which one is encouraged to 'test-drive' the script to ones hearts content.

CryptoSignalScanner - OverBought/OverSold Zone IndicatorDESCRIPTION:
This indicator has been designed to do some swing trading on 4 hour and daily candles.
It also gives good results on the lower timeframes 5m, 15m and 1h but trading on those levels is time consuming and stressful.
• This indicator is based on RSI, Stochastic RSI and some other indicator(s).
• This indicator is based on our "CryptoSignalScanner - Advanced BUY/SELL Indicator" but with a small difference in calculation to define the OverBought and OverSold zones.
• It displays the OverBought and OverSold zones.
• It is also possibility to set an OverBought/OverSold, OverBought and OverSold alert.
HOW TO USE:
• When the OverBought zone is displayed it means that the trading pair is OverBought. Wait for the reversal to SELL. Use the Fibonacci tool together with the Eliot Waves Theory to SELL.
• When the OverSold zone is displayed it means that the trading pair is OverSold. Wait for the reversal to BUY. Use the Fibonacci tool together with the Eliot Waves Theory to BUY.
FEATURES:
• You can adjust the OverBought and OverSold zones.
• You can display/hide the RSI.
• You can adjust RSI values.
• You can display/hide the Stochastic RSI.
• You can adjust Stochastic RSI values.
• You can display/hide the ...
• You can adjust the ...
• You can set OverBought/OverSold alert.
• You can set OverBought alert.
• You can set OverSold alert.
• Etc...
REMARKS:
• This advice is NOT financial advice.
• We do not provide personal investment advice and we are not a qualified licensed investment advisor.
• All information found here, including any ideas, opinions, views, predictions, forecasts, commentaries, suggestions, or stock picks, expressed or implied herein, are for informational, entertainment or educational purposes only and should not be construed as personal investment advice.
• We will not and cannot be held liable for any actions you take as a result of anything you read here.
• We only provide this information to help you make a better decision.
• While the information provided is believed to be accurate, it may include errors or inaccuracies.
HOW TO GET ACCESS TO THE SCRIPT:
• Use the link below to subscribe to our indicators.
Good Luck,
SEOCO

[Alerts] Custom ORB with Target/StoplossThis Open Range Breakout (ORB) Indicator displays High, Low for the selected time frame.
Indicator Feature :-
Shows Long & Short signals based on the crossover.
You can use different alerts like Long, Short, Long-TP, Short-TP, Long-SL, Short-SL, Close
You can change Take profit points
Stop Loss will be low of breaking candle when Long signal is generated and high of breaking candle when Short signal is generated
Select Session time to get alerts only on that period
Select Square off and End Session to generate Close alert based on a specific time at the end of the day
In the future, I will Enhance and update this Indicator if needed
If you have any suggestion mention here
Thank you :-)

Dexie Indicator v1.0The Dexie Indicator is a Forex indicator system built for the 5 min chart. It is suitable for Forex traders and Nadex users and provides BUY/SELL signals with alerts and comes with a series of 8 custom built Moving Averages designed to reduce the need for chart drawing.
This indicator can be used by beginners out of the box and requires very little trading experience to be successful.
The more advanced trader can work with this tool to greatly increase their success rate and make for a much more enjoyable trading experience.
Please contact for more details.
Dexie Indicator with BUY/SELL signals displayed only:
Dexie Indicator with BUY/SELL signals, Bollinger Bands and custom Moving Averages:
Dexie Indicator with all custom Moving Averages displayed:
Dexie Indicator slower Moving average bull cross example:
Dexie Indicator slower Moving average bear cross example:

Dexie Indicator v1.0The Dexie Indicator is a complete Forex trading system built for the 5 min chart. It is suitable for Nadex users and provides BUY/SELL signals with alerts and comes with a series of 8 custom built Moving Averages designed to reduce the need for chart drawing.
This indicator can be used by beginners out of the box and requires very little trading experience to be successful.
The more advanced trader can work with this tool to greatly increase their success rate and make for a much more enjoyable trading experience.
Please contact for more details.
Dexie Indicator with BUY/SELL signals displayed only:
Dexie Indicator with BUY/SELL signals, Bollinger Bands and custom Moving Averages
Dexie Indicator with all custom Moving Averages displayed

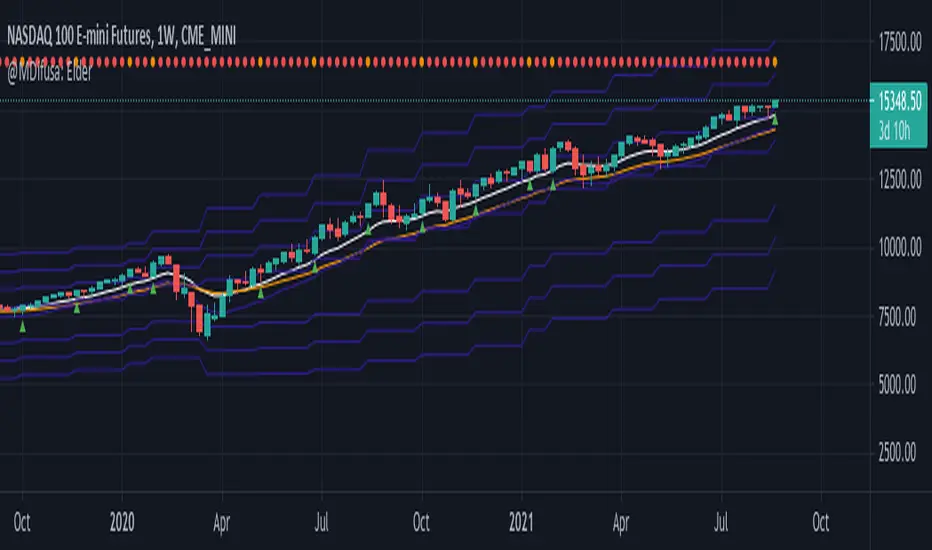
Elder EMA, ATR & MACD Indicator, 5X Time Frame & Divergences.This indicator is elaborated following the 3 window strategy described by Elder.
The fast, slow averages and MACD histogram are taken from a time frame 5 times higher than the active time frame and indicate bullish / bearish trends as well as divergences (bottom) of the hostogram with the price.
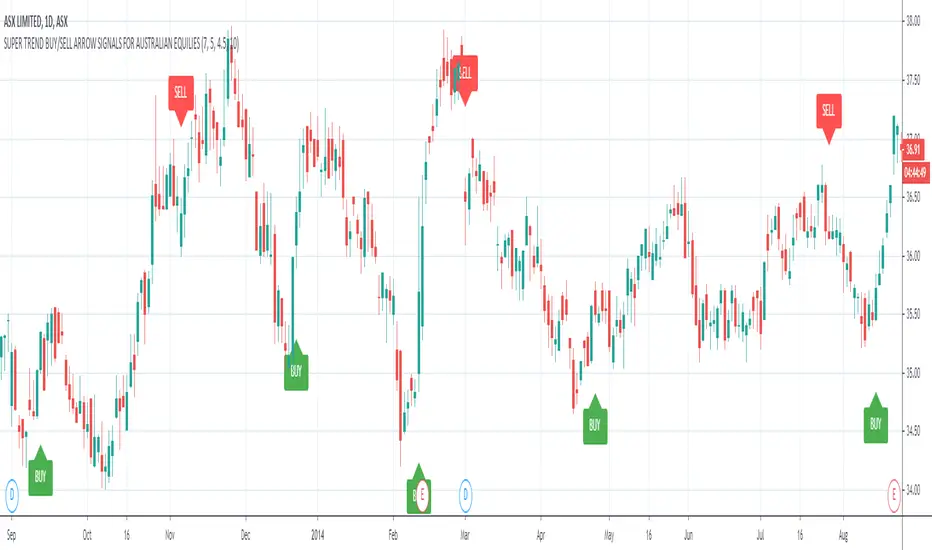
ASX Buy/Sell Arrow Signals For Australian Equities TradingASX Buy/Sell Arrow Signals For Australian Equities Trading.
ASX:ASX
This indicator is specifically designed to trade on assets on the Australian Stock Exchange.
The indicator analyzes historical data and predicts short-term trends and reversal points, as well as generates alert Buy/Sell or Long/Short trading signals.
A distinctive feature of this indicator is that the signals are filtered and high-precision signals are displayed.
The script is useful for trading as an independent trading system, as well as in combination with other indicators, as an addition to any existent trading system.
This script was compiled at the request of our subscribers and we hope it will be useful in trading.
The indicator uses a combination of few popular indicators such as MACD, RSI, Moving Averages.
Recommended for trading on timeframes: D1, W1.
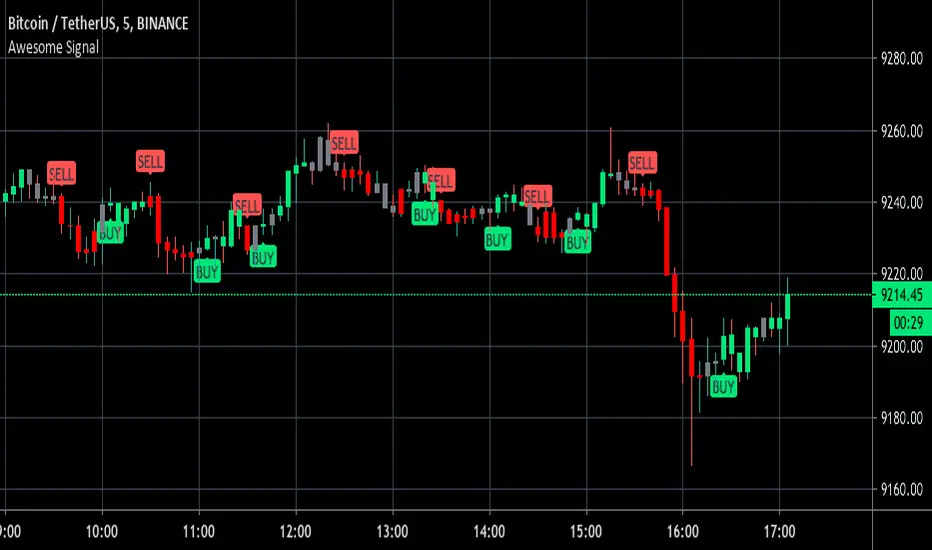
Awesome Buy/Sell SignalBuy and Sell signals using Bill William oscillators. Works for anything with high volume both crypto and stocks.
Optimal at Lower time frames and larger time frames can give you trend.
Green painted bars bullish momentum
Grey painted bars undecided momentum
Red painted bars bearish momentum.
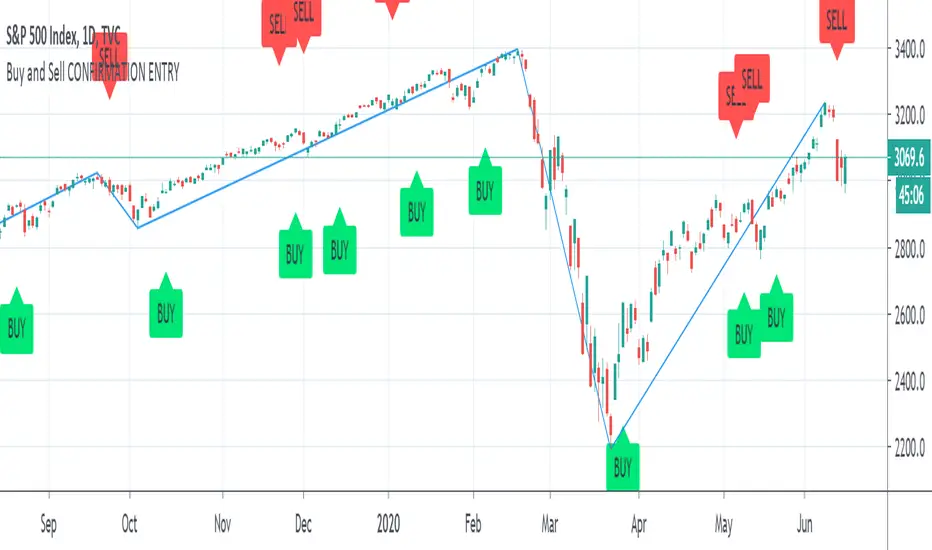
Buy and Sell CONFIRMATION ENTRY"Buy and Sell CONFIRMATION ENTRY" Product Description:
The indicator identifies market trends with visual buy/sell alerts on the chart.
Useful on higher timeframes available on Tradingview (ex: 4 hours, 1 Day).
The "Buy and Sell Confirmation" Indicator combines Moving Average Convergence Divergence and Relative Strength Index, which triggers technical signals when it crosses above (to buy) or below (to sell) its signal line. The crossovers transformed in buy and sell indicators is also taken as a signal of a market is overbought or oversold. The swing lines help you draw Elliott Waves to understand better where the market is heading.
The indicator can be used for every type of market: indices, stocks, cryptocurrencies, currencies and others.
This study is not a guarantee profit. You should backtest or trade virtual money before using this study on your real portfolio, as it is intended to be a tool and not a fortune teller.
Disclaimer: Trading and investing in the stock market and cryptocurrencies involves substantial risk of loss and is not suitable for every investor. The content covered in this videos is NOT to be considered as investment advice. I’m NOT a financial adviser. All trading strategies are used at your own risk.
Please send me a private message on TradingView to gain access to the script.
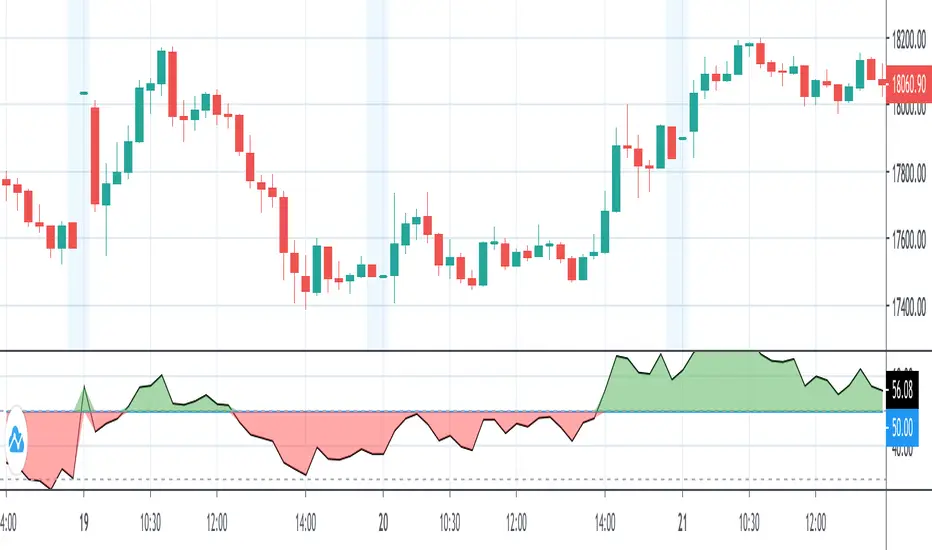
Buy/Sell IndicatorBased on logic from many top contributors here, the script utilizes LazyBear's WaveTrend Oscillator Indicator along with custom code to plot a few key components for daily trading;
Boundaries for entry and exit points which are based on a 6-day trend in OPEN/HIGH and OPEN/LOW prices.
Daily HIGH and LOW points to establish a good view of stock's movements
Entry and exit points with confidence levels. These can be treated as entry points for short to medium term investments
Entry points come in the colours of White and Lime, where white is slightly confident and lime is extremely confident
Exit points come in the colours of Maroon, and Red, where maroon is slightly confident and red is extremely confident
Each Entry and Exit point also comes without text, or with a M or H above it, where M indicates medium confidence on the point and an O indicates overconfidence.
Use Case:
The best possible use case is to enter a trade on a LIME point with O text, this means that is an overconfident entry point.
The trade should be exited on a RED point with O text, this means that is an overconfident exit point.
But you can do with the indicators as you please.
In addition to LazyBear's code, the following existing models and indicators are taken into account:
RSI of closing price over a period of 25
EMA of RSI

Volume Based Buy/SellThis is my very first scrip on this platform. It's the first version of the script, It works on the volume-based moving averages and exponential moving average.
I have added the buy/sell signals for educational purposes only. While adding the buy/sell signal I have an additional check on the strength of the trend to reduce loss to a minimum.
How to use:
1. Use with Heikin Ashi Chart.
2. Use 15 Min timeframe for intraday.
Some improvements I am working in the near future is:
1. Exit tread with the maximum profit.
2. Reduce down false trad to 0%.
To encourage and support please like the script try using for your own paper trading.
Dont forget to leave a comment on if you see any improvement in the script or any idea you have. Happy treading together.

RSI Market trendClear indication of market up and down trend so that you can stick to Buy or Sell strategy based on RSI.