Event Locator BasicUsable under any conditions and in all markets, the 'event locator' provides a foundational layer for any count-based trading strategy or system. This specific installment color codes events - all down events are green, up events are blue, double-marked events are red, and smooth events are gray. It also wraps the price sequence in a 3-d line landscape plot - providing a visual using lines that are event sensitive. Though events are sometimes referred to as 'fractals,' this is not a fractal tool. These marks are based on 3 candles, not 5 as is common with the Bill Williams fractal scripts. Every countable event on the chart will be marked using this tool. Really, Elliott Wave should have told you about this... (because you can't legitimately count w/o it)
//This indicator was originally a mod of the 'Williams Fractals' indicator - modified by Erek A.D., Nov. 2017
//It was rewritten from the ground up by 'Brobear' in Sept./Oct. 2018
//This code marks 'rough' AND 'smooth' EVENTS in price flow
//EVENTS are naturally created in markets when SEPARATION occurs at candle tips
//SEPARATION happens when a high is flanked by lower highs or a low is flanked by higher lows
//EVENT LOCATORS like this provide an objective foundation for counting price movement
Pesquisar nos scripts por "williams"

ATR_Normalized & WPR ATR_Normalized & WPR by SkyNet33
Based in ATR_Normalized public scrypt created by @Devil1986 mixed with Classical WPR Indicator.
ATR_Normalized good to use with Williams %R indicator, to find out when price has bottomed out.
ATR has to be over 95 and Williams %R ( lenght 52 ) has to be over 95 to find out level around which one is good to buy.

WVF - OscillatorAnother attempt on making use of CM-Williams-Vix-Fix-Finds-Market-Bottoms from Chris Moody - which is arguably one of the best indicator available on pine and tradingview platform. Every time I revisit this, I get new ideas on applying this method.
I have slightly altered formula to
highest(source)-source/highest(source)
from the original formula
highest(close)-low/highest(close)
Process is simple:
Calculate WVF for OHLC values separately
Calculate momentum on each of the WVF values based on distance from moving average
Plot the candles based on OHLC momentum.
Candle color depends on whether close, open and previous close. If close is higher than open and previous close, we get green coloured candles. If close is lower than previous close and open then we get red coloured candles. In all other cases, we will have silver candles.
High/Low bands are calculated based on median of highest and lowest values of VixFix. We also plot median of close which can be used in some cases.
How to use this to find market bottom. Look for one of the below conditions:
First red candle above high band - which signals momentum of vix fix is about to fall.
First red candle above median line - can be used only if upward momentum of wvf candles are trending well.
Crossunder of wvf candles under high band.
Possible exit scenarios
Green WVF candle formed above WVF high line
Entry is taken on first red candle above median line - but, candles turned green before WVF crossing under median line - may signal our thesis is wrong and price may drop further.
Some examples.

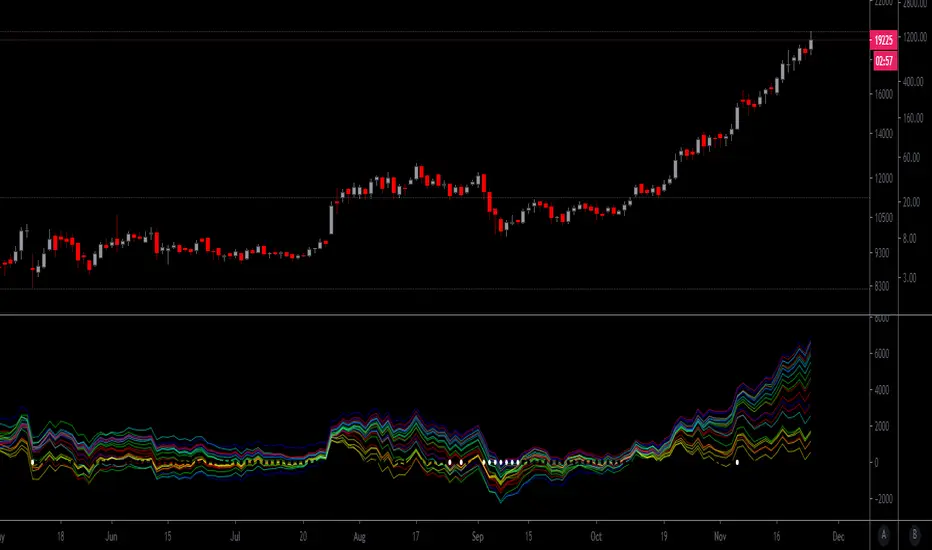
Crypto Volume/Strength ComparatorHello Traders,
Here is an attempt to perform comparative analysis between top cryptos based on strength (oscillator) and volume. Methodology used here is similar to Magic Number formula described in the post : Enhanced Magic Formula for fundamental analysis . But, instead of using fundamentals, we are making use of few technicals to derive similar outcome. Usage of the available stats will not be same as Magic number since we are using technicals.
⬜ Process
▶ Get crypto exchange based on prefix of instrument being used.
▶ For the given exchange, get data for all the tickers available in input fields.
▶ Calculate Oscillator, Momentum based on price for each tickers.
▶ Calculate Oscillator, Momentum based on volume for each tickers.
▶ Calculate Volatility for each tickers.
▶ Rank Price-Oscillator, Price-Momentum, Volume-Oscillator, Volume-Momentum, Volatility for each tickers.
▶ Calculate combined rank by adding up individual ranks.
▶ Calculate movement of rankings from bar to bar
▶ Sort tickers based on rank and populate them on table. Display direction of rankings.
⬜ Components
Display components are as follows:
⬜ Settings
Settings are pretty simple and straightforward
⬜ Calculations
▶ Oscillators : High values of oscillators are considered as ideal as the process is intended towards finding trend.
▶ Momentum : Momentum is calculated on the basis of Squeeze Momentum Indicator by @LazyBear.
▶ Volatility : Volatility is calculated on the basis of Williams Vix Fix by @ChrisMoody. Here too since we are in trend following mode, lower vix fix is considered ideal.
⬜ Few Notes
Tickers will show data only if selected exchange has them. Some tickers are not available in all exchanges. In that case, it will show NAN. This is kind of unavoidable as we need to have fixed size arrays for any calculations.
Indicator works only on crypto tickers which has valid exchange.
Tickers move through the rankings in real time. Background of all stats are based on gradient from green to red.
Tickers on top may not always have better long opportunity or tickers at bottom may not always be optimal for shorting. We need to consider how long the instrument may stay in the position or how fast it is moving in opposite direction. Hence, directions of the ranking movement are also shown on the table.

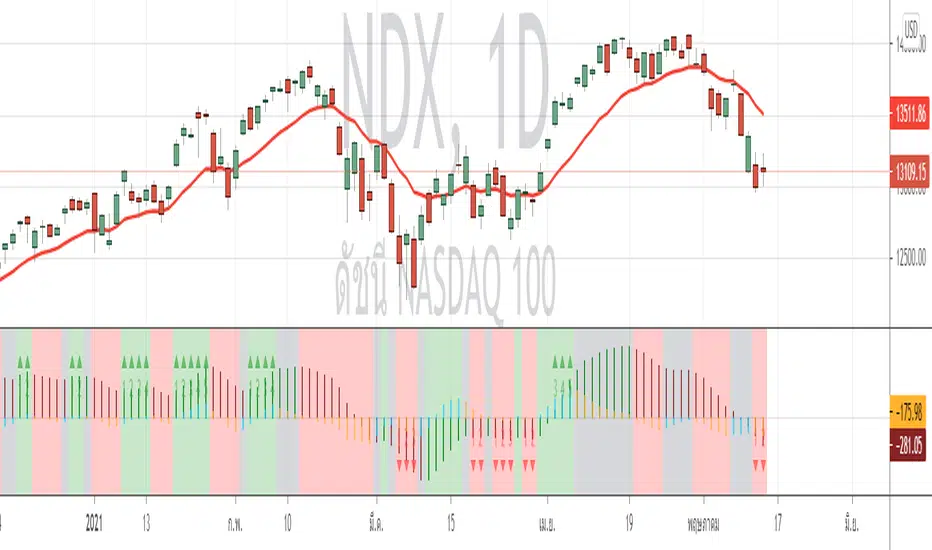
AO-ZoneThe Zone is mention in New Trading Dimensions by Bill Williams,PhD.
The Zone is used for Entry Signal
Green Zone are painting Green when Awesome Oscillator (AO) and Accelerater/Decelerator (AC) are both increasing.
Red Zone are painting Red when Awesome Oscillator (AO) and Accelerater/Decelerator (AC) are both decreasing.
Gray Zone are painting Gray when AO and AC in difference changing
Gray Zone are indicate the indecision between bulls and bears.
Bill Williams, PhD. mention that Green Zone or Red Zone usually happen 6-8 bars Continuously.
(in my opinion, it happen lower than in intraday time frame)
The First Bar that change to be Green or Red color is the Signal Bar.
Entry Signal is the second bar in the same color as the Signal bar happen with Volume
Price go higher the high of previous Green Bar is Buy Signal. Entry Buy (Long) and place Stop at 1 tick lower the Low of previous bar.
Price go lower the Low of previous Red Bars is Sell Signal. Entry Sell (Short) and place Stop at 1 tick higher the High of previous bar.
Can Entry from 2nd bar to 5th bar.
Do not Entry if Green Bars or Red Bars completed 5 bars continuously.
This indicator have AO , AC and Zone in 1 tools and there are counter to show the number of Green bar or Red bar.
Green counter will happen when AO >0 and Green zone because AO > 0 show uptrend condition.
Red Counter will happen when AO < 0 and Red Zone because AO <0 show downtrend condition.
When we entry , we should follow the trend. So I design to non-show the counter if zone is against the trend.
#WaveRiders
[BMAX] Fractals(ENGLISH)
This is a variation of the original Fractals indicator by Bill Williams - in this version we use the concept of three candles being in a swing low when the second candle has the highest high and on a swing high when the second candle has the lowest low.
(PORTUGUÊS)
Esta é uma variação do indicador original Fractals criado por Bill Williams - nesta versão usamos o conceito de três candles sendo considerado um pivô de baixa quando o segundo candle tem a máxima mais alta e um pivô de alta quando o segundo candle tem a mínima mais baixa.

Distance From-22-Moving Averages over CMOODYwilliamsVIXFIXThis script is a mean reversion script where each of the moving averages represent the price and Chris Moody's Williams Vix Fix ZERO line represents the moving averages. There are 4 moving average types included: EMA , SMA , WMA , HMA .
You can set up to your liking by having all of the averages as any or all of the 4 options.
This script is a great way to spot bearish/bullish divergences in price action.
This script is also excellent at indicating periods of price action when volatility is extremely low - all the plots get very tight instead of spread out.
I have copy/pasted a public script by Chris Moody which is the Williams Vix Fix. This indicator shows a white circle as a "top" or "bottom" based on the current price distance off the mean (in simple terms).
Thank you Chris Moody!
Fractals | Swing Points | Highs & Lows | Custom PeriodsSimple script which marks out key swing highs & lows.
One of the only indicators I have on the chart most days
- perfect for naked charting
- quickly helps you to visually identify key areas of interest
An extension of Bill Williams fractals
- aka short term swing points
Allows you to filter for only the most prominent swing points
- you can even overlay multiple swingpoint filters in different colours (as per example chart)
The number ( Fractal Periods) is simply:
- the number of less prominent points either side of your swing high/low
- example shown on the chart
Otherwise make a fist
- look at your 5 knuckles
- swing high is your middle knuckle
- 2 lower points either side
Bill Williams Original Fractal:
Fractal Periods = 2
Your Fractal Period for Filtering:
3, 4, 5, 30, 365, etc
Allows you to find swing points down to:
Fractal Periods = 1
Simple, easy, shared to enjoy =)

Super EMA PrismThis script implements the Binary Trade Logic (BTL) algorithm to calculate two distinct scores that range from 0 to 7. One score is calculated assigning a power of 2 weight to the positive sign of 3 Phi^3 distant Moving Average (MA) slopes. The other score is calculated assigning a power of 2 weight to the sign of the difference between the price and the value of 3 Phi^3 distant Moving Average (MA).
For the first score, hereafter called as the angle score (AS), the largest MA slope positive sign receives weight 4, the middle length MA slope positive sign receives weight 2 and the shortest MA slope positive sign receives weight 1. The positive sign of an MA is defined as 1 if the slope of the MA is positive and 0, otherwise. Therefore, for MAs 305, 72 and 17, if slope(MA305) > 0, slope(MA72) < 0 and slope(MA17) > 0, then score will be 4*1 + 2*0 + 1*1 = 5. Up to my knowledge, this score was first proposed by Bo Williams and named by him as Prisma.
For the second score, hereafter called as the value score (VS), if the price > largest MA, it receives weight 4. If the price > the middle length MA, it receives weight 2 and if the price > the the shortest MA, it receives weight 1. Therefore, for MAs 305, 72 and 17, if price < MA305, price > MA72 and price > MA17, then score will be 4*0 + 2*1 + 1*1 = 3. Up to my knowledge, this score was first proposed by Bo Williams and named by him as Prisma.
Both AS and VS are calculated for Phi^3 lengths (610, 144, 34) and for Phi^3/2 lengths (305, 72, 17). The scores of the same kind calculated for each set of length are combined multiplying the Phi^3 length score by 10 and adding with with the Phi^3/2 score, therefore providing a 2 digit score ranging from 0 to 77. For instance, if we have AS(610, 144, 34) = 7 and AS(305, 72, 17) = 5, we have AS=75. At the same time, if we have VS(610, 144, 34) = 6 and VS(305, 72, 17) = 4, we have VS=64.
VS score is plotted by default in black, but it can be on white for dark themes. AS is plotted with the color of the longest MA used.
Chart background is colored according to the range of values for AS and VS, checked in the following order:
if AS >= 13 and VS <= 13 then back color = red
if AS >= 13 or VS <= 13 then back color = orange
if AS >= 64 and VS >= 64 then back color = green
if AS >= 64 or VS >= 64 then back color = blue
otherwise back color = none (white o black)

ATR _NormalizedThis script is good to use with Williams %R indicator, to find out when price has bottomed out.
ATR has to be over 90 and Williams %R ( lenght 52 ) has to be over 95 to find out level around which one is good to buy.
You can check back, to see that this worked very well over history. Best way to use this 2 indicators is with DCA ( dollar cost average ), as area where to buy can go a little bit down and up for as long as few months. So dont just jump in, use DCA .

QQE WRThis is an improved version of the existing QQE. Its performs better because it relies on Williams %R instead of the RSI. The simplicity of the Williams %R gives the QQE better performance resulting in less false signals. It works across all instruments, especially volatile ones.

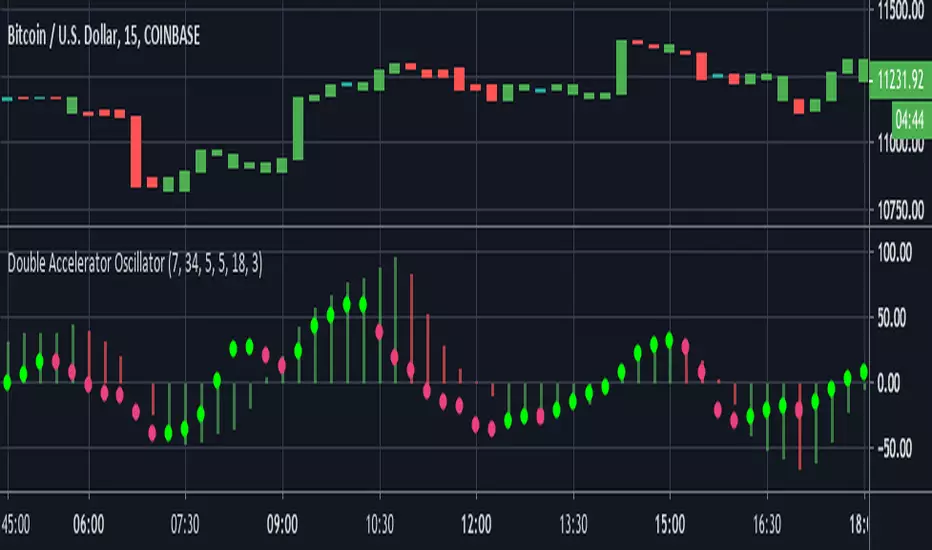
Double Accelerator OscillatorThis is a modified version of Bill Williams' Accelerator. The Accelerator measures the difference between the Awesome Oscillator(another Williams indicator) and its 5 day SMA.
This script plots 2 accelerators rather than 1. Users can define the lengths of the fast and slow SMA's used in the Awesome Oscillator calculation by adjusting the options in the input menu.
We set the default the lengths of the fast and slow SMA's used in the first Awesome Oscillator calculation as 34 and 7 periods. Then to find the Accelerator Oscillator, the difference between the Awesome Oscillator and its 7 period SMA is calculated. The second Accelerator uses shorter window lengths than the first. The fast SMA length is 5 by default and the slow SMA length is 18. Finally, the length of the Awesome Oscillator SMA used to calculate the second Accelerator Oscillator is 3.
By utilizing two Accelerator Oscillators with increasingly shorter window lengths, this indicator identifies changes in momentum very well.
The red and green histogram represents the first Accelerator Oscillator. It is green when the Accelerator is increasing and red when it is decreasing. I found this layout to be more practical than the standard, which plots the AC as green when it is greater than 0 and red when less than zero. The second Accelerator Oscillator is plotted as the bright green and pink circle line. It uses the same coloring conditions as above.
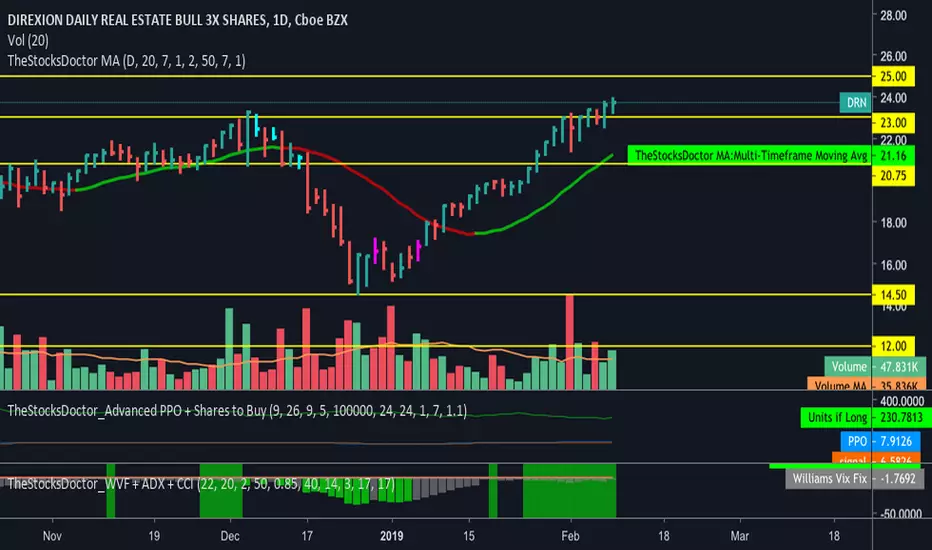
TheStocksDoctor_WVF + ADX + CCIThis script is a modified version of CM Williams Vix Fix for which I have added an indicator that shows when ADX and CCI are both indicating positive momentum - highlighted by green bars. This is part of TheStocksDoctor Trading System.
Inputs are as follows:
Lookback period Standard Deviation High ---> 22
Bolinger Band Length ---> 20
Bollinger Band Standard Dev.. ---> 2
Lookback period percentile high ---> 50
Highest Percentile ---> 0.85
----Highlight bars Below... --->
Show Highlight bar if WVF WAS true is now False --->
Show highlight bar if WVF IS True --->
----Highlight bars Below Use Filtered... --->
Show highlight bar for filtered entry --->
Show highlight bar for AGGRESSIVE Filtered Entry? --->
Check below to Turn all Bars Gray --->
Check box to Turn Bars gray? --->
Long-term look back current bar has to close Below... ---> 40
Medium-term look back current bar has to close below... ---> 14
Entry price action strength --close... ---> 3
--------Turn On/Off Alerts below... --->
---To activate alerts you HAVE To Check... --->
---You can un Check the box BELOW... --->
Show Williams Vix Fix Histogram... --->
Show Alert WVF = True? --->
Show Alert WVF wa true now False? --->
Show Alert WVF Filtered? --->
Show Alert WVF AGGRESSIVE Filter? --->
ADX Smoothing ---> 17
DI Length ---> 17
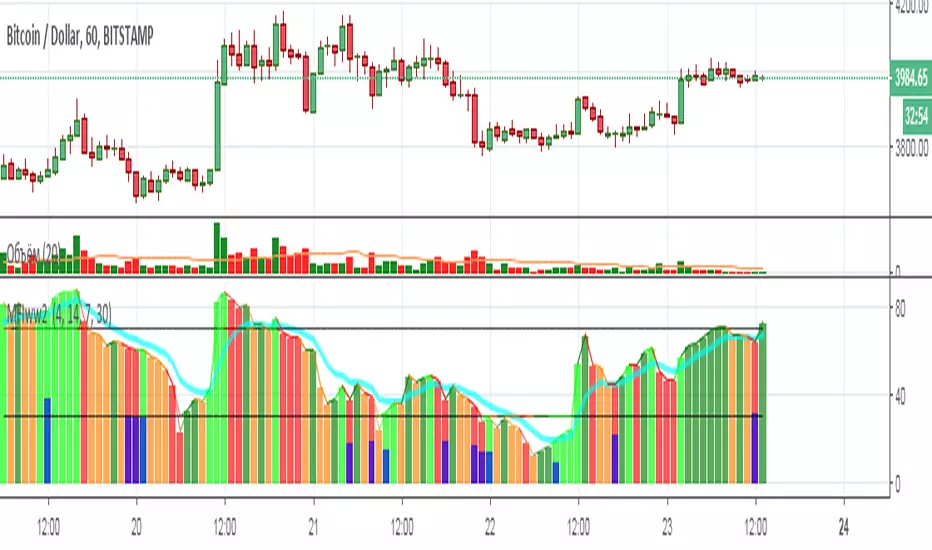
MFIww2 MFI/RSI [wozdux]Bill Williams indicator (MFI).
The indicator calculates the range of oscillations per unit volume. In fact, this indicator shows the tick volume or the readiness of the market to move the price.
The indicator is presented as vertical columns or as a line with levels.
Vertical columns are painted in different colors depending on the displacement of the indicator and the displacement of the volume. The indicator can increase or decrease (+-). The volume can also increase or decrease (+-). The combination of these factors generates four types of indicator columns.
++ lime
+- dark green
-+ red
-- orange
The red bar on Williams is a squat bar. This bar is important for market reversal indication.
-------------------------------
Индикатор Билла Вильямса (MFI).
Индикатор вычисляет диапазон колебаний на единицу объема. Фактически этот индикатор показывает тиковый объем или готовность рынка переместить цену.
Индикатор представлен в виде вертикальных колонок или в виде линии с уровнями.
Вертикальные колонки раскрашены в различные цвета в зависимости от смещения индикатора и смещения объема. Индикатор может увеличиваться или уменьшаться (+-). Объем также может увеличиваться или уменьшаться (+-). Сочетание этих факторо порождает четыре вида столбиков индикатора.
++ салатный
+- темно-зеленый
-+ красный
-- оранжевый
Красный столбик по Вильямсу есть приседающий бар. Этот бар важен для индикации разворота рынка.
ULTIMATE ICHIMOKU TRADING SUITEThis is an update of "Uncle Mo's Ultimate Ichimoku V1"
Main features:
2 x Ichimoku Cloud
5 x EMA
2 x MA
1 x HullMA
Williams Fractal
Bollinger Bands - ***NEW***
ATR - ***NEW***
PSAR - ***NEW***
Candlestick Patterns - ***NEW***
Price Action Bars- ***NEW***
List of credits:
@br0qn for the Ichimoku
@RicardoSantos for the Bill Williams Fractal
@EmilianoMesa for the EMAs/MAs
@mohamed982 for the HullMA
@ymaheshreddy4u for the Bollinger Bands
@ChrisMoody for the Price Action Bars and PSAR
@HPotter for the ATR
@repo32 for the Candlestick Patterns
The script is open source and free to use. Feel free to change it around to suit your needs.
***If you copy & paste code from other traders to make your own script, please do remember to give them credit for their amazing work.***
Happy trading!

Uncle Mo's Ultimate Ichimoku V1Main features:
2 x Ichimoku Cloud
5 x EMA
2 x MA
1 x HullMA
Williams Fractals
Study is based around trader @br0qn 's Ichimoku script.
Credits also go to:
@RicardoSantos for the Bill Williams Fractals
@EmilianoMesa for the EMAs/MAs
@mohamed982 for the HullMA
The script is open source so please feel free to change it around. I'd greatly appreciate it if you could suggest ways to improve it.
Happy trading!

Fractal Regression Bands [DW]This study is an experimental regression curve built around fractal and ATR calculations.
First, Williams Fractals are calculated, and used as anchoring points.
Next, high anchor points are connected to negative sloping lines, and low anchor points to positive sloping lines. The slope is a specified percentage of the current ATR over the sampling period.
The median between the positive and negative sloping lines is then calculated, then the best fit line (linear regression) of the median is calculated to generate the basis line.
Lastly, a Golden Mean ATR is taken of price over the sampling period and multiplied by 1/2, 1, 2, and 3. The results are added and subtracted from the basis line to generate the bands.
Williams Fractals are included in the plots. The color scheme indicated whether each fractal is engulfing or non-engulfing.
Custom bar color scheme is included.

Synthetic Vix StochasticI noticed that this indicator was not in the public library, so I decided to share it. This is Larry Williams take on stochastics, based on his idea of synthetic vix. Thanks to Active trader magazine, his article on the idea shows us how this tool can be used as a timing instrument for his sythetic vix. The idea he relates is that the market becomes oversold at the height of volatility and the stochastic can highlight the periods when the panic may be over. This is evidenced by readings above 80 and below 20. He states that his indicator is less reliable at market tops rather than bottoms, and evidence suggests just that. Stochastics readings in this indicator have been adjusted to look and 'feel' like traditional readings. His suggested settings are the default, but I have included a more traditional line in the code that reads the WVF high and low in the calculation instead of just the WVF, just uncomment the appropriate lines and see for yourself. This indicator works really well with the Williams Vix Fix, inverted of course, coded by ChrisMoody.
Enjoy responsibly
ShirokiHeishi
see the notes on chart

The Zone Trades v1.0The Zone is mention in New Trading Dimensions by Bill Williams,PhD.
The Zone is used for Entry Signal
Green Zone are painting Green Bars when Awesome Oscillator (AO) and Accelerater/Decelerator (AC) are both increasing.
Red Zone are painting Red Bars when Awesome Oscillator (AO) and Accelerater/Decelerator (AC) are both decreasing.
Gray Zone are painting Gray Bars AO and AC in difference changing
Gray Zone are indicate the indecision between bulls and bears.
Bill Williams, PhD. mention that Green Zone or Red Zone usually happen 6-8 bars Continuously.
The First Bar that change to be Green or Red color is the Signal Bar.
Entry Signal is the second bar in the same color as the Signal bar happen with Volume
Price go higher the high of previous Green Bar is Buy Signal. Entry Buy (Long) and place Stop at 1 tick lower the Low of previous bar.
Price go ;ower the Low of previous Red Bars is Sell Signal. Entry Sell (Short) and place Stop at 1 tick higher the High of previous bar.
Do not Entry if Green Bars or Red Bars completed 5 bars continuously.

The Zone Trades v1.0The Zone v.1.0
The Zone is mention in New Trading Dimensions by Bill Williams,PhD. The Zone is used for Entry Signal of Both Long and Short side.
Green Zone are painting Green Bars when Awesome Oscillator (AO) and Accelerater/Decelerator (AC) are both increasing.
Red Zone are painting Red Bars when Awesome Oscillator (AO) and Accelerater/Decelerator (AC) are both decreasing.
Gray Zone are painting Gray Bars AO and AC in difference changing. Gray Zone are indicate the indecision between bulls and bears.
Bill Williams, PhD. mention that Green Zone or Red Zone usually happen 6-8 bars Continuously.
The First Bar that change to be Green or Red color is the Signal Bar.
Entry Signal is the second bar in the same color as the Signal bar happen with Volume
Price go higher the high of previous Green Bar is Buy Signal. Entry Buy (Long) and place Stop at 1 tick lower the Low of previous bar.
Price go ;ower the Low of previous Red Bars is Sell Signal. Entry Sell (Short) and place Stop at 1 tick higher the High of previous bar.
Do not Entry if Green Bars or Red Bars completed 5 bars continuously.

WVADThe Williams Variable Accumulation Distribution (WVAD), developed by Larry Williams, is a volume-weighted price momentum indicator. It measures the buying and selling pressure by calculating the relationship between the number of points the market has moved from the open to close relative to the period’s entire range.

WVADWilliam’s Variable Accumulation Distribution
The Williams Variable Accumulation Distribution (WVAD), developed by Larry Williams, is a volume-weighted price momentum indicator. It measures the buying and selling pressure by calculating the relationship between the number of points the market has moved from the open to close relative to the period’s entire range.

CM ATR PercentileRankCM ATR PercentileRank - Great For Showing Market Bottoms.
When Increased Volatility to the Downside Reaches Extreme Levels it’s Usually a Sign of a Market Bottom.
This Indicator Takes the ATR and uses a different LookBack Period to calculate the Percentile Rank of ATR Which is a Great Way To Calculate Volatility
Be Careful Of Using w/ Market Tops. Not As Reliable.
***Ability to Control ATR Period and set PercentileRank to Different Lookback Period
***Ability to Plot Histogram Just Showing Percentiles or Histogram Based on Up/Down Close
Fuchsia Lines = Greater Than 90th Percentile of Volatility based on ATR and LookBack Period.
Red Lines = Warning — 80-90th Percentile
Orange Lines = 70-80th Percentile
Other Useful Indicators
Williams Vix Fix
CM_RSI EMA Is a Great Filter for Williams Vix Fix
