Moving VWAP-KAMA CloudMoving VWAP-KAMA Cloud
Overview
The Moving VWAP-KAMA Cloud is a high-conviction trend filter designed to solve a major problem with standard indicators: Noise. By combining a smoothed Volume Weighted Average Price (MVWAP) with Kaufman’s Adaptive Moving Average (KAMA), this indicator creates a "Value Zone" that identifies the true structural trend while ignoring choppy price action.
Unlike brittle lines that break constantly, this cloud is "slow" by design—making it exceptionally powerful for spotting genuine trend reversals and filtering out fakeouts.
How It Works
This script uses a unique "Double Smoothing" architecture:
The Anchor (MVWAP): We take the standard VWAP and smooth it with a 30-period EMA. This represents the "Fair Value" baseline where volume has supported price over time.
The Filter (KAMA): We apply Kaufman's Adaptive Moving Average to the already smoothed MVWAP. KAMA is unique because it flattens out during low-volatility (choppy) periods and speeds up during high-momentum trends.
The Cloud:
Green/Teal Cloud: Bullish Structure (MVWAP > KAMA)
Purple Cloud: Bearish Structure (MVWAP < KAMA)
🔥 The "Reversal Slingshot" Strategy
Backtests reveal a powerful behavior during major trend changes, particularly after long bear markets:
The Resistance Phase: During a long-term downtrend, price will repeatedly rally into the Purple Cloud and get rejected. The flattened KAMA line acts as a "concrete ceiling," keeping the bearish trend intact.
The Breakout & Flip: When price finally breaks above the cloud with conviction, and the cloud flips Green, it signals a structural regime change.
The "Slingshot" Retest: Often, immediately after this flip, price will drop back into the top of the cloud. This is the "Slingshot" moment. The old resistance becomes new, hardened support.
The Rally: From this support bounce, stocks often launch into a sustained, multi-month bull run. This setup has been observed repeatedly at the bottom of major corrections.
How to Use This Indicator
1. Dynamic Support & Resistance
The KAMA Wall: When price retraces into the cloud, the KAMA line often flattens out, acting as a hard "floor" or "wall." A break of this wall usually signals a genuine trend change, not just a stop hunt.
2. Trend Confirmation (Regime Filter)
Bullish Regime: If price is holding above the cloud, only look for Long setups.
Bearish Regime: If price is holding below the cloud, only look for Short setups.
No-Trade Zone: If price is stuck inside the cloud, the market is traversing fair value. Stand aside until a clear winner emerges.
3. Multi-Timeframe Versatility
While designed for trend confirmation on higher timeframes (4H, Daily), this indicator adapts beautifully to lower timeframes (5m, 15m) for intraday scalping.
On Lower Timeframes: The cloud reacts much faster, acting as a dynamic "VWAP Band" that helps intraday traders stay on the right side of momentum during the session.
Settings
Moving VWAP Period (30): The lookback period for the base VWAP smoothing.
KAMA Settings (10, 10, 30): Controls the sensitivity of the adaptive filter.
Cloud Transparency: Adjust to keep your chart clean.
Alerts Included
Price Cross Over/Under MVWAP
Price Cross Over/Under KAMA
Cloud Flip (Bullish/Bearish Trend Change)
Tip for Traders
This is not a signal entry indicator. It is a Trend Conviction tool. Use it to filter your entries from faster indicators (like RSI or MACD). If your fast indicator signals "Buy" but the cloud is Purple, the probability is low. Wait for the Cloud Flip
Pesquisar nos scripts por "vwap"

Simple VWAP + BandsSimple VWAP + Bands
A clean and customizable VWAP (Volume Weighted Average Price) indicator with standard deviation bands and RTH (Regular Trading Hours) session support.
Features:
- VWAP Line: Volume-weighted average price calculation
- Three Standard Deviation Bands: Configurable bands at 1σ, 2σ, and 3σ levels (above and below VWAP)
- RTH Session Support: Option to calculate VWAP only during regular trading hours
- Customizable Session Times: Configure your own trading session hours and timezone
- Clean Visualization: Line breaks between sessions prevent messy connections across non-trading periods
- Toggle Bands: Show/hide individual standard deviation bands as needed
Use Cases:
- Identify overbought/oversold conditions relative to volume-weighted price
- Track price deviation from VWAP during trading sessions
- Support and resistance levels based on standard deviations
- Mean reversion trading strategies

Kalman Based VWAP [EdgeTerminal]Kalman VWAP is a different take on volume-weighted average price (VWAP) indicator where we enhance the results with Kalman filtering and dynamic wave visualization for a more smooth and improved trend identification and volatility analysis.
A little bit about Kalman Filter:
Kalman filtering (also known as linear quadratic estimation) is an algorithm that uses a series of measurements observed over time, including statistical noise and other inaccuracies, to produce estimates of unknown variables that tend to be more accurate than those based on a single measurement, by estimating a joint probability distribution over the variables for each time-step. The filter is constructed as a mean squared error minimiser, but an alternative derivation of the filter is also provided showing how the filter relates to maximum likelihood statistics
This indicator combines:
Volume-Weighted Average Price (VWAP) for institutional price levels
Kalman filtering for noise reduction and trend smoothing
Dynamic wave visualization for volatility zones
This creates a robust indicator that helps traders identify trends, support/resistance zones, and potential reversal points with high precision.
What makes this even more special is the fact that we use open price as a data source instead of usual close price. This allows you to tune the indicator more accurately when back testing it and generally get results that are closer to real time market data.
The math:
In case if you're interested in the math of this indicator, the indicator employs a state-space Kalman filter model:
State Equation: x_t = x_{t-1} + w_t
Measurement Equation: z_t = x_t + v_t
x_t is the filtered VWAP state
w_t is process noise ~ N(0, Q)
v_t is measurement noise ~ N(0, R)
z_t is the traditional VWAP measurement
The Kalman filter recursively updates through:
Prediction: x̂_t|t-1 = x̂_{t-1}
Update: x̂_t = x̂_t|t-1 + K_t(z_t - x̂_t|t-1)
Where K_t is the Kalman gain, optimally balancing between prediction and measurement.
Input Parameters
Measurement Noise: Controls signal smoothing (0.0001 to 1.0)
Process Noise: Adjusts trend responsiveness (0.0001 to 1.0)
Wave Size: Multiplier for volatility bands (0.1 to 5.0)
Trend Lookback: Period for trend determination (1 to 100)
Bull/Bear Colors: Customizable color schemes
Application:
I recommend using this along other indicators. This is best used for assets that don't have a close time, such as BTC but can be used with anything as long as the data is there.
With default settings, this works better for swing trades but you can adjust it for day trading as well, by adjusting the lookback and also process noise.

VWAP SpiderThe VWAP Spider indicator enhances the conventional Volume Weighted Average Price (VWAP) analysis by anchoring it to the first candle and incorporating an extensive series of standard deviation (SD) lines, extending up to +8 SDs with additional half-step increments. This configuration provides a more suitable set of lines for identifying support and resistance, distinguishing it from existing VWAP and SD indicators. Its design, featuring color gradients for fills and distinct labels for each line, aims to improve the utility and user experience.
Optimal Timeframes:
It is recommended for use on weekly or monthly resolutions to ensure all price and volume history is included.
Distinctive Features:
The indicator includes a more extensive array of SD lines than typically found in VWAP indicators, enhancing the depth of market analysis.
The visual presentation is optimized with color gradients and clear labeling, facilitating ease of use and integration into trading strategies.
Practical Use of the VWAP Spider:
SD Lines as Support and Resistance : Observe the interactions between the price and the SD lines closely. These can serve as dynamic support and resistance indicators, influencing trading decisions.
Analyzing Historical Price Action : Investigate how the price has historically interacted with the SD lines. Identify which lines have frequently acted as support and resistance in the past, as they will often continue to be revisited.
Strategic Application : Leverage insights from the interactions between price and SD lines to fine-tune entry and exit points. For example, a rebound from an SD line may suggest a strong entry point, while breaching an SD line could indicate a potential exit.
This indicator is freely available and open-source on TradingView for all. It is designed to help traders enhance their market analysis and strategic decision-making.

VWAP Oscillator (Normalised)Thanks:
Thanks to upslidedown for his VWAP Oscillator that served as the inspiration for this normalised version.
Core Aspects:
The script calculates the VWAP by considering both volume and price data, offering a comprehensive view of market activity.
Uses an adaptive normalization function to balance the data, ensuring that the VWAP reflects current market conditions accurately.
The oscillator includes customizable settings such as VWAP source, lookback period, and buffer percentage.
Provides a clear visual representation of market trends.
Usage Summary:
Detect divergences between price and oscillator for potential trend reversals.
Assess market momentum with oscillator’s position relative to the zero line.
Identify overbought and oversold conditions to anticipate market corrections.
Use volume-confirmed signals for enhanced reliability in trend strength assessments.

VWAP angle TrendThe VWAP Angle Trend is an indicator built with the aim of providing valuable insights into the reversal points of the #VWAP using Angle
This is achieved by calculating the angle between the current VWAP and its previous value over a customizable lookback period and normalizing it with ATR
By analyzing the angle, we can gain an understanding of the strength and direction of the VWAP, which can help them identify potential trend reversals or continuations.
After observing the market over a lengthy period, I have come to realize that as the angle increases above 65 or decreases under -65 , it confirms a higher likelihood of a trend reversal.
the indicator highlights these zones where a trend reversal is more likely to occur.
The indicator can help you to assess the strength and direction of VWAP, enabling you to make more informed trading decisions.
By identifying periods of strong momentum or potential exhaustion, you can seek opportunities for entering or exiting positions, and potentially capitalize on trend movements in the market.

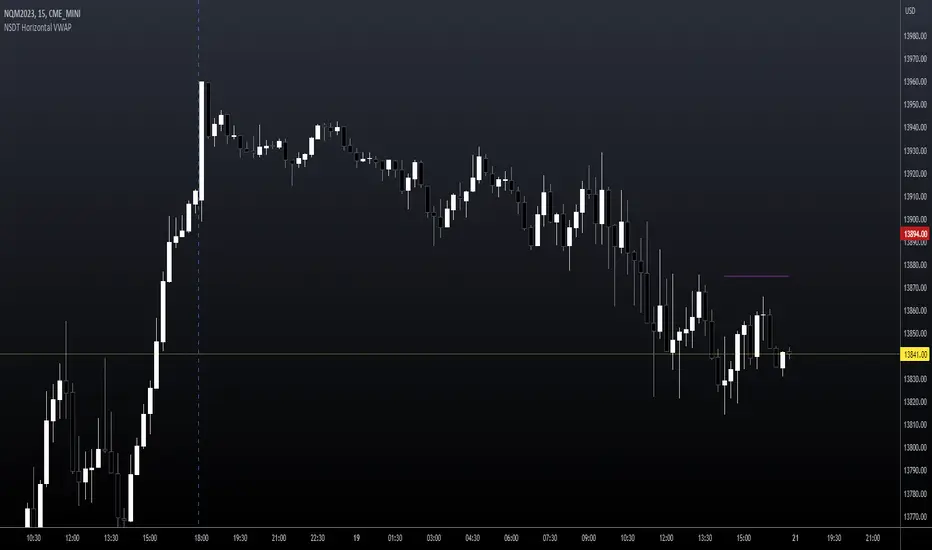
NSDT Horizontal VWAPThis script plots VWAP as a horizontal line starting at the most recent candle and extending backwards for a period of 10 to make it easier to see. (default is 10 but can be changed to fit your needs)
You may only want to see where VWAP is currently and not need to see the entire day. Helps keep the chart clean.
Colors and line settings can all be modified.
You can show the original VWAP plot as well for reference.
What Is the Volume-Weighted Average Price (VWAP)?
The volume-weighted average price (VWAP) is a technical analysis indicator used on intraday charts that resets at the start of every new trading session.
It's a trading benchmark that represents the average price a security has traded at throughout the day, based on both volume and price.
VWAP is important because it provides traders with pricing insight into both the trend and value of a security.
Multi Range VWAP PivotsMulti Range VWAP Pivots turned out to be one of my most accurate pivot indicators to date!
Multi Range VWAP Pivots works by recognizing the high and low of the timeframe selected (D, W, M, 6M, and 12M) and plotting range high to VWAP averages and range low to VWAP averages.
After further examination of each completed range, I came to the conclusion that due to the nature of averages, high and low respectively would need to be completed within the current range, for the averages to actually display pivots correctly. This means that if all averages appear to be "pivoting" correctly after or during a break lower of higher, then we can only assume the most recent break higher or lower could be exhaustion and price will be reverted to the mean (VWAP). OR, this could be the most accurate hindsight indicator on the planet.
*DISCLAIMER*: This indicator repaints. DO NOT backtest or set alerts with this indicator.

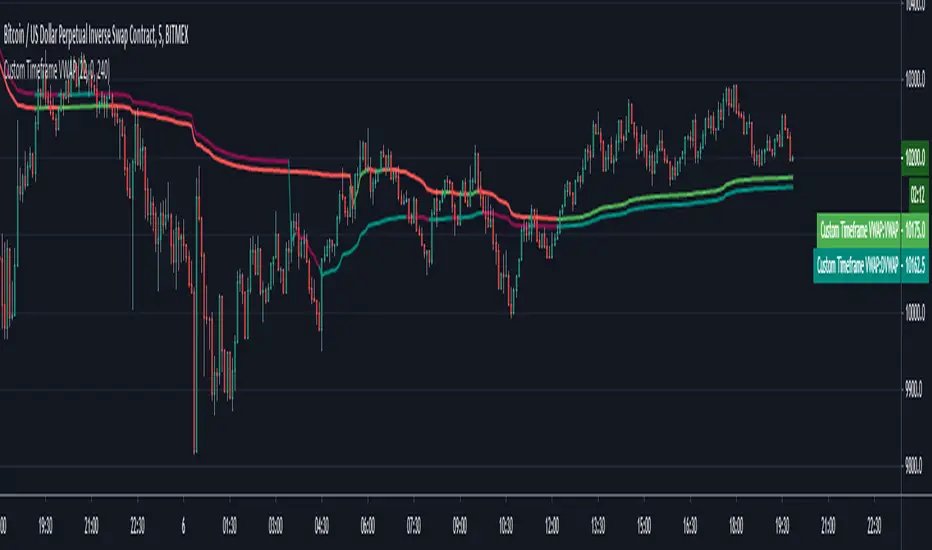
Custom Timeframe VWAPThis script calculates the daily VWAP from any specified starting point intraday. Also colors the VWAP based on whether price is above or below it.
Standard vwap starts at day open 0 GMT, however there are some exchanges for eg. Deribit that have seen they use a different time period to begin VWAP calculations. This is useful in such cases.
You need to specify the hours & minutes of the VWAP that want to use. VWAP will be hidden on any timeframe higher than specified "Highest Visible Timeframe".
Also a big thanks to u/mortdiggiddy as he helped with this script.
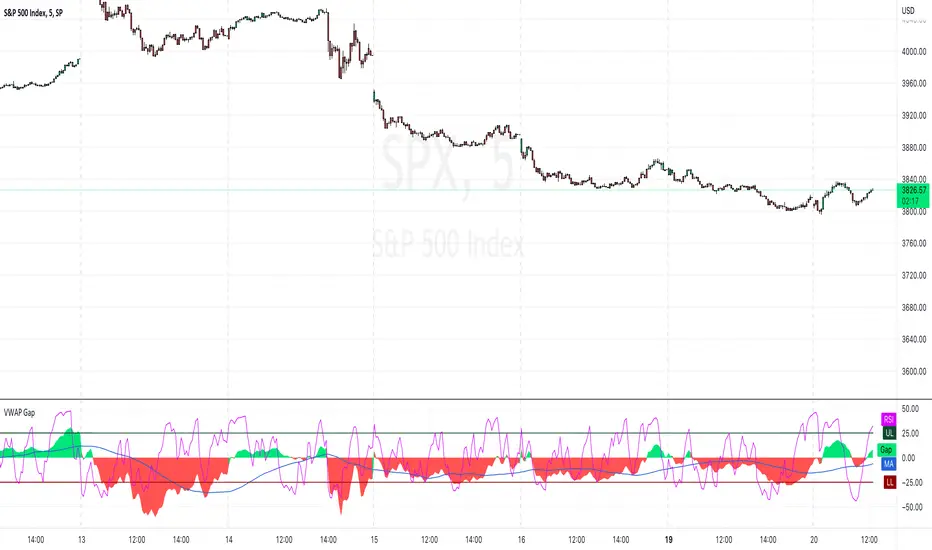
VWAP Gap [AR]This simple indicator measure the difference between price and VWAP line
The VWAP Gap indicator works best on intraday charts
SET-UP INFO
1. Add VWAP to your chart and set it up
2. Open "VWAP Gap Indicator" settings
3. Change source to "VWAP"
Enjoy!
Alex R.
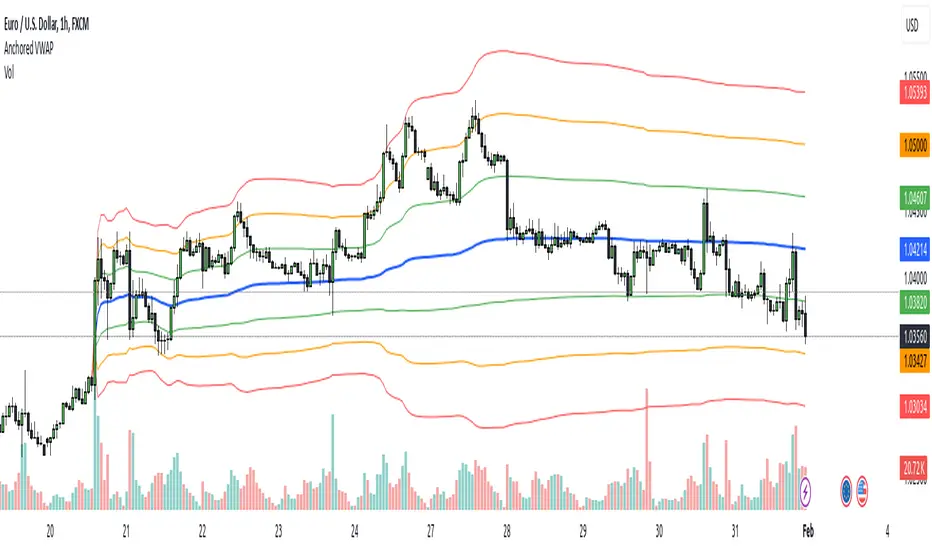
Anchored VWAPAnchored VWAP with 3 Standard Deviation Bands
📈 Version: Pine Script v5
📌 Author: Aymen Haddaji
🔍 Overview
This indicator calculates an Anchored Volume-Weighted Average Price (AVWAP), allowing traders to anchor the VWAP calculation from a user-defined date and time. It also plots three standard deviation bands above and below the AVWAP to help identify potential areas of overbought and oversold conditions.
📊 Features & Functionality
✔ Custom Anchor Point: Select a specific date and time to start the AVWAP calculation.
✔ OHLC/4 Calculation: Uses the average of Open, High, Low, and Close to smooth the price input.
✔ Three Standard Deviation Bands:
1st Deviation (Green): Moderate volatility zone.
2nd Deviation (Orange): High volatility zone.
3rd Deviation (Red): Extreme overbought/oversold areas.
✔ Real-Time Calculation: Updates dynamically with each price movement.
✔ Clear Visuals:
AVWAP (Blue Line) represents the fair market price from the anchor.
Deviation Bands (Dashed Lines) show potential support and resistance levels.
🛠 How It Works
VWAP Calculation
Uses a cumulative sum of price × volume divided by cumulative volume.
Calculation starts from the user-defined anchor time.
Standard Deviation Bands
Measures the price dispersion around the AVWAP.
The wider the bands, the higher the volatility.
When price touches or exceeds the 3rd deviation, a potential reversal zone is indicated.
Trading Strategies with AVWAP & Deviation Bands
Trend Confirmation:
Price above AVWAP = Uptrend (bullish).
Price below AVWAP = Downtrend (bearish).
Support & Resistance:
AVWAP acts as dynamic support or resistance.
1st & 2nd deviations often act as secondary levels.
Mean Reversion Trading:
When price reaches the 3rd standard deviation, a pullback is likely.
Breakout Confirmation:
A strong close above/below the 3rd deviation may indicate trend continuation.
⚙️ Input Settings
📍 Anchor Time: Allows you to set the exact date and time to start the AVWAP calculation.
🎯 Ideal For
✅ Intraday traders looking for short-term mean reversion plays.
✅ Swing traders identifying key support/resistance zones.
✅ Trend traders confirming long-term market direction.
✅ Volatility traders using standard deviation for trade entries.
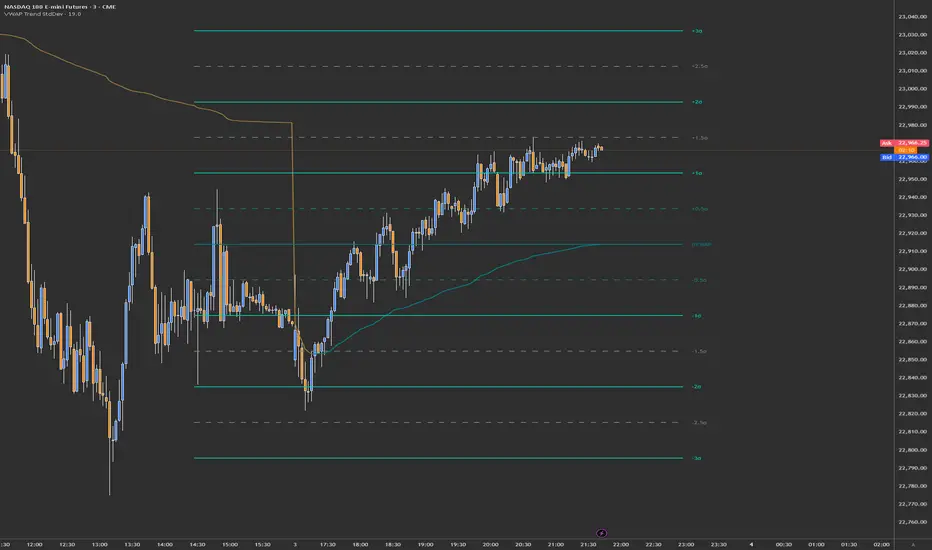
VWAP Trend with Standard Deviation & MidlinesThis indicator is a sophisticated VWAP (Volume Weighted Average Price) tool with multiple features:
Core Functionality:
1. Calculates a primary VWAP line that changes color based on trend direction (green when rising, red when falling)
2. Creates multiple standard deviation bands around the VWAP at customizable distances
3. Resets calculations at either:
- New York session start time (configurable, default 9:30 AM)
- Daily start time
- Can be hidden on daily/weekly/monthly timeframes if desired
Band Structure:
- Band 1 (innermost): ±1 standard deviation
- Band 2 (middle): ±2 standard deviations
- Band 3 (outermost): ±3 standard deviations
- Midlines at 0.5σ intervals between bands
- All bands can be individually enabled/disabled
Customization Options:
1. Band calculation modes:
- Standard Deviation based
- Percentage based
2. Visual settings:
- Customizable colors for all elements
- Adjustable line widths
- Optional labels with configurable size
- Optional extension lines
- Label position adjustment
3. Source data selection (default: HLC3 - High, Low, Close average)
Common Uses:
- Identifying potential support/resistance levels
- Measuring price volatility
- Spotting mean reversion opportunities
- Trading range analysis
- Trend direction confirmation
The indicator essentially creates a dynamic support/resistance structure that adapts to market volatility and volume, making it useful for both intraday and swing trading strategies.
MTF VWAPThis indicator is an enhanced version of the traditional VWAP, providing traders with multiple timeframe views, automatic session anchoring, and customization options for optimized technical analysis.
Key Features:
1. Multiple Timeframes, One View : Visualize Daily, Weekly, Monthly, and Yearly VWAP calculations simultaneously on a single chart.
2. Automatic Anchoring : The indicator intelligently auto-anchors each VWAP calculation to the start of its respective session. This ensures accurate readings and streamlines your analysis by eliminating the need for manual adjustments.
3. Customizability : Tailor the appearance of the indicator with fully customizable colors and the ability to select your preferred price source (e.g., high, low, close, hlc3, hlcc4, or a custom one).

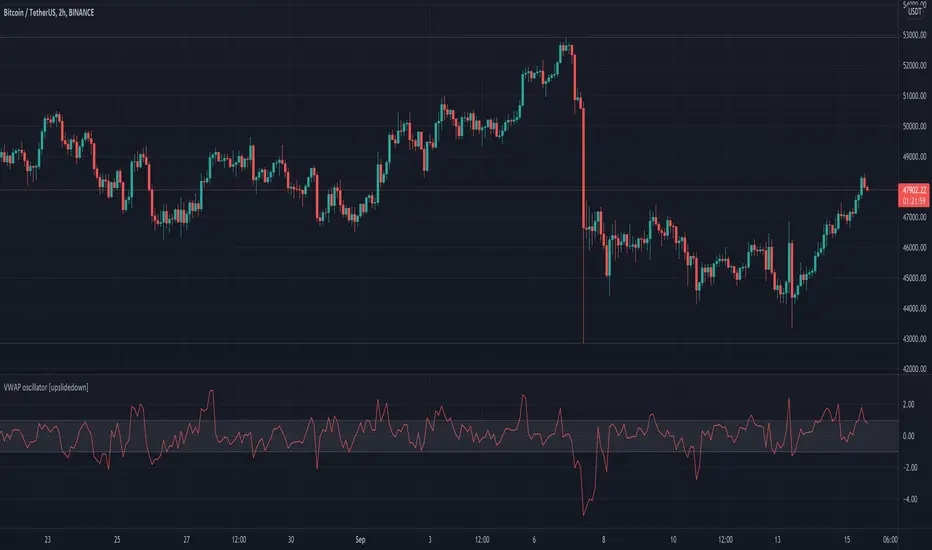
VWAP oscillator [upslidedown]This VWAP oscillator showcases the percent difference between VWAP and current price within an oscillator centered on 0. My thesis for this indicator is that trend following within the threshold zone (defaulted to 1%) would be "choppy" but outside is a significant trend. Another way to think about VWAP is potential for taking profits, as price will always be magnetized back to the center.
I find this sort of visualization very helpful when creating strategies that revolve around a filter such as VWAP and wasn't able to find anything that was close and/or provided this sort of visualization publicly. Enjoy and let me know if you find this useful or can dream up an improvement.
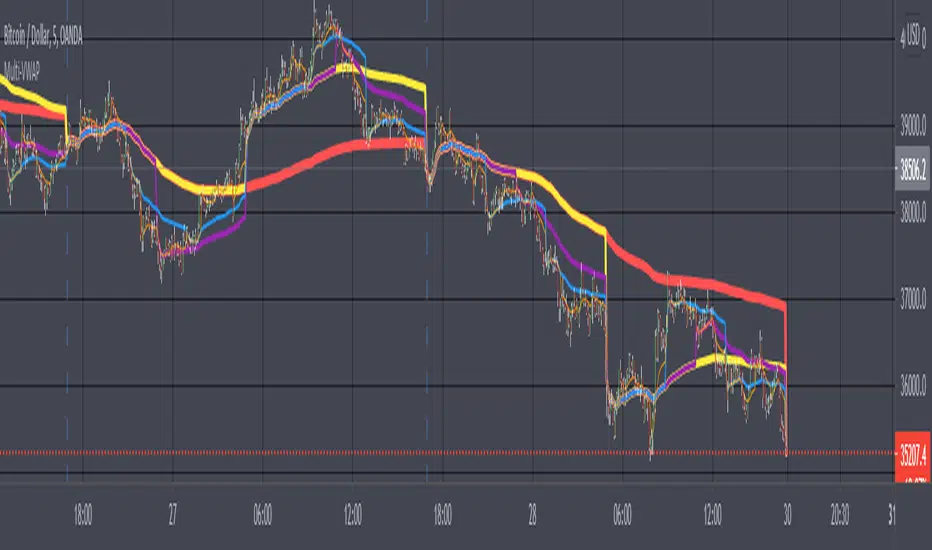
Multi-VWAPVolume Weighted Average Price (VWAP) Definition
What is the Volume Weighted Average Price (VWAP)?
The volume weighted average price (VWAP) is a trading benchmark used by traders that gives the average price a security has traded at throughout the day,
based on both volume and price. It is important because it provides traders with insight into both the trend and value of a security.
-Investopedia By JASON FERNANDO Reviewed by SOMER ANDERSON Updated Feb 24, 2021
-Choose from 5 different Timeframes (lower or higher)

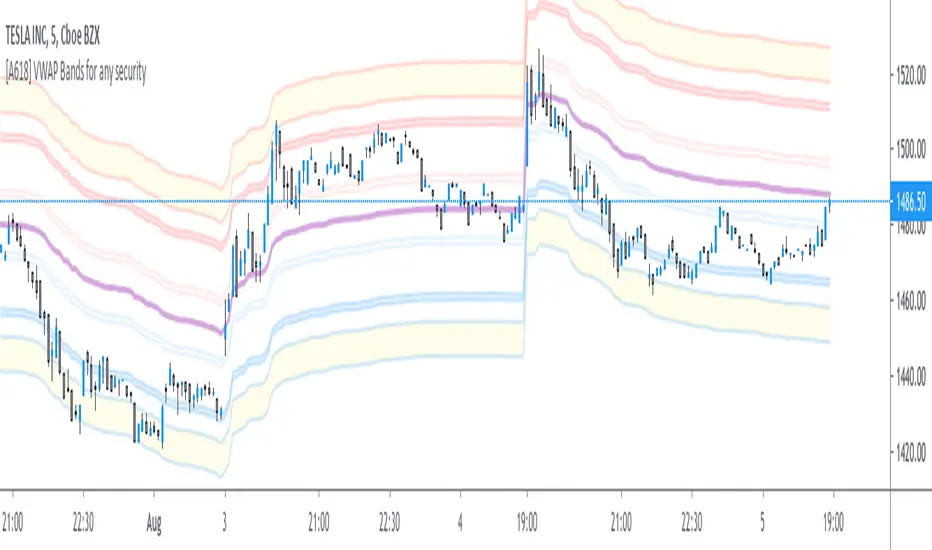
[A618] VWAP bands for any SecurityThe Script plots Standard Deviation Bands around The VWAP line,
This will help you out with detecting market overbought and oversold Conditions on the Fly
Use this in conjunction with an oscillator
- stoch, macd, etc...
- if you find a positive crossover with oscillator on a VWAP level its time to go long, targeting the next vwap level and vice-versa
VWAP/MVWAP/EMA CROSSOVEROnly difference in this one is that a EMA is used which should give quicker signals but theres a chance for more false signals as per usual use TA and other indicators to confirm positions. So far I've been liking the Vortex Indicator
When the VWAP (Thick Yellow) AND the two EMA (Orange and thin Yellow) cross above the MVWAP (Purple) then you will be in a uptrend that could possibly continue upwards. The opposite is true if you are looking a short opportunity, wait for the three other lines to cross under the MVWAP and you should be in a downtrend that could possibly continue downwards
Of course as with all indicators not every signal will be 100% accurate there is no way to predict human emotions when it comes to trading but based on the VWAP strategy used in other markets this is the closest I could get.
Note: Don't relay completely on this indicator to think for you. Use other forms of TA to confirm all positions before entering. And if the candles start trending the opposite direction after a lets say a mini pump/dump then the signal was false.
Finally this was made according to the 15 minute chart. I did not plan on remaking it for any other timeframes as I have left the code open for you to tweak and the setting are free to adjust aswell.
Q/A
Q: Does it repaint?
A: No, this is based on moving averages as far as I know they don't repaint.
Q: How did you come up with this indicator?
A: Went on youtube looking for trading strategies other and the usual EMA crosses and found a VWAP & EMA strat. I added the MVWAP and played with the numbers until I found something that I liked.
Q: How long have you been trading/learning pinescript?
A: Been trading less than a two months and pinescript about a month and a half.

Weekly VWAP - Starts Monday 12AMThere are a number of VWAP indicators out there, but it's difficult to find VWAP calculations that take the entire week into account. This helps with analyzing longer-term trends on daily and intraday charts. As with all VWAP indicators, this one is also more sensitive to price starting at the open of trading at the beginning of the week.

VWAP Bands - MultiTF and anchoredThe script has traditional VWAP for two different timeframes along with an option to anchor them to a particular bar. VWAP bands are also included in the script. The bands and VWAP act as hidden support/resistance for the scrip and are useful for intraday trading.

VWAP it GOODWhy: Instead of having 5 individual VWAP indicators, I found it beneficial for one view with a clean display. This VWAP indicator combines the daily, weekly, monthly, quarterly and annual into one color coded view. These colors and styles can be modified by the user.
A user can turn any timeframe off, but this is how I personally like to trade since it helps me better understand potential bounce or pullback areas.
Do your own research for what is best for you.

VWAP filtered MACD Bars with positive MACD histogram value and closing above VWAP are colored, long positions should be taken in areas made of those bars.
Similarly, bars with negative MACD histogram value and closing below VWAP are also colored, short positions should be taken there.
This indicator by default should be a part of your trend following trading system.
In the setting you can change colors
Above grow: positive and rising MACD histogram value
Above fall: positive and falling MACD histogram value
Below fall: negative and falling MACD histogram value
Below grow: negative and rising MACD histogram value
Automated Anchored VWAPThis was reasonably easy to put together and I can't find one that does this in the Library and I've been wanting one. Of course, the drawing tool is just fantastic, but sometimes it can be forgotten as new pivots emerge.
What you'll find elsewhere in the Library is a nice variety of fancier methods for determining an anchor point with labels, lines, timestamps and standard deviations.
This is just a simple script to pull the Anchored VWAP off of the most recent pivot and update that as new pivots become defined.
I wanted it to be really portable so it could easily work into other things you're working on while also keeping the chart reasonably clean.
The way this functions is as follows: A new pivot is found and VWAP is calculated from it. At that point the prior aVWAP is no longer tracked and it picks up from the new pivot .
Of course this means that the plot doesn't generate until the pivot is actually confirmed, which in turn means that the plot doesn't reach back to the pivot , it begins based on whatever "right bars" period you end up choosing.
I kind of like it that way, because you have your eyes on the one that matters until the new one matters.
The downside is that it doesn't track old pivots . The old aVWAP might still be in play. But if you track all of the old one's you'll have a 100 lines on your chart and no one wants that.
I recommend when you look back and think the old one is still in play, use the drawing tool to keep it on the chart.
Otherwise, let the script do the work for you.
Hope its helpful. Let me know what you think should be done to make it better.
