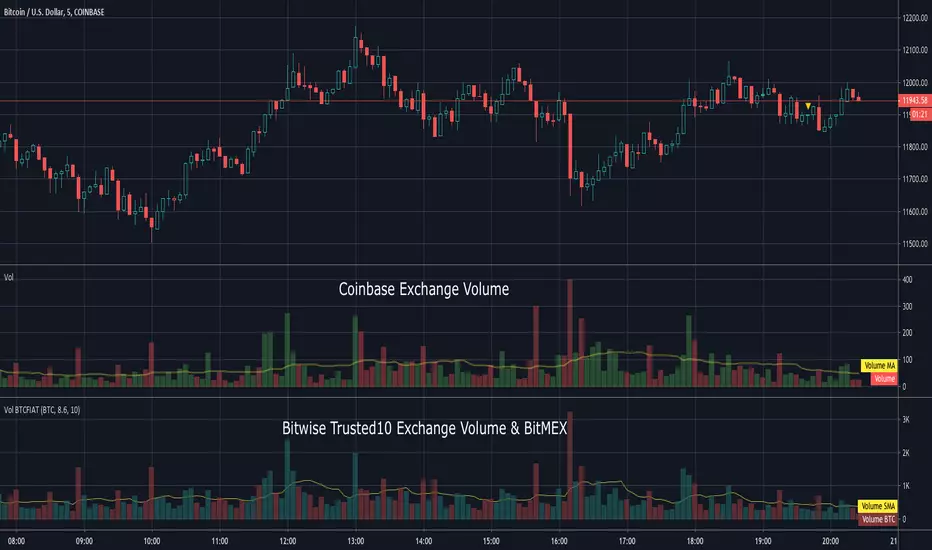
Volume BTCFIATThis indicator shows the aggregated volume of BTCFIAT of the Bitwise "Trusted 10" Exchanges that are available on TradingView.
I did not include every currency or stable coin available on these exchanges due to some being inconsequential in volume .
I also included option to show BitMEX deleveraged amount. Recent report suggests average leverage used there is 8.6X.
Volume can be shown in BTC or USD amounts. The moving average can be adjusted and if set to 0 will hide it.
Due to the number of lookups please be patient while loading. It will take a moment to display.
To load search Indicators for "Volume BTCFIAT" and click to load.
This indicator does not require access from me.
Pesquisar nos scripts por "volume"
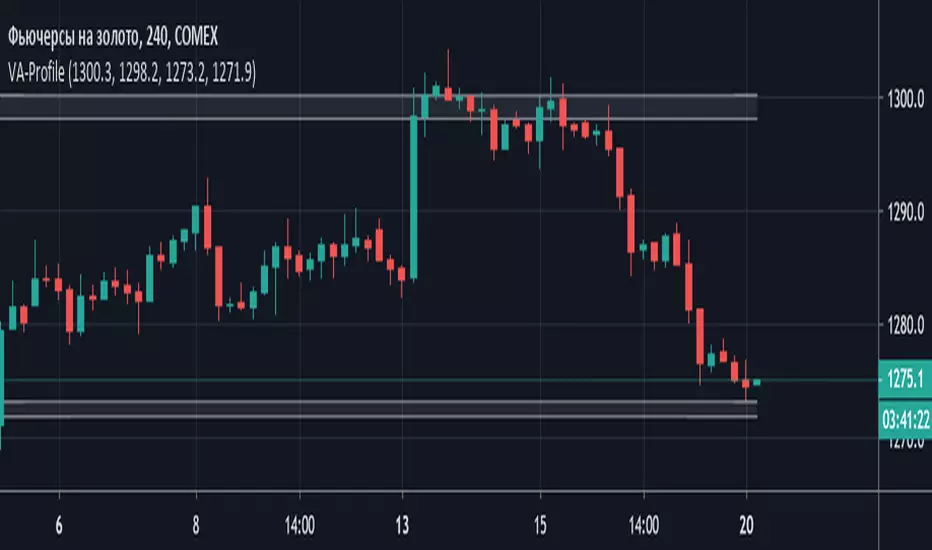
Volume Area Profile (Индикатор горизонтальных объемов)Volume Area Profile (Индикатор горизонтальных объемов)
Данные введены для графика GC!- Futures Gold - Дата: 20 мая 2019
Индикатор интегрирует данные полученные Вами после анализа кластерного графика объемов цены и строит зоны профиля объемных уровней поддержки и сопротивления
Необходимо отредактировать входные параметры:
Resistance_max - верхняя граница зоны сопротивления
Resistance_min - нижняя граница зоны сопротивления
Support_max - верхняя граница зоны поддержки
Support_min - нижняя граница зоны поддержки
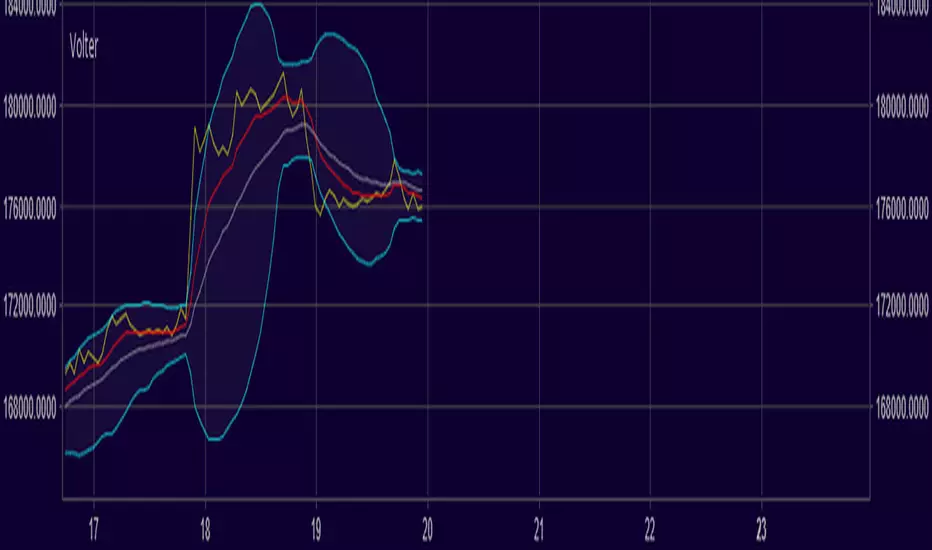
Volume Weighted Price Over A Moving 60 Bar Window// By S.Black
// 4/24/2019
// Pine on TradingView.com
//
// This plot takes a simple 60 bar window
// For each bar in the window 3 things are plotted:
// 1.) The volume-weighted average, each bar's volumne * price summed, then divided by total volume
// 2.) The simple 60 bar average (not weighted)
// 3.) The close price (for reference)
//
// Green is used when the weighted price is above the average
// This is meant to indicate that actually, by volume the stock may be worth more that it is currently trading at.
// I made a new script was because I didn't see one that had a rolling hour window.


Volume/$ - Color Trend BarsThis is the volume script I use on all my charts. The idea is to emphasize trend bars with green and red.
Highish volume doji bars are colored yellow to point out range compression churn areas which can often be the turning point of a trend.


Volume Weighted MomentumVolume Weighted Momentum
Similar to the awesome oscilator but uses volume weighted averages instead of simple moving averages. This should help to build a more accurate picture over the AO version

Volume Based S/RI got a question if it would be possible to Automatically draw S/R levels based on Volume rather than RSI as I had earlier done in this script;
Well it certainly is and it looks as though it might even be tradeable.
The indicator compares the size of volume bars so that if there is a noticeable increase in volume (noticeable here meaning above the indicator threshold) it marks the bar high and low prior to the bigger volume candle.

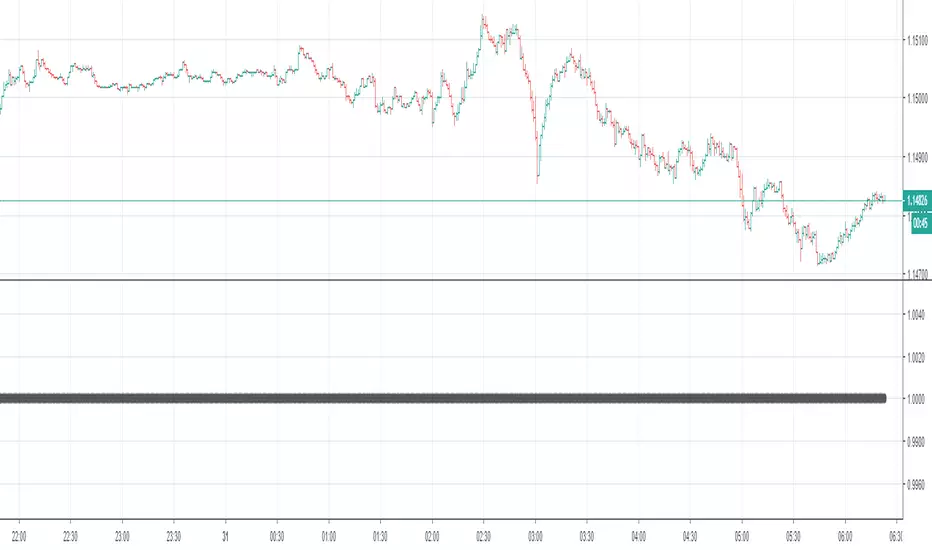
Volume Warning, Wyckoff Trend Tracking Trading SystemVolume Warning by Wyckoff Trend Tracking Trading System
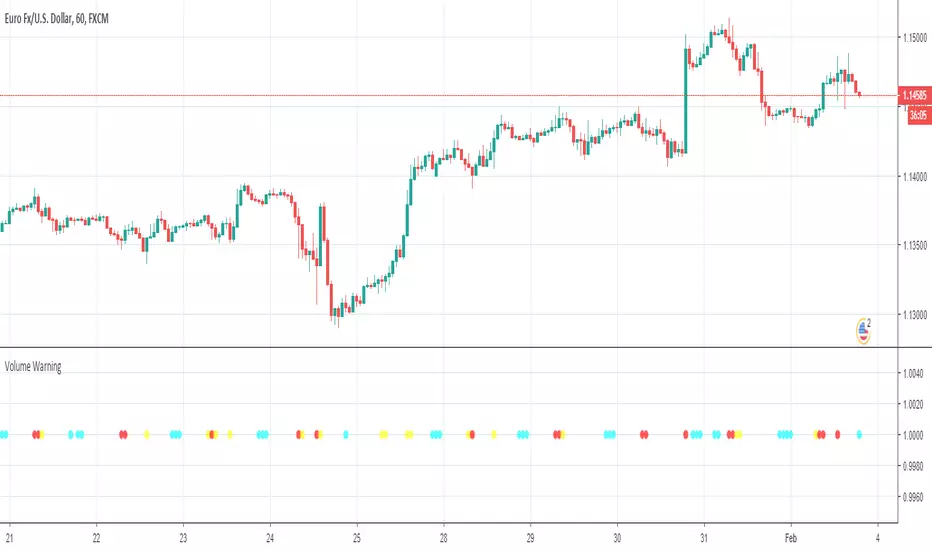
Volume Warning, Wyckoff Trend Tracking Trading SystemVolume Warning by Wyckoff Trend Tracking Trading System
BTC Dollar VolumeVolume conversion indicator for coins traded to USD value. Does not work on exchanges with dollar volume already displayed. Will be updated with new features.

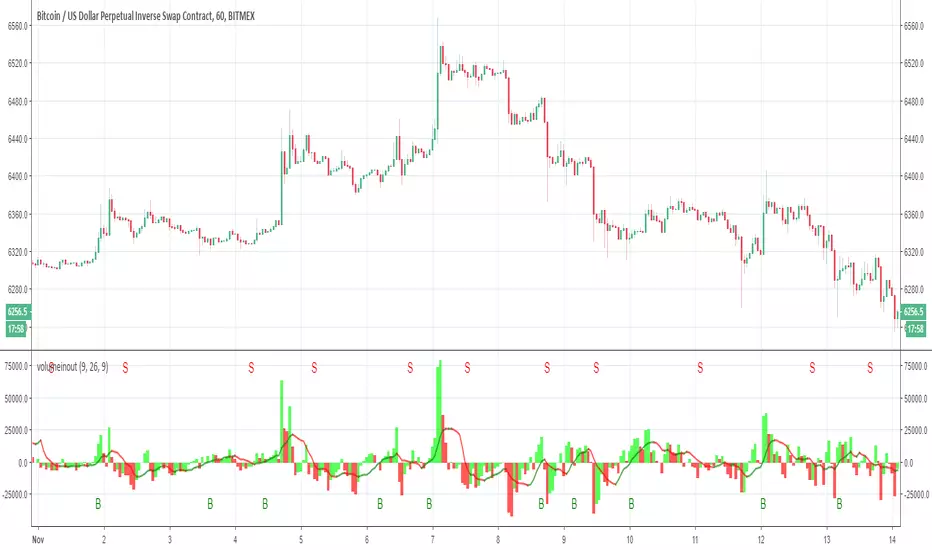
Volume in out as MACD with alerts Lets make the Volume in out as MACD
with alerts (B =buy) S=sell
have fun
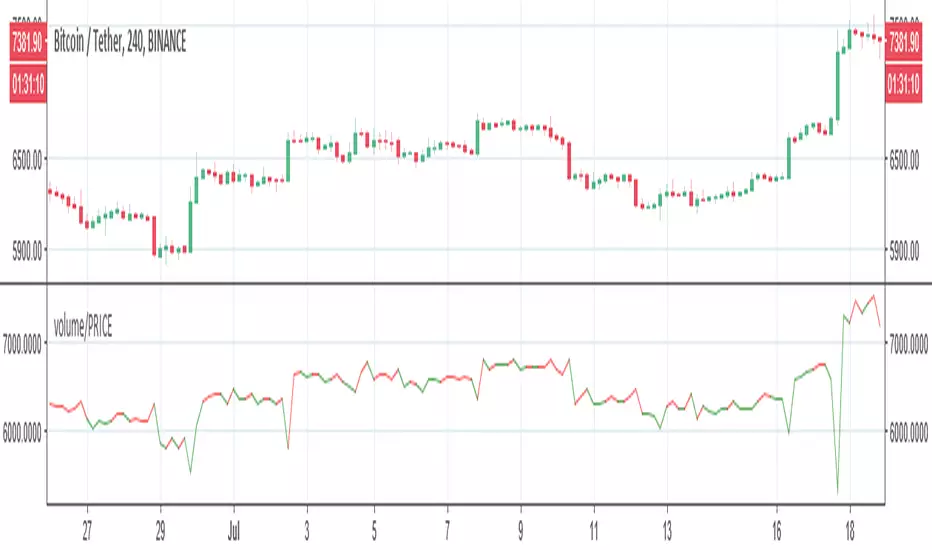
Volume for price rangeWe divided the volume by the difference between the high price and the low price of the day.

Volume + Ema CrossoverIf Volume crossover its ema, we can consider it as a volume pump.
It may be useful for combining with other indicators.

Volume + Margin Toolkit (Longs & Shorts)-predicts volume on current bar based on how long is left in the bar
-shows how much volume is spent on margin positions
-shows how much buy & sell volume on margin positions
-shows volume in fiat value
-normalized view shows percent of volume spent on margin
-sma
-enter the security name for shorts & longs data, by default it is set to BITFINEX:BTCUSDLONGS and BTCUSDSHORTS.

Price-Volume by ClefsphereVolume is a key piece of the puzzle when analyzing stock performance!
Price-Volume script measures Buying Pressure and Selling Pressure and creates Bullish signals based on that information.
A trailing stop can be specified. Of course the dilemma of stops is that adjusting to tighter stop may result in more stop outs, less profits. Whereas, looser stop may result in larger drawdowns, larger profits.
Coded as a strategy so it can be back-tested.
Long signal is show in green at the bottom and is also shown in Strategy signals.
Coded with latest PineScript version 3. Get This Indicator Today! marketcast.wordpress.com
Thanks for your interest and support!
Disclaimer: This information is not trading advice and is for educational purposes only. Trade at your own risk. Past performance is not a guarantee of future results.


Volume-rsi-wmaThis indicatr give all the best on Volume study
RSI Volume (blue line)
vWMA (black line)
and V volume
MA volume (in bars)
have fun

Volume/Pricethis is simple volume indicator by price
see the following trend- when the candle is red there is spike in volume before the rise up and next green candle. the indicator will deflect down with green -the stronger the volume the stronger the down deflection, the next bar will be green and strong up.
with down it will be opposite
Volume w/ Threshold and Editable MA PeriodJust a simple script that tweaks the original Volume one.
The purpose is creating a threshold which we'll use to put an alert on. This way, we can be notified whether Volume pumps.
Useful for spotting breakouts, breakdowns and pumps.
Threshold is simply a coeff * ma(volume,period). Coeff is editable as well.
Hope this helps!

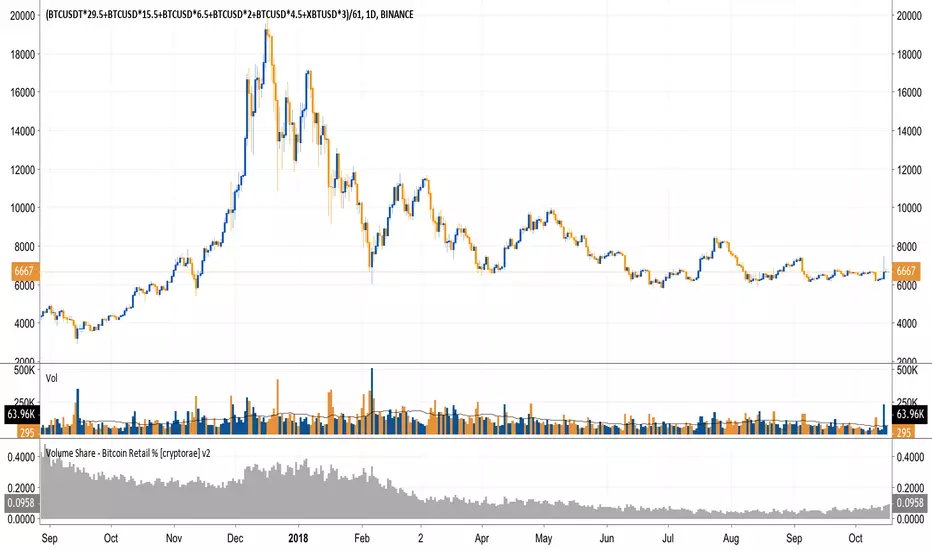
Volume Share - Bitcoin Retail % [cryptorae]I've been keeping my eyes on retail BTC trading volume as a % of total BTC trading volume (charted).
It's the single best chart showing the death of sentiment in this bear market. Retail fell to as low as 5.6% on 6/8. The good news is that the % has stabilized at these levels.
I think retail interest will need to trend higher in tandem with higher price moves for us to break through key resistance levels.
To know why, let's look closer at the anatomy of the recent bull and bear market.
In the 2017 bull market:
- Retail interest trended higher or sideways with each drive up
- Average retail volume share was ~46%
In other words, price movements were dominated by infusions of new money.
In the 2018 bear market:
- Retail interest trended LOWER with each recovery in price
- Average retail volume share was ~15%
In other words, price movements were dominated by money exchanging through the hands of traders.
Open thoughts:
- If the bear market persists and prices reach critical levels, I think that retail % would spike as some finally rush for the exit and new investors happily jump in
- If prices recover w/o a sustained increase in retail %, I'd not be so quick to call a bull market
Things I classify as "retail":
- Bitflyer
- Bithumb
- Coinbase
- Bistamp
- Kraken
Things classified as "non-retail"
- Bitmex
- Bitfinex
The formula is retail / (retail + non-retail)
The script is open for you to modify if you disagree. Let me know your thoughts/tweaks.
Volume ComparisonThis script allows for the comparison of current volume to the past 10 days of volume at the same time of day. Currently the only time frame options available are 15m and 30m. The bar coloring is related to if the volume is > the avg_vol and the close is > or < the previous close.
FYI because volume data trickles in over time and the bar coloring relies on close data this will operate on a 1 bar delay.
Still an interesting study that I will probably add more features to in the future.
Currently it only works on assets that are only traded during normal hours (stocks, futures , etc. NOT crypto, but if I get some interest I may add crypto in the future).
Thanks all for your support!
Much Love
xoxo
-Snoop
