SAMURAI SWORDSamurai Sword is an add on tool for Ninja Scalper and the next evolution of the Trend Trade Indicator.
It auto plots the fib retracement to speed up target acquisition support and resistance areas based on the formula to increase the success rate of trade entry and exits.
None of this is to be taken as investment advice but rather Edutainment and infotainment
#TradeSocially
Pesquisar nos scripts por "trend"

NINJA SCALPERNinja Scalper is the next evolution of the Trade Trend Indicator.
I have been trading for over 23 years now and these indicators are based on my trading style risk verse reward. The change in this is to make it more responsive and to integrate with Sword.
The background of this indicator is:
The original Trade Trend Indicator (indicator) has been the brain child of 23 years of trading experience rolled into a simple to understand all market setup alert system based solely on 5 high probability trade set ups with a 6th high risk. The hope is to provide something that is can assist traders in building confidence in their trades with a little assistance from the indicator.
This like any and all indicators is not a be all and end to trading, yes while back tested the indicator has produced fantastic profitable results; past performance is not a guarantee of future but which with human intervention can increase the return result exponentially.
You need to be able to chart simple candle sticks and you need to have an understanding of support and resistance areas to make sense of what you are doing in trading otherwise even this indicator won't help you.
While this may alert buy or sell / long or short entrance these are to be taken as educational points of reference and if you wish to trade you are understanding that you enter and exit at your own risk. Not many indicators will alert you to the possibility of a rogue wave spike / dump or both, this will but everything is perspective of the time frame you are on.
The indicator is designed for the 4hour time frame with trade entry on the 15min and managed on the 30min time frame. Alot can happen within these time frame but as we know not every trader can sit in front of a screen for hours at a time and this let's one trade for swings. Once you have your entry you place your exits and you set your stops. If you wait for the alert to exit you are in a draw down this should never reach that point pay yourself for being right.
The some set ups are simple:
1. Trend change from bearish to bullish buys are dip interim support entries.
2. Trend change from bullish to bearish sells are top interim resistance exits.
3. Blue buy is an entry position for a trade.
4. Blue long is an add position for a trade.
5. Red short is just that a short trade idea. (this is advanced and requires a manual cover target),
6. Green buy is a break out over the next candle to print above (highest risk)
All trades are based on a 5% to 10% of capital entry with no more than 40% ever in 1 trade goal is many consistent trade wins while limiting the losses and size.
Certain set ups such as longs over the Moving Averages but below the cloud can lead to strong rally returns as well as short in a bearish trend just above the Moving Averages can give prolonged selling pressure.
Pay attention to the golden dump line as it rises the closer to the candle it gets the higher the risk of the trade lacking continuation.
None of this is to be taken as investment advice but rather Edutainment and infotainment
#TradeSocially
Keltner Channels 5m Bithanos(灭霸比特币2847198141)"enter L" means enter long
"enter S" means enter short
"close enter L" means close enter long order
"close enter S" means close enter short order
This is Keltner Channels strategy,
when the price crossover the upper line ,may be there is new up trend.
when the price crossunder the lower line ,may be there is new down trend.
you can set the middle line to be the stop loss level .
just for bitcoin 5m.
"enter L" means 看多
"enter S" means 看空
"close enter L" 停止看多
"close enter S" 停止看空
这是肯塔特通道的变种策略
当价格上穿上轨时候,也许新的上涨趋势即将出现。
当价格下穿下轨时候,也许新的下跌趋势即将出现。
你可以将中轨设置为止损位置。
仅适用于比特币5分钟级别。

I Like Winners And Hate Loosers!This simple long only strategy aims to be in trending markets, maximizing win/loss ratio and keep drawdown low (at the expense of net profit).

Global Indices Weekly Investment StrategyThis strategy aims to provide the optimal times to buy/sell assets on a long term basis. From my testing it works best on a weekly or monthly time frame. The default values are currently set to work best on Global Indices such as the S&P 500. It is very simple in its core, it uses price historical price action to estimate where in a market cycle the asset is. Then combined with a basic Moving-Average-like baseline and long term trend oscillator to gauge direction, it attempts to find the best time to buy/sell an asset to reduce capital draw-down and maximise future profits.
Returns here are based on an account balance and trade sizes of £100,000 with no compounding. Does not take into account exchange fees - 0% commission.
Please let me know if you have found any optimal settings for a given market using this strategy; such as all commodities. Or if you have any suggestions on how the strategy could be improved in general.

Strategy to accumulate ADA Cardano cryptocurrency
This strategy was specifically developed for short ADA cryptocurrency operations in the ADA / BITCOIN pair.
Instructions:
- The strategy should be used on the daily chart of ADABTC;
- Entries should only be made from 21:00 in Brazil time zone;
- When the arrow indicates sale you should sell your ADAs to repurchase at a lower price, so you will be increasing your ADA quantity;
- When the arrow indicates "recomprar" you must repurchase the ADAs you sold on the sell signal given by the indicator;
- Use good risk management when using this strategy, avoid applying more than 50% of your ADAs to operations;
- A estratégia não possui um stop de perca. A saida de operações com prejuizo deve ser feita quando o indicador mandar recomprar as ADAs;
- When the ADA goes into a bullish trend this indicator performance may turn out to be bad, so the trader should be aware of possible developments that make the ADA appreciate against bitcoin.
Performance Information:
- First, it is important to note that there is no guarantee that past performance will continue in the future, so it is important that you do good risk management;
- The strategy was able to have a hit rate of over 60% on the daily chart between 2018 and October 2019. This means that with each operation you are more than 60% likely to have more ADAs.
- The largest loss occurred during the historical track tested was 4.72%, ie, those who entered the unsuccessful operation left with 4.72% less ADAs at the end of the operation;
- The operation with the highest profit in the series studied gave 90% return, that is, those who entered the operation almost doubled the equity in ADAs.

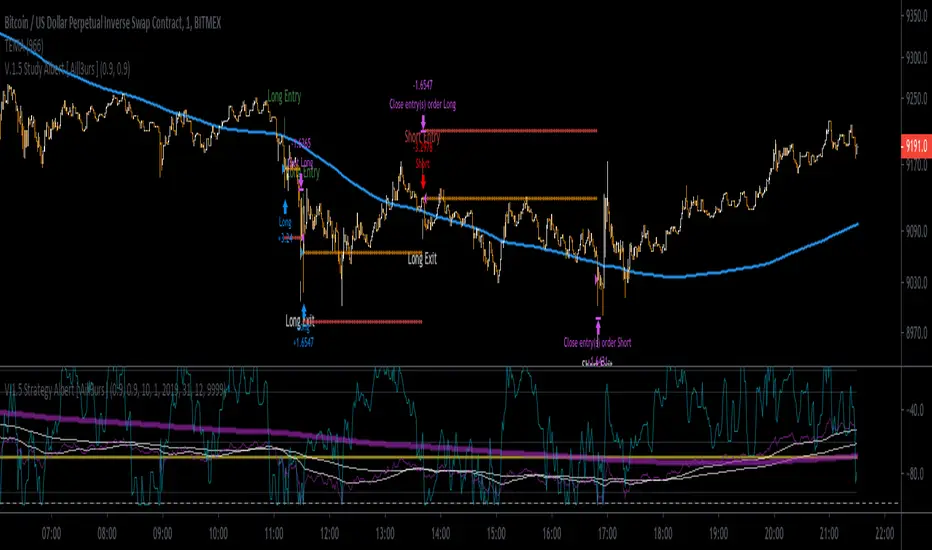
[Aill3urs V.0.4] Strategy Albert - EMA / Level / S&R/ WilliamThis INVIT-ONLY strategy is based on EMA / William / Level / Support & Resistance / Trends and work on low timeframe < 5min
NOTE: you can add this strategy to your chart and you should test different timeframe
Please use comment section for any feedback.
I have also a study with alarms Long Entry / Long Exit / Short Entry / Short Exit
For any question DM me for any request.
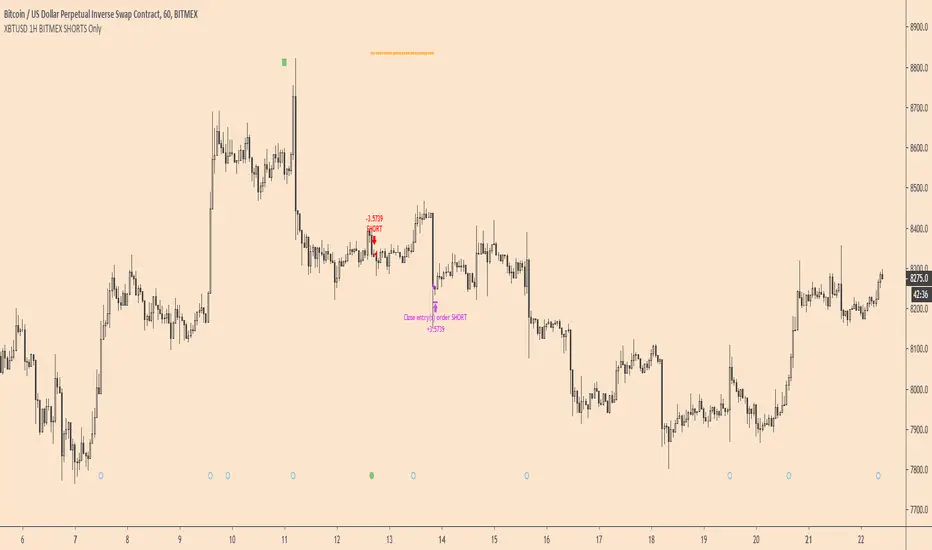
XBTUSD 1H BITMEX SHORTS OnlyXBTUSD H1 SWING Bitmex - SHORTS Only (Zero Leverage used)
AmazingBulls Scalping System detects trends & opens only SHORT positions on 1 Hour Timeframe in Bitmex
Dont use this indicator on any other coins or any other timeframes or any other direction or any other Exchange
Coin : XBTUSD Bitcoin Pepetual Futures Contract
Exchange : Bitmex
Direction : SHORTS Only
Timeframe : H1
ETHUSD 1H BITMEX SHORTS OnlyETHUSD H1 SWING Bitmex - SHORTS Only
AmazingBulls Scalping System detects trends & opens only SHORT positions on 1 Hour Timeframe in Bitmex
Dont use this indicator on any other coins or any other timeframes or any other direction or any other Exchange
Coin : ETHUSD Pepetual Futures Contract
Exchange : Bitmex
Direction : SHORTS Only
Timeframe : H1

MATICUSDT M15 SCALPER Binance - Longs OnlyMATICUSDT M15 SCALPER Binance - Longs Only
AmazingBulls Scalping System detects trends & opens only LONG positions on 15 Minute Timeframe in Binance.
Dont use it on any other coins or any other timeframes or any other direction or any other Exchange
Coin : MATICUSDT
Exchange : Binance
Direction : LONG Only
Timeframe : M15
1337 Simple Strategy - FREE - simple BTCUSD H1-H6 trendfollowing strategy
- best on H2-H4
- longterm strategy (no scalping)
- best with 1-3 pyramiding (but also without good)
TF = HTF Input
src = OHLC4 or hl2 for best results
Noisfilter = avoid too many Signals

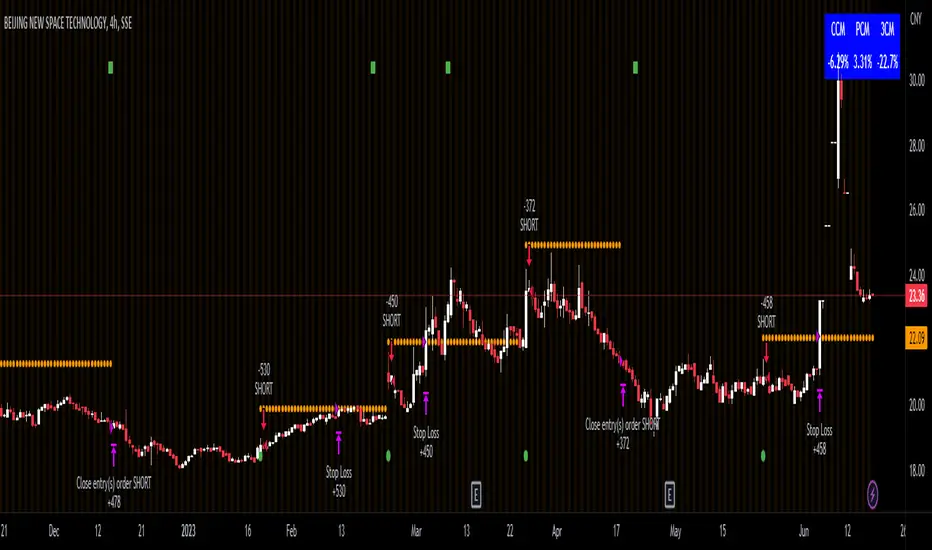
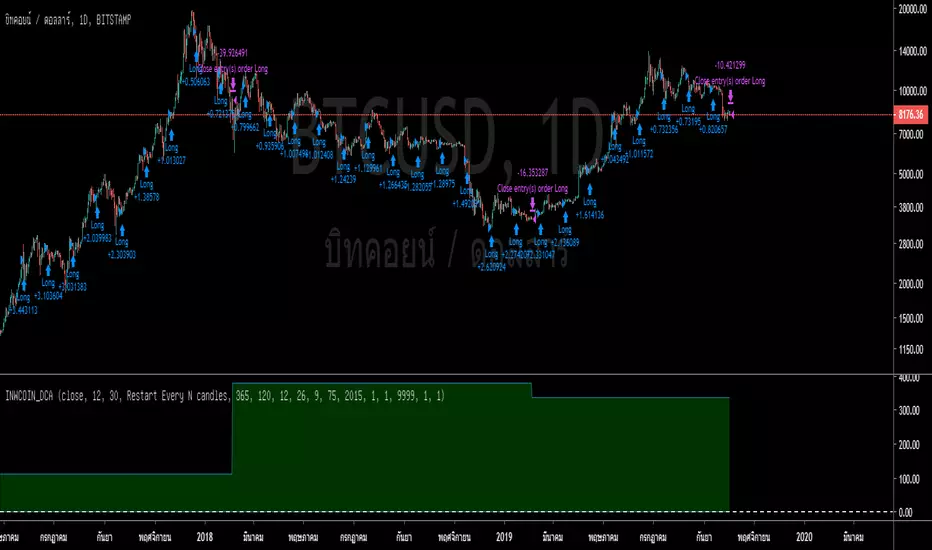
inwCoin DCA Strategy=========================
English
=========================
Just simple strategy idea for DCA bitcoin with different conditions.
Also, this is for education purpose and not the investing advise.
Use it as your own risk.
-----------
Concept
-----------
DCA with options as following ( only important option )
** Please use only in Daily TF **
Bullets Count : Amount of bullets for DCA period. If you want to DCA every months for 2 years ( close all position every 2 years ), your bullets value should be 24.
Buy every N candles : Number of candle you want to let this strategy trigger buy, 1 candle = 1 day so if you want to buy every month, input 30.
Entry / Exit filter : Dropdown to filter trade. If you don't want to DCA in downtrend, make sure to select this option. The simple trend filter is EMA 120 daily
Reset at candle N : One of DCA weak point is...no taking profit target in sight. So this option will force to take profit at N candle. You can try 1 year ( 365 ) or 2 years ( 730 )
==========================
Thai
==========================
Strategy สำหรับ backtest การ DCA ในรูปแบบต่างๆ ครับ โดยมี parameter ดังต่อไปนี้
** ควรใช้สำหรับ Timeframe Daily เท่านั้น **
Price : เป็นข้อมูลที่จะดึงมาคำนวณ ว่าจะเอาข้อมูลไหนจากแท่งเทียนมาคิด ปกติเลือก close แต่ถ้าไม่อยากให้ repaint ก็เลือก open
Bullets Count : จำนวนไม้ ที่เราจะเอามาเข้าซื้อ อย่างเช่น ถ้าจะซื้อเดือนละครั้ง และจะปิดยอดทุกๆ ปี ก็ให้ใส่ 12 ลงไป หรือถ้าเราอยากจะปิดยอดทุกๆ 2 ปี ก็ใส่ 48 เป็นต้น
Buy every N candles : จำนวนแท่งเทียนที่เราอยากจะซื้อ เช่นถ้าซื้อทุกเดือนก็ใส่ 30 ถ้าจะให้ซื้อทุกสัปดาห์ก็ใส่ 7 เป็นต้น
Entry/Exit Filter : ตัวกรองเงื่อนไขการเข้า ค่า default คือไม่กรอง แต่ถ้าจะกรอง ก็มีสองช้อยให้เลือก คือ
* กรองจาก EMA โดยจะใส่ length ของ EMA ที่ช่องด้านล่าง
* กรองจาก MACD cross 0 โดยจะใส่ รายละเอียดของ MACD ที่ช่องด้านล่าง
Reset at candle N : จะทำการขายปิดยอดที่แท่งเทียนที่เท่าไหร่ ถ้าจะปิดยอดทุกๆ ปีก็ใส่ 365 ถ้าจะปิดทุกๆ 2 ปี ก็ใส่ 730 และถ้าแก้ค่านี้ ก็อย่าลืมไปปรับ bullet count ให้สอดคล้องกันด้วย
Slow EMA Length : ตามนั้น ควรใช้ 120 เพราะ BTC ชอบค่านี้ แต่จะปรับเท่าไหร่ก็ได้แล้วแต่
Fast / Slow / MACD length : ค่าที่ใช้คำนวณ MACD ปกติจะเป็น 12,26,9
==========
Optional
==========
Close position at specific profit% : ถ้าติ๊กตรงนี้ มันจะทำการขายออก ถ้ากำไรเราได้ถึงช่องข้างล่าง
Reset at profit% : กรอก % ที่อยากจะให้ระบบขายไม้ DCA ออก ถ้ากำไรถึงเป้านี้
Close remaining position at last bar : จะทำการสรุปยอดและรับรู้กำไร ที่แท่งสุดท้าย จะใช้เพื่อลองดูประสิทธิภาพของ strategy
Exclude profit from capital : ไม่เอากำไร กลับเข้ามารวมในเงินทุนตอนแรก ( ลดการ Drawdown ได้เยอะอยู่ )
ที่เหลือเป็นตั้งช่วงที่จะ backtest ก็ไม่ยากอะไร
===========
วิธีใช้งาน
===========
เอาใส่กราฟ ก็จะเห็นผล backtest เลย แต่ถ้าอยากลองเล่นโน่นนี่นั่น ก็ลองปรับค่าไปเรื่อยๆ ดู
ตัวอย่างการตั้งค่า
============
* อยาก DCA แบบ เก็บกำไร สองปีครั้ง และแบ่งเป็น 24 ไม้ ( ทุน หาร 24 ) และซื้อทุกเดือน
Bullets Count = 24
Buy every N candles = 30
Reset at candle N = 730
* อยาก DCA ย้อนหลัง 5 ปี แบบไม่เก็บกำไรเลย มาเก็บเอาวันสุดท้าย และซื้อทุกเดือน
Bullets Count = 60 ( คือ 12 x 5 )
Buy every N candles = 30
Reset at candle N = 1825 ( คือ 365 x 5 )
From year : 2014
IWIN Long & Short strategyWelcome to the IWIN LS!
This is a trend identification indicator.
Setup:
Chart Historical Price must be set to "bars"
Time Range: 8hr
How to use:
Long = buy
Close Long = sell
Short = short
Close Short = cover
* this is a tool not intended to be used as financial advice or to make any investment decisions.
* invest at your own risk

BITCOINDICATOR StrategyStrategy for BITCOINDICATOR for your own backtesting purposes.
The trade locations mirror the price label values generated by BITCOINDICATOR (You can check by clicking on Strategy Tester > List of Trades). Just like BITCOINDICATOR, this strategy works with all time frames, although higher time frames will result in better average profit per trade.
Inputs:
- Click the gear icon to adjust the backtesting date range inputs.
Properties (gear icon then click properties tab):
- The default initial capital is 0, and the default order size is 1 Contract (1 BTC ) per trade (this gives more weight to the most recent data).
* We recommend keeping the order size in contracts because if you use fiat, the time periods of lower-priced Bitcoin will have a greater impact on the strategy (since those trades would transact more BTC ).
- Pyramiding is the number of trades allowed to be taken in the same direction. The default value is set to 5, although it is rare to see more than 2 trades in the same direction.
* Additional trades in the same direction can be useful for adding on to your position or just for trend confirmation. If you prefer to see every SHORT followed by a LONG and vice-versa, you can change pyramiding to 1.
Side Notes:
- BITCOINDICATOR strategy can also be used for any Altcoin/Stable coin pair (such as ETH/USD). However, you will want to increase the order size from 1 Contract, to suit your Altcoin (For example, at the time of writing: 1 BTC = 47 ETH, so I would trade ETH/USD with an order size of 47 contracts). Of course, you can adjust the order size to the amount that you are actually trading.
- You will notice that the lower the selected time frame, the date range for backtesting becomes more limited. This is because there is a historical bar data limit of 5,000 - 10,000 bars depending on the tier of your TradingView account.
*Bitcoindicator Strategy is part of the Bitcoindicator package.
For detailed information on Bitcoindicator and how to add it to your charts, please visit:
www.bitcoindicator.com
Strategy tested on BTC/USD(Day) from 1/1/2017 - 10/1/2019 :

Derivative Based StrategyThis strategy is based on utilizing the 1st, 2nd, 3rd, and 4th time derivatives of the HMA for investing equal percentages of some capital. Entry points are identified by trends in the 2nd, 3rd, and 4th derivatives while exit points are created at either a new entry point or a trailing stop loss %.
QuantCat Mom Finder Strategy (1H)QuantCat Momentum Finder Strategy
This strategy is designed to be used on the 1 hour time frame, on all x/btc pairs.
The beautiful thing is it plots the take profit, and stoploss for you for each entry- where I would say use the stoploss for sure and feel with water with how the price action is looking when in profit.
In this strategy, I actually implemented my own trading style into building the strategy. Having to replicate my own trading strategy into an algorithm, I can't make it exactly perfect to how I would trade, but what I can do is try and program the parameters that give it the absolute best chance of making a big move with a small drawdown- which replicates part of my momentum trading style. Here I am using RSI, MACD, EMA and trend filtering values to find moments where there has been a momentum change to play the rest of the move. It only picks the best entries.
There is always a 3-4 R/R move on average with with these trades, meaning 1 in 4 only need to hit to be a break even trader- where most of these strategies have about 35% hit rate.
The stoploss is so crucial to minimise any damage from huge unexpected candles, the strategies can just be used for entries as well, you don't have to stick to the exact formula- of the long and short system, but this by itself is profitable.
The system nets positive results on
-ETH/BTC
-LTC/BTC
-XRP/BTC
-ADA/BTC
-NEO/BTC etc.
We also have a free 15M strategy available too.
You can join our discord server to get live alerts for the strategy as well as speak to our devs! Link in signature below!!!

Odin's Kraken (TK Cross Strategy)A simple, yet profitable, trend following system based on 1 hour TK Crosses and ADX.
Works best on ETH/BTC, but is also profitable on other large-cap altcoin BTC pairs (ADA/BTC, EOS/BTC, and TRX/BTC ).
I'm still just getting started in the algo trading world, but if you have any questions I am more than happy to answer them in the comment section here or on Twitter (@pascaltmn).
Cheers.

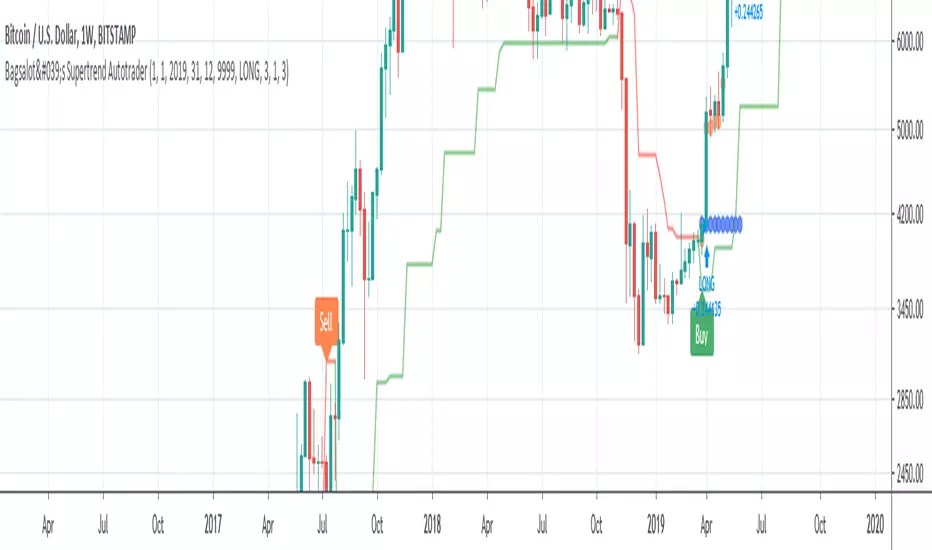
Bagsalot's Supertrend AutotraderTrend reversal indicator with a customizable trailing stop loss. Current model with default values is profitable on most assets (mostly bitcoin) but works on all assets as well. Set total cash invested, % of capital traded and get on to making money :D
Turtle Strategy Short Sell VersionThis is a short-sell version of the strategy based on the famous turtle system.
www.tradingblox.com
In a nutshell, it a trend trading system where you are shorting on strength (in the downtrend), selling on
weakness (that it might be reversing).
positions should be entered when the price crosses under the 20-day low (S1 low) or 55-day low (S2 low).
positions should be exited when the prices crosses over the 10-day high (S1 high) or 20-day high (S2 high)
you can add positions at every unit (measured by multiple of n, where n=1 ATR)
stops should be placed at 2*n above every position entered, when the stop is hit exit your entire position.
positions should be entered everytime price crosses under S1 or S2, with one exception:
if the last trade was an S1 trade and it was a winning trade, skip the next trade unless the price crosses
under S2, if that is the case, you should take it.
S1 and S2 levels are also configurable for high and lows.
N multiple for stops and pyramid are also configurable
To change this from a strateg to a study:
1) uncomment the next line and comment out the strategy line.
2) at the end of the file comment out the last 2 lines
study(title="Turtle Study Short", overlay=true)

TradeHunterVersion 1 of a Supply & Demand indicator I hope to continually improve.
Supply & demand are represented by flags & the triangles are intended to assist trend analysis & provide confluence.

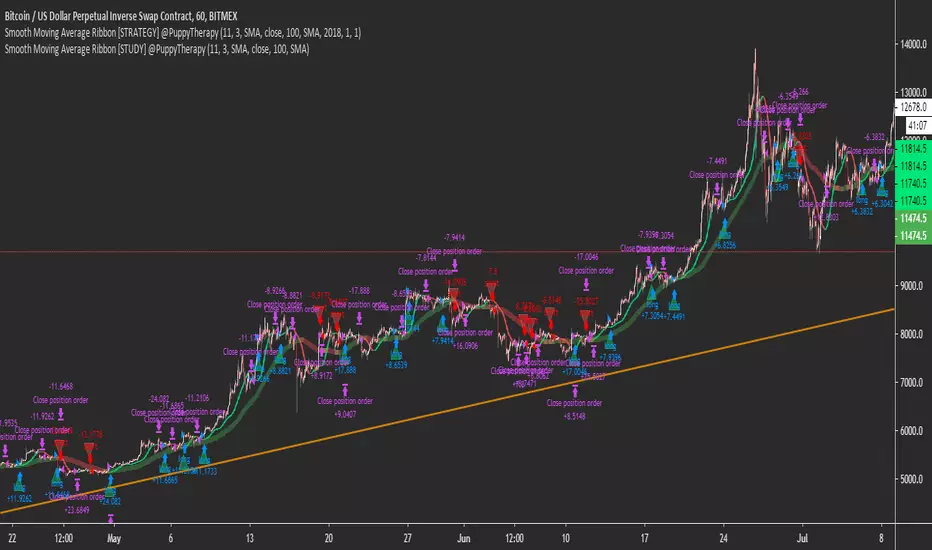
Smooth Moving Average Ribbon [STRATEGY] @PuppyTherapyThe Smooth moving average ribbon script is an enhancement of the script I posted yesterday. But will help you also create a very simple trend-following strategy or a simple trend-following filter.
You are able to select from a large variety of moving averages add Heikin Ashi Candles as a source and also add additional smoothing to every single of the moving averages.
The Strategy is using the basic backtesting engine.
It is a showcase that a simple strategy like buy when we going up and sell when we going down actually works especially on a bigger timeframe.
Thanks to all supporters and everget for some of the moving average scripts.
Smooth Moving Average [STRATEGY] @PuppyTherapyThe Smooth moving average script combo combines the ability to help you create a very simple trend-following strategy or a simple trend-following filter.
You are able to select from a large variety of moving averages add Heikin Ashi Candles as a source and also add additional smoothing to every single of the moving averages.
The Strategy is using the Tradingview backtesting framework.
It is a showcase that a simple strategy like buy when we going up and sell when we going down actually works especially on a bigger timeframe.
Thanks to all supporters and everget for some of the moving average scripts.

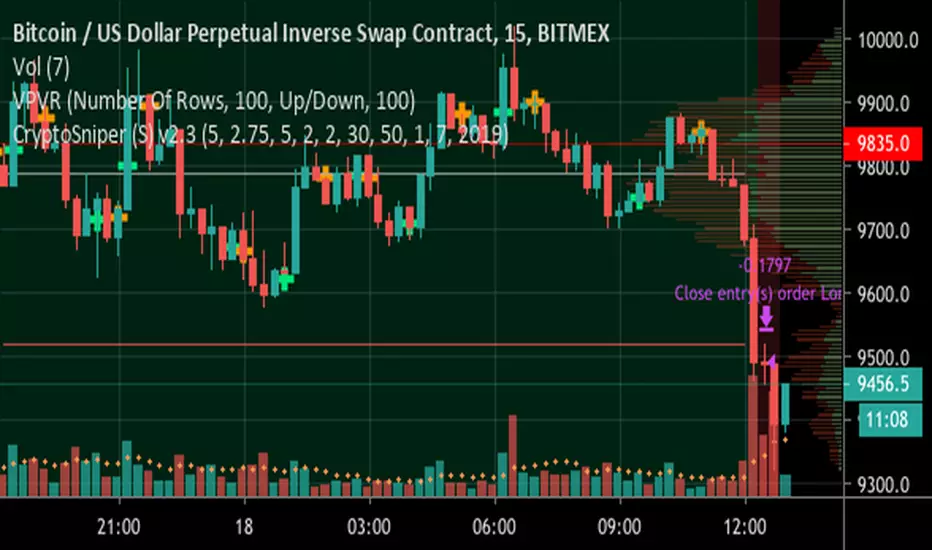
ck - CryptoSniper (Strategy) v2.1This strategy is radically different to the v1 script previously released.
It has ***NO REPAINTING*** - as such the algorithm had to change to remove it’s reliance on HMAs from future timeframes to establish trend, this is now accomplished with EMAs.
It is completely written in Pinescript v4.
It has integrated Stoploss and you can plot this & with the recommended Entry on the chart.
WARNING - This strategy has to be “tuned” to the instrument you are trading, for example, Bitcoin. The default settings work well for BTC/USD, XBT/USD on 15m chart timeframe but not for ETH/USD - it is possible the default settings will work with other crypto’s but I haven’t had time to test - if you find good settings PLEASE share them!
How to use:
1) Load up your favourite chart/instrument and select your favourite timeframe
2) Adjust the “signal” EMA and “baseline” EMA settings until you get the majority of uptrending moves highlighted with a green background and the majority of downtrending moves with a red background. The signal has to be faster (that is a lower number) than the baseline.
3) Adjust the “Sensitivity” - this will plot more green & orange Trigger points on the chart.
The strategy waits until in a trend, for example, a Long (green background) then waits for first green cross before opening a deal. It will Trigger a sell if the background turns red (downtrend) and a orange cross is printed.
4) Fine tuning:
A) Increase your profits by changing the Stoploss value - getting this right protects you from bad trades but also resets the indicator to provide another alert faster
B) You can increase the delay positions are opened or closed with the “Bar(s) offset to open position” and “Bar(s) offset to close position” settings. When you adjust these, 0 will buy/sell immediately when a Trigger cross is printed, 2 will wait until 2 bars/candles AFTER the Trigger cross prints to strat/close a position.
TIP: When adjusting indicator settings, load your chart and timeframe first.
Add the indicator/strategy (if you haven’t already).
Click the Strategy Tester tab at the bottom of the chart window so it is visible.
Open the strategy/indicator settings so you can see this wind AND the Strategy Tester display
Change a setting and click into a different setting input box, this will update the test results WITHOUT closing the settings window! This will save you a lot of time!
Write down any OK settings you find, you can come back later to fine tune them!
Please provide any feedback & let’s share the best settings for different crypto’s!