Trend Analysis IndicatorThe Trend Analysis Indicator was created by Adam White (Stocks & Commodities V. 10:8 (358-360)) and this is not to be confused with the Trend Analysis Index which was also created by Adam White. The stock is trending when it is above the signal and loses steam when it falls below the signal. Generally you should buy when it is above it's signal and sell when it goes below the signal.
Let me know if you would like me to write more scripts!
Pesquisar nos scripts por "trend"

Trend Following MAs 3DHello All,
This is Moving Averages Trend Following 3D indicator. The idea is based on direction of MAs and relation between 20 moving averages (5 to 100 period).
Option to show different type of MAs: EMA, SMA, RMA, WMA, VWMA.
As I haved tested it looks succesful at calculating trend direction and trend strength.
For a better look I tried to make it 3D, it looks good I think, waiting comments ;)
Some screenshots:
By using RMA type:
When it gets tiny it means there is no trend:
An example for down trend:
ENJOY!

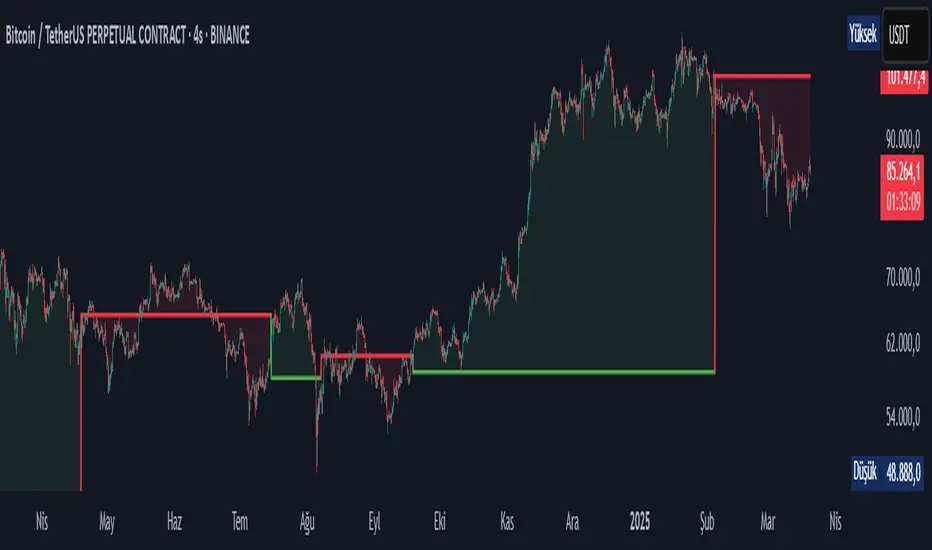
TRAPPER TRENDLINES — PRICEDraws dynamic trendlines on price by connecting the two most recent confirmed swing points (highs to highs for resistance, lows to lows for support). Swings are defined with a symmetric left/right pivot window. Old anchors are ignored so lines stay attached to current structure. Optional break alerts are included.
How it works (plain language)
Pivots: A bar is a swing high (or low) only if it’s the most extreme point compared with a set number of bars on the left and the right.
Lines:
Support connects the last two confirmed swing lows.
Resistance connects the last two confirmed swing highs.
Lines can be extended right only or both left & right (toggle).
Recency filter: Only swings within the last N bars are kept. This avoids anchoring to very old pivots far from current price.
Alerts: Optional alerts fire when price closes above resistance or below support.
Inputs
Auto Settings
Auto pivot size by chart timeframe: When ON, the script picks a pivot size suitable for the current timeframe (you can scale it with Auto pivot multiplier). When OFF, the manual left/right inputs are used.
Auto pivot multiplier: Scales the auto pivot size (e.g., 1.5 makes pivots stricter).
Manual Pivots
Pivot Left / Pivot Right: Bars to the left/right required to confirm a swing. Example: Left=50 & Right=50 keeps only major swings.
Recency Filter
Use last N bars for pivots: Swings older than this window are discarded so trendlines stay relevant to current price.
Style
Support/Resistance color: Line colors.
Extend Left & Right: When ON, both endpoints extend; when OFF, lines extend to the right only.
Alerts
Enable Break Alerts: When ON, alert conditions are exposed:
Price: Break Up — close above resistance.
Price: Break Down — close below support.
Suggested settings
Higher timeframes (4H / 1D / 1W):
Manual: Pivot Left = 50, Pivot Right = 50, Use last N bars = 400–800.
Or enable Auto with Auto pivot multiplier = 1.0–1.5.
Intraday (15m / 30m / 1H):
Manual: Pivot Left = 30, Pivot Right = 30, Use last N bars = 300–500.
Or enable Auto with multiplier ≈ 1.0–1.2.
Pairing with RSI for confluence/divergence
This tool is designed to pair with a companion TRAPPER TRENDLINES — RSI (or any RSI trendline script):
To mirror swings, set RSI Pivot Lookback equal to the price Pivot Left/Right you use here.
Example: Price = 50/50 → RSI Pivot Lookback = 50.
Keep RSI at Length 14 with 70/30 channel for clarity.
Confluence: Price holds/rejects at a trendline while RSI trendline agrees.
Divergence: Price prints a higher high (resistance line rising) while RSI prints a lower high (RSI resistance line falling), or vice-versa for lows. Matching pivot windows makes these relationships clear and reduces false signals.
Reading the signals
Trendline touch/hold: Potential reaction area; wait for follow-through.
Break Up / Break Down (alerts): Close beyond the line. Consider retest behavior, higher-timeframe context, and volume/RSI confirmation.
Notes & limitations
Pivots require future bars to confirm (by design). Lines update as pivots confirm.
“Use last N bars” purposely ignores very old swings. Increase this value if you need legacy structure.
Lines are based on two most recent confirmed pivots per side; rapidly changing markets can replace anchors as new swings confirm.
This is a visual/analytical tool. No strategy entries/exits or performance claims are provided.
Compliance
This script is for educational purposes only and does not constitute financial advice. Trading involves risk. Past results do not guarantee future outcomes. No promises of profit, accuracy, or performance are made.
Alerts (titles/messages)
Price: Break Up — “Price broke above resistance trendline.”
Price: Break Down — “Price broke below support trendline.”
Quick start
Add the indicator to your chart.
Choose Auto or set Pivot Left/Right manually.
Set Use last N bars for how far back to consider swings.
Toggle Extend Left & Right to your preference.
(Optional) Add your RSI trendline indicator and match Pivot Lookback with your price pivot size for clean confluence/divergence.
Enable alerts if you want notifications on breaks.

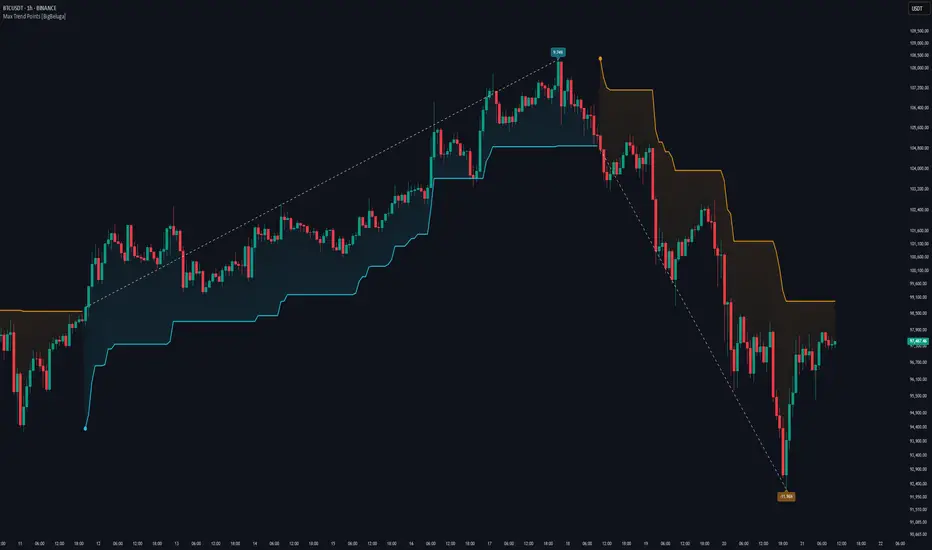
Max Trend Points [BigBeluga]🔵 OVERVIEW
A clean and powerful tool for identifying major trend shifts and quantifying the strength of each move using dynamically calculated price extremes.
This indicator helps traders visualize the most significant trend changes by plotting trend direction lines and dynamically tracking the highest or lowest point within each trend leg. It’s ideal for identifying key price impulses and measuring their magnitude in real time.
🔵 CONCEPTS
Uses an adaptive trend-following logic based on volatility envelopes created from HMA of the price range (high - low).
Identifies trend direction and flips when price breaks above or below these dynamic envelopes.
Tracks swing highs and lows within the current trend leg to highlight trend extremes.
Calculates and displays the percentage gain or drop from trend start to trend peak/valley.
🔵 FEATURES
Trend Shift Detection:
Plots a colored trend line (uptrend or downtrend) that updates based on price action volatility.
Impulse Mapping:
Draws a dashed line between the point of trend change (close) and the current trend leg's extreme (highest high or lowest low).
Percentage Labeling:
Displays a floating label showing the exact percent change from the trend start to the current extreme.
Real-Time Adjustments:
As the trend progresses, the extreme point and the percent label update automatically to reflect new highs/lows.
🔵 HOW TO USE
Look for the trend color shift and circular marker to identify a new potential trend direction.
Use the dashed lines and percent label to evaluate the strength and potential maturity of each move.
Combine this tool with support/resistance levels or other indicators to identify confluence zones.
Adjust the "Factor" input to make the trend detection more or less sensitive depending on your timeframe.
🔵 CONCLUSION
Max Trend Points is an efficient visual indicator for understanding the structure and magnitude of trending moves. It provides essential feedback on how far a trend has traveled, where momentum may be peaking, and when a shift may be underway—all with real-time adaptability and clean presentation.
Trend Detection
#### *Description:*
This *Trend Detection* indicator is designed to help traders identify and confirm trends in the market using a combination of moving averages, volume analysis, and MACD filters. It provides clear visual signals for uptrends and downtrends, along with customizable settings to adapt to different trading styles and timeframes. The indicator is suitable for both beginners and advanced traders who want to improve their trend-following strategies.
---
#### *Key Features:*
1. *Trend Detection:*
- Uses *Moving Averages (MA)* to determine the overall trend direction.
- Supports multiple MA types: *SMA (Simple), **EMA (Exponential), **WMA (Weighted), and **HMA (Hull)*.
2. *Advanced Filters:*
- *MACD Filter:* Confirms trends using MACD crossovers.
- *Volume Filter:* Ensures trends are supported by above-average volume.
- *Multi-Timeframe Filter:* Validates trends using a higher timeframe (e.g., Daily or Weekly).
3. *Visual Signals:*
- Plots a *trend line* on the chart to indicate the current trend direction.
- Fills the background with *green* for uptrends and *red* for downtrends.
4. *Customizable Settings:*
- Adjust the *MA lengths, **MACD parameters, and **confirmation thresholds* to suit your trading strategy.
- Control the transparency of the background fill for better chart readability.
5. *Alerts:*
- Generates *buy/sell signals* when a trend is confirmed.
- Alerts can be set to trigger at the close of a candle for precise entry/exit points.
---
#### *How to Use:*
1. *Adding the Indicator:*
- Copy and paste the Pine Script code into the TradingView Pine Script editor.
- Add the indicator to your chart.
2. *Configuring the Settings:*
- *Trend Settings:*
- Choose the *MA type* (e.g., EMA for faster response, HMA for smoother trends).
- Set the *Trend MA Period* (e.g., 200 for long-term trends) and *Filter MA Period* (e.g., 100 for medium-term trends).
- *Advanced Filters:*
- Enable/disable the *MACD Filter* and adjust its parameters (Fast, Slow, Signal).
- Enable/disable the *Volume Filter* to ensure trends are supported by volume.
- *Multi-Timeframe Filter:*
- Enable this filter to validate trends using a higher timeframe (e.g., Daily or Weekly).
3. *Interpreting the Signals:*
- *Uptrend:* The trend line turns *green*, and the background is filled with a transparent green color.
- *Downtrend:* The trend line turns *red*, and the background is filled with a transparent red color.
- *Alerts:* Buy/sell signals are generated when the trend is confirmed.
4. *Using Alerts:*
- Set up alerts for *Buy Signal* (bullish reversal) and *Sell Signal* (bearish reversal).
- Alerts can be configured to trigger at the close of a candle for precise execution.
---
#### *Settings and Their Effects:*
1. *MA Type:*
- *SMA:* Smooth but lagging. Best for long-term trends.
- *EMA:* Faster response to price changes. Suitable for medium-term trends.
- *WMA:* Gives more weight to recent prices. Useful for short-term trends.
- *HMA:* Combines speed and smoothness. Ideal for all timeframes.
2. *Trend MA Period:*
- A longer period (e.g., 200) identifies long-term trends but may lag.
- A shorter period (e.g., 50) reacts faster but may produce false signals.
3. *Filter MA Period:*
- Acts as a secondary filter to confirm the trend.
- A shorter period (e.g., 50) provides tighter confirmation but may increase noise.
4. *MACD Filter:*
- Ensures trends are confirmed by MACD crossovers.
- Adjust the *Fast, **Slow, and **Signal* lengths to match your trading style.
5. *Volume Filter:*
- Ensures trends are supported by above-average volume.
- Reduces false signals during low-volume periods.
6. *Multi-Timeframe Filter:*
- Validates trends using a higher timeframe (e.g., Daily or Weekly).
- Increases reliability but may delay signals.
7. *Confirmation Value:*
- Sets the minimum percentage deviation from the trend MA required to confirm a trend.
- A higher value (e.g., 2.0%) reduces false signals but may delay trend detection.
8. *Confirmation Bars:*
- Sets the number of bars required to confirm a trend.
- A higher value (e.g., 5 bars) ensures sustained trends but may delay signals.
---
#### *Who Should Use This Indicator?*
1. *Trend Followers:*
- Traders who focus on identifying and riding long-term trends.
- Suitable for *swing traders* and *position traders*.
2. *Day Traders:*
- Can use shorter MA periods and faster filters (e.g., EMA, HMA) for intraday trends.
3. *Volume-Based Traders:*
- Traders who rely on volume confirmation to validate trends.
4. *Multi-Timeframe Traders:*
- Traders who use higher timeframes to confirm trends on lower timeframes.
5. *Beginners:*
- Easy-to-understand visual signals and alerts make it beginner-friendly.
6. *Advanced Traders:*
- Customizable settings allow for fine-tuning to match specific strategies.
---
#### *Example Use Cases:*
1. *Long-Term Investing:*
- Use a *200-period SMA* with a *Daily* higher timeframe filter to identify long-term trends.
- Enable the *Volume Filter* to ensure trends are supported by strong volume.
2. *Swing Trading:*
- Use a *50-period EMA* with a *4-hour* higher timeframe filter for medium-term trends.
- Enable the *MACD Filter* to confirm trend reversals.
3. *Day Trading:*
- Use a *20-period HMA* with a *1-hour* higher timeframe filter for short-term trends.
- Disable the *Volume Filter* for faster signals.
---
#### *Conclusion:*
The *Trend Detection* indicator is a versatile tool for traders of all levels. Its customizable settings and advanced filters make it suitable for various trading styles and timeframes. By combining moving averages, volume analysis, and MACD filters, it provides reliable trend signals with minimal lag. Whether you're a beginner or an advanced trader, this indicator can help you make better trading decisions by identifying and confirming trends in the market.
---
#### *Publishing on TradingView:*
- *Title:* Trend Detection with Advanced Filters
- *Description:* A powerful trend detection tool using moving averages, volume analysis, and MACD filters. Suitable for all trading styles and timeframes.
- *Tags:* Trend, Moving Averages, MACD, Volume, Multi-Timeframe
- *Category:* Trend-Following
- *Access:* Public or Private (depending on your preference).
---
Let me know if you need further assistance or additional features!
Range Filtered Trend Signals [AlgoAlpha]Introducing the Range Filtered Trend Signals , a cutting-edge trading indicator designed to detect market trends and ranging conditions with high accuracy. This indicator leverages a combination of Kalman filtering and Supertrend analysis to smooth out price fluctuations while maintaining responsiveness to trend shifts. By incorporating volatility-based range filtering, it ensures traders can differentiate between trending and ranging conditions effectively, reducing false signals and enhancing trade decision-making.
:key: Key Features
:white_check_mark: Kalman Filter Smoothing – Minimizes market noise while preserving trend clarity.
:bar_chart: Supertrend Integration – A dynamic trend-following mechanism for spotting reversals.
:fire: Volatility-Based Range Detection – Detects trending vs. ranging conditions with precision.
:art: Color-Coded Trend Signals – Instantly recognize bullish, bearish, and ranging market states.
:gear: Customizable Inputs – Fine-tune Kalman parameters, Supertrend settings, and color themes to match your strategy.
:bell: Alerts for Trend Shifts – Get real-time notifications when market conditions change!
:tools: How to Use
Add the Indicator – Click the star icon to add it to your TradingView favorites.
Analyze Market Conditions – Observe the color-coded signals and range boundaries to identify trend strength and direction.
Use Alerts for Trade Execution – Set alerts for trend shifts and market conditions to stay ahead without constantly monitoring charts.
:mag: How It Works
The Kalman filter smooths price fluctuations by dynamically adjusting its weighting based on market volatility. It helps remove noise while keeping the signal reactive to trend changes. The Supertrend calculation is then applied to the filtered price data, providing a robust trend-following mechanism. To enhance signal accuracy, a volatility-weighted range filter is incorporated, creating upper and lower boundaries that define trend conditions. When price breaks out of these boundaries, the indicator confirms trend continuation, while signals within the range indicate market consolidation. Traders can leverage this tool to enhance trade timing, filter false breakouts, and identify optimal entry/exit zones.

Trend Filter (2-pole) [BigBeluga]Trend Filter (2-pole)
The Trend Filter (2-pole) is an advanced trend-following indicator based on a two-pole filter, which smooths out market noise while effectively highlighting trends and their strength. It incorporates color gradients and support/resistance dots to enhance trend visualization and decision-making for traders.
SP500:
🔵What is a Two-Pole Filter?
A two-pole filter is a digital signal processing technique widely used in electronics, control systems, and time series data analysis to smooth data and reduce noise.
//@function Two-pole filter
//@param src (series float) Source data (e.g., price)
//@param length (float) Length of the filter (higher value means smoother output)
//@param damping (float) Damping factor for the filter
//@returns (series float) Filtered value
method two_pole_filter(float src, int length, float damping) =>
// Calculate filter coefficients
float omega = 2.0 * math.pi / length
float alpha = damping * omega
float beta = math.pow(omega, 2)
// Initialize the filter variables
var float f1 = na
var float f2 = na
// Update the filter
f1 := nz(f1 ) + alpha * (src - nz(f1 ))
f2 := nz(f2 ) + beta * (f1 - nz(f2 ))
f2
It operates using two cascaded smoothing stages (poles), allowing for a more refined and responsive output compared to simple moving averages or other basic filters.
Two-pole filters are particularly valued for their ability to maintain smooth transitions while reducing lag, making them ideal for applications where precision and responsiveness are critical.
In trading, this filter helps detect trends by smoothing price data while preserving significant directional changes.
🔵Key Features of the Indicator:
Gradient-Colored Trend Filter Line: The main filter line dynamically changes color based on trend strength and direction:
- Green: Strong uptrend.
- Red: Strong downtrend.
- Yellow: Indicates a transition phase, signaling potential trend shifts.
Support and Resistance Dots with Signals:
- Dots are plotted below the filter line during uptrends and above it during downtrends.
- These dots represent consecutive rising or falling conditions of the filter line, which traders can set in the settings (e.g., the number of consecutive rises or falls required).
- The dots often act as dynamic support or resistance levels, providing valuable guidance during trends.
- Trend Signals:
Customizable Sensitivity: The indicator allows traders to adjust the filter length, damping factor, and the threshold for rising/falling conditions, enabling it to adapt to different trading styles and timeframes.
Bar Color Option: The indicator can optionally color bars to match the gradient of the filter line, enhancing visual clarity of trends directly on the price chart.
🔵How It Works:
The Trend Filter (2-pole) smooths price data using a two-pole filter, which reduces noise and highlights the underlying trend.
The gradient coloring of the filter line helps traders visually assess the strength and direction of trends.
Rising and falling conditions of the filter line are tracked, and dots are plotted when consecutive conditions meet the threshold, acting as potential support or resistance levels during trends.
The yellow transition color signals periods of indecision, helping traders anticipate potential reversals or consolidations.
🔵Use Cases:
Identify and follow strong uptrends and downtrends with gradient-based visual cues.
Use the yellow transition color to anticipate trend shifts or consolidation zones.
Leverage the plotted dots as dynamic support and resistance levels to refine entry and exit strategies.
Combine with other indicators for confirmation of trends and reversals.
This indicator is perfect for traders who want a visually intuitive and highly customizable tool to spot trends, gauge their strength, and make informed trading decisions.

Trend Reversal Probability [Algoalpha]Introducing Trend Reversal Probability by AlgoAlpha – a powerful indicator that estimates the likelihood of trend reversals based on an advanced custom oscillator and duration-based statistics. Designed for traders who want to stay ahead of potential market shifts, this indicator provides actionable insights into trend momentum and reversal probabilities.
Key Features :
🔧 Custom Oscillator Calculation: Combines a dual SMA strategy with a proprietary RSI-like calculation to detect market direction and strength.
📊 Probability Levels & Visualization: Plots average signal durations and their statistical deviations (±1, ±2, ±3 SD) on the chart for clear visual guidance.
🎨 Dynamic Color Customization: Choose your preferred colors for upward and downward trends, ensuring a personalized chart view.
📈 Signal Duration Metrics: Tracks and displays signal durations with columns representing key percentages (80%, 60%, 40%, and 20%).
🔔 Alerts for High Probability Events: Set alerts for significant reversal probabilities (above 84% and 98% or below 14%) to capture key trading moments.
How to Use :
Add the Indicator: Add Trend Reversal Probability to your favorites by clicking the star icon.
Market Analysis: Use the plotted probability levels (average duration and ±SD bands) to identify overextended trends and potential reversals. Use the color of the duration counter to identify the current trend.
Leverage Alerts: Enable alerts to stay informed of high or extreme reversal probabilities without constant chart monitoring.
How It Works :
The indicator begins by calculating a custom oscillator using short and long simple moving averages (SMA) of the midpoint price. A proprietary RSI-like formula then transforms these values to estimate trend direction and momentum. The duration between trend reversals is tracked and averaged, with standard deviations plotted to provide probabilistic guidance on trend longevity. Additionally, the indicator incorporates a cumulative probability function to estimate the likelihood of a trend reversal, displaying the result in a data table for easy reference. When probability levels cross key thresholds, alerts are triggered, helping traders take timely action.

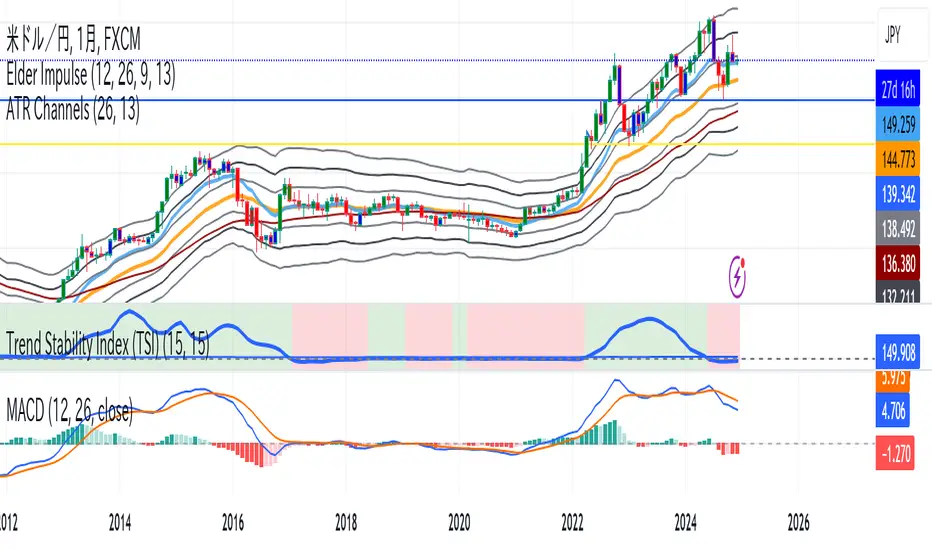
Trend Stability Index (TSI)Overview
The Trend Stability Index (TSI) is a technical analysis tool designed to evaluate the stability of a market trend by analyzing both price movements and trading volume. By combining these two crucial elements, the TSI provides traders with insights into the strength and reliability of ongoing trends, assisting in making informed trading decisions.
Key Features
• Dual Analysis: Integrates price changes and volume fluctuations to assess trend stability.
• Customizable Periods: Allows users to set evaluation periods for both trend and volume based on their trading preferences.
• Visual Indicators: Displays the Trend Stability Index as a line chart, highlights neutral zones, and uses background colors to indicate trend stability or instability.
Configuration Settings
1. Trend Length (trendLength)
• Description: Determines the number of periods over which the price stability is evaluated.
• Default Value: 15
• Usage: A longer trend length smooths out short-term volatility, providing a clearer picture of the overarching trend.
2. Volume Length (volumeLength)
• Description: Sets the number of periods over which trading volume changes are assessed.
• Default Value: 15
• Usage: Adjusting the volume length helps in capturing significant volume movements that may influence trend strength.
Calculation Methodology
The Trend Stability Index is calculated through a series of steps that analyze both price and volume changes:
1. Price Change Rate (priceChange)
• Calculation: Utilizes the Rate of Change (ROC) function on the closing prices over the specified trendLength.
• Purpose: Measures the percentage change in price over the trend evaluation period, indicating the direction and momentum of the price movement.
2. Volume Change Rate (volumeChange)
• Calculation: Applies the Rate of Change (ROC) function to the trading volume over the specified volumeLength.
• Purpose: Assesses the percentage change in trading volume, providing insight into the conviction behind price movements.
3. Trend Stability (trendStability)
• Calculation: Multiplies priceChange by volumeChange.
• Purpose: Combines price and volume changes to gauge the overall stability of the trend. A higher positive value suggests a strong and stable trend, while negative values may indicate trend weakness or reversal.
4. Trend Stability Index (TSI)
• Calculation: Applies a Simple Moving Average (SMA) to the trendStability over the trendLength period.
• Purpose: Smooths the trend stability data to create a more consistent and interpretable index.
Trend/Ranging Determination
• Stable Trend (isStable)
• Condition: When the TSI value is greater than 0.
• Interpretation: Indicates that the current trend is stable and likely to continue in its direction.
• Unstable Trend / Range-bound Market
• Condition: When the TSI value is less than or equal to 0.
• Interpretation: Suggests that the trend may be weakening, reversing, or that the market is moving sideways without a clear direction.
Visualization
The TSI indicator employs several visual elements to convey information effectively:
1. TSI Line
• Representation: Plotted as a blue line.
• Purpose: Displays the Trend Stability Index values over time, allowing traders to observe trend stability dynamics.
2. Neutral Horizontal Line
• Representation: A gray horizontal line at the 0 level.
• Purpose: Serves as a reference point to distinguish between stable and unstable trends.
3. Background Color
• Stable Trend: Green background with 80% transparency when isStable is true.
• Unstable Trend: Red background with 80% transparency when isStable is false.
• Purpose: Provides an immediate visual cue about the current trend’s stability, enhancing the interpretability of the indicator.
Usage Guidelines
• Identifying Trend Strength: Utilize the TSI to confirm the strength of existing trends. A consistently positive TSI suggests strong trend momentum, while a negative TSI may signal caution or a potential reversal.
• Volume Confirmation: The integration of volume changes helps in validating price movements. Significant price changes accompanied by corresponding volume shifts can reinforce the reliability of the trend.
• Entry and Exit Signals: Traders can use crossovers of the TSI with the neutral line (0 level) as potential entry or exit points. For instance, a crossover from below to above 0 may indicate a bullish trend initiation, while a crossover from above to below 0 could suggest bearish momentum.
• Combining with Other Indicators: To enhance trading strategies, consider using the TSI in conjunction with other technical indicators such as Moving Averages, RSI, or MACD for comprehensive market analysis.
Example Scenario
Imagine analyzing a stock with the following observations using the TSI:
• The TSI has been consistently above 0 for the past 30 periods, accompanied by increasing trading volume. This scenario indicates a strong and stable uptrend, suggesting that buying opportunities may be favorable.
• Conversely, if the TSI drops below 0 while the price remains relatively flat and volume decreases, it may imply that the current trend is losing momentum, and the market could be entering a consolidation phase or preparing for a trend reversal.
Conclusion
The Trend Stability Index is a valuable tool for traders seeking to assess the reliability and strength of market trends by integrating price and volume dynamics. Its customizable settings and clear visual indicators make it adaptable to various trading styles and market conditions. By incorporating the TSI into your trading analysis, you can enhance your ability to identify and act upon stable and profitable trends.
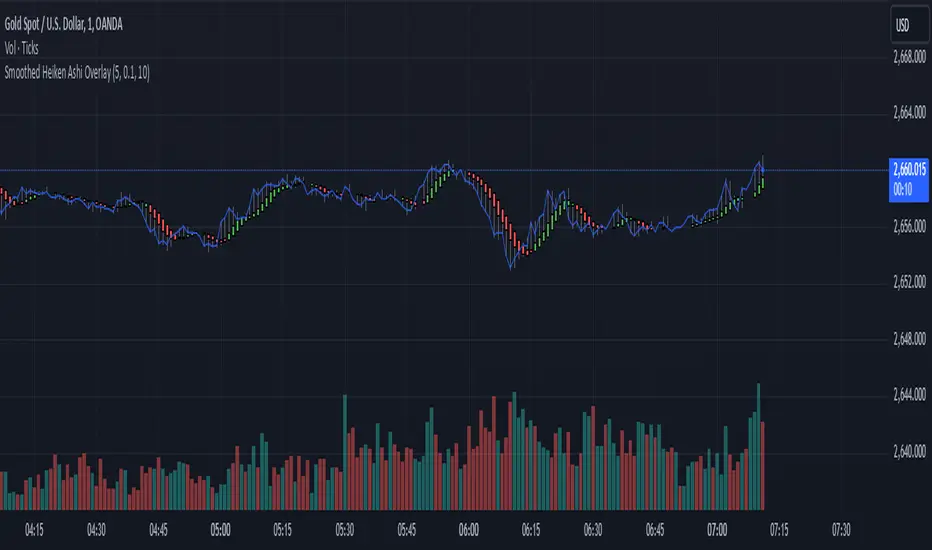
Smoothed Heiken Ashi Trend FilterThis indicator applies the Heiken Ashi technique with added smoothing and trend filtering to help reduce noise and improve trend detection.
Components of the Indicator:
Heiken Ashi Calculations:
Heiken Ashi Close (ha_close): This is the smoothed average of the current bar’s open, high, low, and close prices, calculated with a simple moving average (SMA) to filter out noise.
Heiken Ashi Open (ha_open): This is the average of the previous Heiken Ashi Open and the current Heiken Ashi Close. It’s also initialized to smooth the transition on the first bar.
Heiken Ashi High (ha_high) and Low (ha_low): These values are calculated as the highest and lowest values among the high, Heiken Ashi Open, and Heiken Ashi Close for each bar.
Smoothing and Noise Reduction:
Smoothing Length: The indicator applies a smoothing length to the Heiken Ashi Close, calculated with an SMA. This reduces minor fluctuations, giving a clearer view of the price action.
Minimum Body Size Filter: This filter calculates the body size of each Heiken Ashi candle and compares it to a percentage of the Average True Range (ATR). Only significant candles (those with larger bodies) are plotted, reducing weak or indecisive signals.
Trend Filtering with Moving Average:
The indicator uses a simple moving average (SMA) as a trend filter. By comparing the Heiken Ashi Close to the moving average:
Bullish Trend: The Heiken Ashi candle is green when it’s above the moving average.
Bearish Trend: The Heiken Ashi candle is red when it’s below the moving average.
How to Use This Indicator:
Trend Identification:
Green candles signify a bullish trend, while red candles signify a bearish trend.
The smoothing and trend filtering make it easier to identify sustained trends and avoid reacting to short-term fluctuations.
Filtering Out Noise:
Minor price fluctuations and small-bodied candles (often resulting in indecisive signals) are filtered out, leaving only significant signals.
Adjustable Parameters:
Smoothing Length: Controls the degree of smoothing applied to the Heiken Ashi Close value. Increasing this value will make the Heiken Ashi candles smoother.
Minimum Body Size: This is a percentage of the ATR, used to filter out small or indecisive candles.
Trend Moving Average Length: Controls the period of the moving average used as a trend filter.
This Smoothed Heiken Ashi Trend Filter indicator is useful for identifying trends and filtering out noisy signals. By smoothing and filtering, it helps traders focus on the overall trend rather than minor price movements.
Let me know if there’s anything more you’d like to add or adjust!
Trend Magic Enhanced [AlgoAlpha]🔥✨ Trend Magic Enhanced - Boost Your Trend Analysis! 🚀📈
Introducing the Trend Magic Enhanced indicator by AlgoAlpha, a powerful tool designed to help you identify market trends with greater accuracy. This advanced indicator combines the Commodity Channel Index (CCI) and Average True Range (ATR) to calculate dynamic support and resistance levels, known as the Trend Magic. By smoothing the Trend Magic with various moving average types, this indicator provides clearer trend signals and helps you make more informed trading decisions.
Key Features :
🎯 Unique Trend Identification : Combines CCI and ATR to detect market trends and potential reversals.
🔄 Customizable Smoothing : Choose from SMA, EMA, SMMA, WMA, or VWMA to smooth the Magic Trend for clearer signals.
🎨 Flexible Appearance Settings : Customize colors for bullish and bearish trends to suit your charting preferences.
⚙️ Adjustable Parameters : Modify CCI period, ATR period, ATR multiplier, and smoothing length to align with your trading strategy.
🔔 Alert Notifications : Set alerts for trend shifts to stay ahead of market movements.
📈 Visual Signals : Displays trend direction changes directly on the chart with up and down arrows.
Quick Guide to Using the Trend Magic Enhanced Indicator
🛠 Add the Indicator : Add the indicator to your chart by pressing the star icon to add it to favorites. Customize settings such as CCI period, ATR multiplier, ATR period, smoothing options, and colors to match your trading style.
📊 Analyze the Chart : Observe the Trend Magic line and the color-coded trend signals. When the Trend Magic line turns bullish (e.g., green), it indicates an upward trend, and when it turns bearish (e.g., red), it indicates a downward trend. Use the visual arrows to spot trend direction changes.
🔔 Set Alerts : Enable alerts to receive notifications when a trend shift is detected, so you can act promptly on trading opportunities without constantly monitoring the chart.
How It Works:
The Trend Magic Enhanced indicator integrates the Commodity Channel Index (CCI) and Average True Range (ATR) to calculate a dynamic Trend Magic line. By adjusting price levels based on CCI values—upward when CCI is positive and downward when negative—and factoring in ATR for market volatility, it creates adaptive support and resistance levels. Optionally smoothed with various moving averages to reduce noise, the indicator changes line color based on trend direction, highlights trend changes with arrows, and provides alerts for significant shifts, aiding traders in identifying potential entry and exit points.
Enhancements Over the Original Trend Magic Indicator
The Trend Magic Enhanced indicator significantly refines the trend identification method of the original Trend Magic script by introducing customizable smoothing options and additional analytical features. While the original indicator determines trend direction solely based on the Commodity Channel Index (CCI) crossing above or below zero and adjusts the Magic Trend line using the Average True Range (ATR), the enhanced version allows users to smooth the Magic Trend line with various moving average types (SMA, EMA, SMMA, WMA, VWMA). This smoothing reduces market noise and provides clearer trend signals. Additionally, the enhanced indicator incorporates price action analysis by detecting crossovers and crossunders of price with the Magic Trend line, and it visually marks trend changes with up and down arrows on the chart. These improvements offer a more responsive and accurate trend detection compared to the original method, enabling traders to identify potential entry and exit points more effectively.
Enhance your trading strategy with the Trend Magic Enhanced indicator by AlgoAlpha and gain a clearer perspective on market trends! 🌟📈

Stochastic Trendlines with Breakouts [Jamshid] - EnhancedStochastic Trendlines with Breakouts - Enhanced Version
This advanced Stochastic Trendlines with Breakouts script combines several powerful features to provide enhanced breakout detection based on the Stochastic Oscillator and additional confirmation signals. This script is designed to help traders identify key trend reversals, breakout points, and pivot levels with more accuracy by integrating advanced filters such as RSI confirmation, moving average trend filtering, volatility filtering, divergence detection, and multi-timeframe analysis.
Key Features:
Stochastic Oscillator-Based Breakouts:
Automatically detects breakouts based on the smoothed Stochastic Oscillator values (%K and %D), providing insights into overbought and oversold conditions.
Customizable overbought and oversold levels, with a mid-level (50) line for additional reference.
Trendlines on Pivot Points:
Automatically plots dynamic trendlines based on pivot highs and lows of the smoothed Stochastic %K, helping to visualize potential reversal points.
RSI Confirmation (Optional):
Filters breakout signals using the Relative Strength Index (RSI) to confirm breakouts only when the RSI is below 50 for downtrend breakouts and above 50 for uptrend breakouts.
Visual confirmation with a green "RSI Conf." label displayed on the chart when the RSI condition is met.
Moving Average Filter (Optional):
Confirms breakout signals in the direction of a user-defined Moving Average (MA) to trade in the overall market trend direction.
MA length is fully customizable.
Stochastic Divergence Filter (Optional):
Detects bullish or bearish divergence between the price and Stochastic Oscillator values, adding an extra layer of confirmation.
Multi-Timeframe Confirmation (Optional):
Confirms breakouts by checking the Stochastic %K and %D values from a higher timeframe. This helps in avoiding false signals by aligning with the broader market trend.
The higher timeframe can be customized to any timeframe (e.g., daily, weekly, etc.).
Volatility Filter (Optional):
Uses the ATR (Average True Range) to filter out breakouts during periods of low volatility, ensuring signals are only triggered when there is sufficient price movement.
ATR length and multiplier are fully customizable.
Custom Alerts:
Alerts are available for new trendline detections (both pivot high and pivot low) and for confirmed breakout signals. These alerts help traders stay informed in real-time without needing to monitor the chart continuously.
How to Use:
Customize the Stochastic Oscillator settings, such as %K smoothing and %D line parameters, to fit your trading strategy.
Enable or disable additional filtering features (RSI, MA, divergence, MTF, volatility) as needed.
Set up alerts for specific breakout conditions directly in TradingView to stay notified when breakout signals are triggered.
This script is designed for traders who are looking for precision breakout signals with added layers of confirmation to avoid false breakouts and enhance trading accuracy.

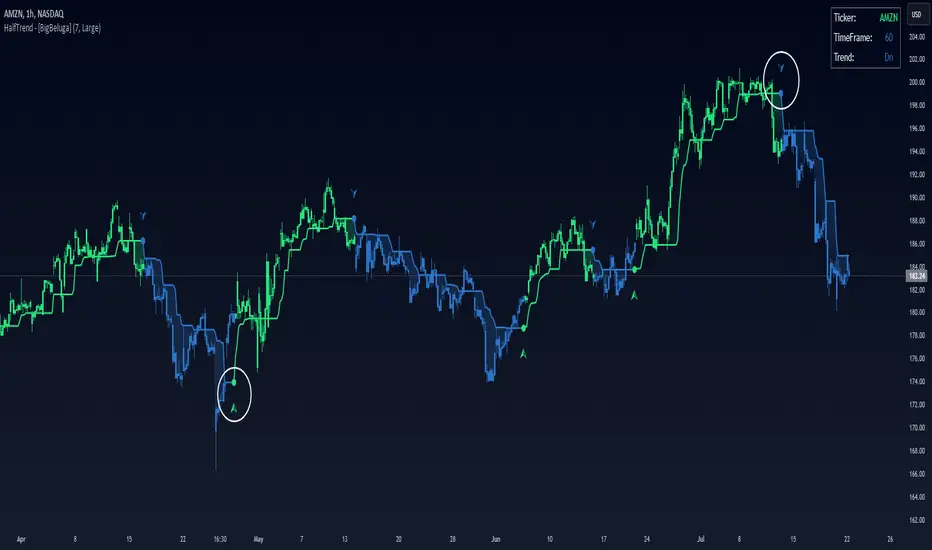
Half Trend HeikinAshi [BigBeluga]This indicator is a cool combo of the half-trend methodology and Heikin Ashi candles. The main idea is to help spot where the market is trending and where it might be reversing by using a mix of moving averages and the highest and lowest price data values. What’s nice is that it doesn’t just give you trend lines but also converts them into Heikin Ashi candles, so you can visually gauge the strength of a trend based on candle sizes.
NIFTY50:
NVIDIA:
🔵 IDEA
The thinking behind this Half Trend HeikinAshi indicator is pretty straightforward: it’s designed to give you a flexible way to detect trends and trend reversals, but with an added bonus—measuring trend strength via Heikin Ashi candles. The core idea is based on the classic half-trend strategy, where it adjusts to the highest and lowest price values within a certain period. The Heikin Ashi transformation smooths out half-trend line, making it easier to spot solid trends and potential reversals.
🔵 KEY FEATURES & USAGE
◉ Half Trend Calculation with Reversal Signals:
The main feature here is spotting trends based on a moving average of the close price and the highest/lowest price data.
//#region ———————————————————— Calculations
// Calculate moving average of close prices
series float closeMA = ta.sma(close, amplitude)
// Calculate highest high and lowest low
series float highestHigh = ta.highest(amplitude)
series float lowestLow = ta.lowest(amplitude)
// Initialize hl_t on the first bar
if barstate.isfirst
hl_t := close
// Update hl_t based on conditions
switch
closeMA < hl_t and highestHigh < hl_t => hl_t := highestHigh
closeMA > hl_t and lowestLow > hl_t => hl_t := lowestLow
=> hl_t := hl_t
When the trend flips, you’ll see arrows on your chart—either pointing up or down—marking the exact price where that reversal occurred. This makes it easy to see where the market might turn, which is helpful for timing entries and exits.
◉ Heikin Ashi Candlestick Transformation:
There’s a Heikin Ashi mode that transforms the half-trend line into Heikin Ashi candles.
These smooth out market noise and make the overall trend much clearer.
◉ Trend Strength Calculation:
The indicator doesn’t just stop at showing trends. It also calculates trend strength based on the size of the Heikin Ashi candles. Bigger candles mean stronger trends, and smaller ones indicate weaker momentum. You can see this displayed on the dashboard, so you know exactly how strong the current trend is at any moment.
◉ Graphical Dashboard Display:
You’ve got a small dashboard right on the chart that shows key info like the ticker, timeframe, and whether the trend is up or down. If you’re in Heikin Ashi mode, it shows trend strength instead. So, no need to dig through the data—you can just glance at the dashboard for a quick market read.
🔵 CUSTOMIZATION
Amplitude Input: You can tweak the amplitude to control how sensitive the half-trend line is. A lower setting makes it more reactive to small price moves, while a higher setting smooths it out for longer-term trends.
Heikin Ashi Toggle: You can easily switch between standard half-trend lines and Heikin Ashi candle mode, depending on how you prefer to see the market.
Trend Colors: You’ve got control over the colors for up and down trends, so you can adjust the appearance to fit your charting style.
Signal Labels size: Change Labels signal sizes for your preference
🔵 CONCLUSION
The Half Trend HeikinAshi indicator is a solid tool for tracking trends and measuring their strength. By combining the usual half-trend signals with Heikin Ashi candles, you get a clearer picture of what’s happening in the market. Whether you're looking to spot potential reversals or just want to measure the strength of a current trend, this indicator gives you plenty of flexibility to do both.
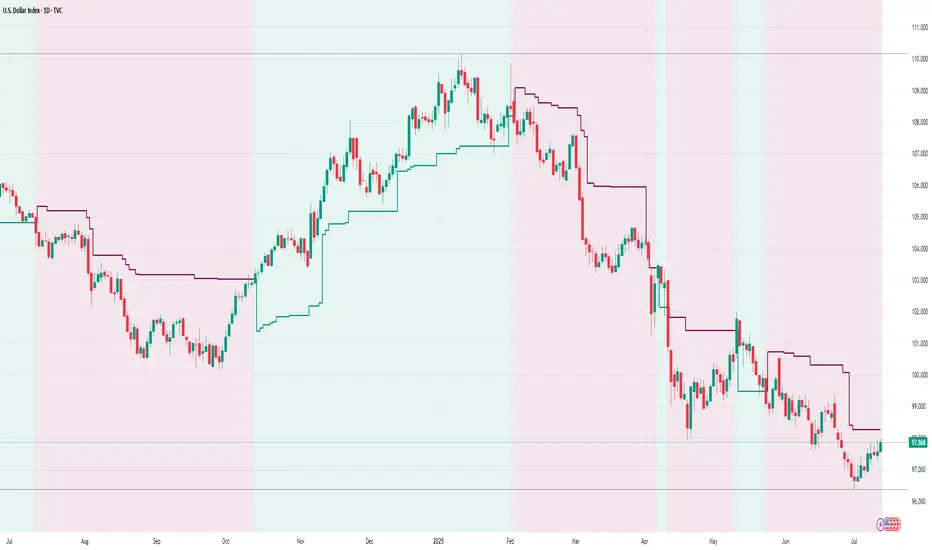
ATR TrendTL;DR - An average true range (ATR) based trend
ATR trend uses a (customizable) ATR calculation and highest high & lowest low prices to calculate the actual trend. Basically it determines the trend direction by using highest high & lowest low and calculates (depending on the determined direction) the ATR trend by using a ATR based calculation and comparison method.
The indicator will draw one trendline by default. It is also possible to draw a second trendline which shows a 'negative trend'. This trendline is calculated the same way the primary trendline is calculated but uses a negative (-1 by default) value for the ATR calculation. This trendline can be used to detect early trend changes and/or micro trends.
How to use:
Due to its ATR nature the ATR trend will show trend changes by changing the trendline direction. This means that when the price crosses the trendline it does not automatically mean a trend change. However using the 'negative trend' option ATR trend can show early trend changes and therefore good entry points.
Some notes:
- A (confirmed) trend change is shown by a changing color and/or moving trendline (up/down)
- Unlike other indicators the 'time period' value is not the primary adjustment setting. This value is only used to calculate highest high & lowest low values and has medium impact on trend calculation. The primary adjustment setting is 'ATR weight'
- Every settings has a tooltip with further explanation
- I added additional color coding which uses a different color when the trend attempts to change but the trend change isn't confirmed (yet)
- Default values work fine (at least in my back testing) but the recommendation is to adjust the settings (especially ATR weight) to your trading style
- You can further finetune this indicator by using custom moving average types for the ATR calculation (like linear regression or Hull moving average)
- Both trendlines can be used to determine future support and resistance zones
- ATR trend can be used as a stop loss finder
- Alerts are using buy/sell signals
- You can use fancy color filling ;)
Happy trading!
Daniel

Trend Direction Sequence | Auto-Multi-TimeframeThe main benefit of this indicator is the ability to see multiple higher timeframes at ones to get a better overview of signals that could mark possible trend reversals with more weight than those on the selected timeframe. Since the higher timeframes are calculated automatically, the user needs to set a Period Multiplier that multiplies the selected timeframe several times to determine the higher timeframes. Equal periods are filtered out. And the current highest timeframe is capped at 1 year by TradingView.
It is possible to alter the sequence Count Limit and the underlying Wavelength. The Wavelength defines the distance between the starting and ending candle. This builds the minimum condition to find a trend. A longer Wavelength means that the distortions between the start and end candle can be bigger, so it can become easier to find a trending sequence. But be careful not to set the length too high as this could mean that the resulting sequence does not really represent a trend anymore. The Count Limit defines the completion of a trending sequence. A higher number makes it more difficult to find a completed sequence, but also makes the result more reliable. If the Wavelength is changed, the Count Limit should be adjusted accordingly.
There is also a qualifier for the completion of a sequence. A completed sequence only will be labeled on the chart, if it is proved that the lowest low/highest high of the last two candlesticks of a period is lower/higher than that of the previous two candlesticks. It does not require the trend to be continuous on the last candlestick. On the contrary, a trend shift may already have begun.
By default, the labeling of completed sequences will appear on the highs and lows of the specific periods. Because the higher periods will take time and several candlesticks to appear, the labels will be redrawn accordingly. As an option it is possible to disable the Count Limit for completed sequences so that the labels will be fluently redrawn until the corresponding sequences are interrupted by trend breaks. Only activate this option, if it can serve a plausible strategy.
The count status of all sequences in the specific timeframe periods is listed in a table. Also the results of the trends in higher timeframes are accumulated and combined into an overall trend. Positive trends are counted as positive, negative in the opposite case. To see the resulting Trend Shift Signals, the user can set a filter under 100% so that not all of them will be filtered out and therefore labeled on the chart (this signals cannot be redrawn). An “External Indicator Analysis Overlay” can be used to analyze the profitability with the provided Trend Shift Signal (TSS) which switches from 0 to 1, if the trend becomes positive or from 0 to -1, if the trend becomes negative.

Immediate Trend - VHXIMMEDIATE TREND - VULNERABLE_HUMAN_X
This indicator is used to identify the immediate trend in the market.
When a Short Term High (STH) is engulfed and closed above, we consider that as a bullish trend.
And Similarly, when a Short Term Low (STL) is engulfed and closed below, we consider that as a bullish trend.
STH - A candle that is higher than the one candle towards it's left and one candle towards it's right.
STL - A candle that is lower than the one candle towards it's left and one candle towards it's right.
HOW TO USE:
1. Do not take trades purely based on the immediate trend showcased by the indicator. Rather, use them as confluence with your trading strategy.
2. When you are expecting price to reverse at your point of interest (Denamd/Supply zone), this indicator can help you predict the reversal by showcasing the current trend.
3. Using this indicator you can travel the trend as long as there is a change of trend predicted by this indicator.

Trend Indicator (dow trending) - FontiramisuIndicator showing pivots and interpret a trend out of it.
Pivots are calculating with deviation parameter to validate with more precision.
Trending moves are calculated according to Dow Theory :
In an uptrend, if the price made a new high, the price must make a new high to confirm the trend, otherwise, it might signal a possible change in the trend.
In an uptrend, if the price made a new low, the price must make a new low to confirm the trend, otherwise, it might signal a possible change in the trend.
The indicator can show 2 trends with 2 different "Pivot Depth"
See indicator parameters.
Tab is display at the bottom right corner to show trend direction and if it is hesitating
Fontilab Library is used to code this indicator

MTF Trend WidgetThis indicator identifies trends in multiple higher timeframes (D, W, M) and shows them in a widget off to the right of the chart.
It's meant to be used as an alternative filter for "trading with the trend." Typically people use moving averages of varying lengths for this (i.e. if over 200 MA it's an uptrend, etc.), but I wanted to see if it might be more effective to see if the higher timeframes were actually trending or not in a certain direction.
For the purposes of this indicator, an uptrend is defined as higher highs and higher lows. So if currently in a downtrend and the highs are broken, the indicator will flip to an uptrend because now we have a higher high. Vice versa for downtrends.
The user can choose the lookback period for defining these highs/lows (the pivot points). A smaller lookback number will give you more frequent pivot points.
The user can toggle on visibility of all historical pivot points to make sure the frequency and placement of the swing highs/lows is to their liking.
The user can show the support/resistance lines of those most recent swing high/low points on the multiple timeframes as well.
When these lines are breached, that is when the trends change, so you can see if you are close to changing any longer term trends.
My hope is that this gives people a quick glance at the overall trend without having to cycle through different timeframes.

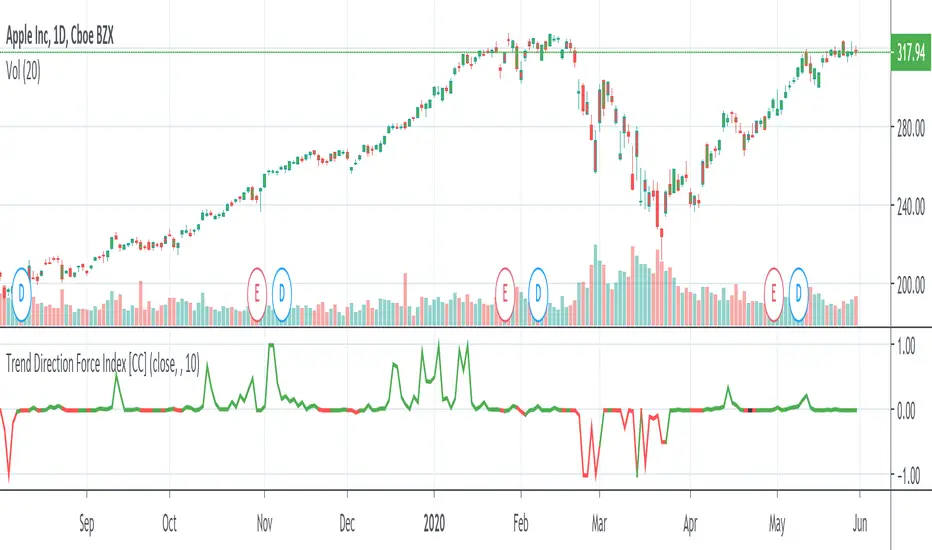
Trend Direction Force IndexThis is my own version of the famous Trend Direction Force Index and I modified the original to make my version react quickly to any trend. I have color coded the indicator to make it extremely easy to read so if it is green then buy and red then sell.
This was a custom request so if you would like more then just send me a message!
Big Candle Trend█ OVERVIEW
The "Big Candle Trend" indicator is a technical analysis tool written in Pine Script® v6 that identifies large signal candles on the chart and determines the trend direction based on the analysis of all candles within a specified period. Designed for traders seeking a simple yet effective tool to identify key market movements and trends, the indicator provides clarity and precision through flexible settings, trend line visualization, and retracement lines on signal candles.
█ CONCEPTS
The goal of the "Big Candle Trend" indicator was to create a tool based solely on the size of candle bodies and their relative positions, making it universal and effective across all markets (stocks, forex, cryptocurrencies) and timeframes. Unlike traditional indicators that often rely on complex formulas or external data (e.g., volume), this indicator uses simple yet powerful price action logic. Large signal candles are identified by comparing their body size to the average body size over a selected period, and the trend is determined by analyzing price changes over a longer period relative to the average candle body size. Additionally, the indicator draws horizontal lines on signal candles, aiding in setting Stop Loss levels or delayed entries.
█ FEATURES
Large Signal Candle Detection: Identifies candles with a body larger than the average body multiplied by a user-defined multiplier, aligned with the trend (if the trend filter is enabled). Signals are displayed as triangles (green for bullish, red for bearish).
Trend Analysis: Determines the trend (uptrend, downtrend, or neutral) by comparing the price change over a selected period (trend_length) to the average candle body size multiplied by a trend strength multiplier. The trend starts when:
Uptrend: The price change (difference between the current close and the close from an earlier period) is positive and exceeds the average candle body size multiplied by the trend strength multiplier (avg_body_trend * trend_mult).
Downtrend: The price change is negative and exceeds, in absolute value, the average candle body size multiplied by the trend strength multiplier.
Neutral Trend: The price change is below the required threshold, indicating no clear market direction.The trend ends when the price change no longer meets the conditions for an uptrend or downtrend, transitioning to a neutral state or switching to the opposite trend when the price change reverses and meets the conditions for the new trend. This approach differs from standard methods as it focuses on price dynamics in the context of candle body size, offering a more intuitive and direct way to gauge trend strength.
Smoothed Trend Line: Displays a trend line based on the average price (HL2, i.e., the average of the high and low of a candle), smoothed using a user-defined smoothing parameter. The trend line reflects the market direction but is not tied to breakouts, unlike many other trend indicators, allowing for more flexible interpretation.
Retracement Lines: Draws horizontal lines on signal candles at a user-defined level (e.g., 0.618). The lines are displayed to the right of the candle, with a width of one candle. For bullish candles, the line is measured from the top of the body (close) downward, and for bearish candles, from the bottom of the body (close) upward, aiding in setting Stop Loss or delayed entries.
Trend Option: Option to enable a trend filter that limits large candle signals to those aligned with the current trend, enhancing signal precision.
Customizable Visualization: Allows customization of colors for uptrend, downtrend, and neutral states, trend line style, and shadow fill between the trend line and price.
Alerts: Built-in alerts for large signal candles (bullish and bearish) and trend changes (start of uptrend, downtrend, or neutral trend).
█ HOW TO USE
Add to Chart: Apply the indicator to your TradingView chart via the Pine Editor or Indicators menu.
Configure Settings:
Candle Settings:
Average Period (Candles): Sets the period for calculating the average candle body size.
Large Candle Multiplier: Multiplier determining how large a candle’s body must be to be considered "large".
Trend Settings:
Trend Period: Period for analyzing price changes to determine the trend.
Trend Strength Multiplier: Multiplier setting the minimum price change required to identify a significant trend.
Trend Line Smoothing: Degree of smoothing for the trend line.
Show Trend Line: Enables/disables the display of the trend line.
Apply Trend Filter: Limits large candle signals to those aligned with the current trend.
Trend Colors:
Customize colors for uptrend (green), downtrend (red), and neutral (gray) states, and enable/disable shadow fill.
Retracement Settings:
Retracement Level (0.0-1.0): Sets the level for lines on signal candles (e.g., 0.618).
Line Width: Sets the thickness of retracement lines.
Interpreting Signals:
Bullish Signal: A green triangle below the candle indicates a large bullish candle aligned with an uptrend (if the trend filter is enabled). A horizontal line is drawn to the right of the candle at the retracement level, measured from the top of the body downward.
Bearish Signal: A red triangle above the candle indicates a large bearish candle aligned with a downtrend (if the trend filter is enabled). A horizontal line is drawn to the right of the candle at the retracement level, measured from the bottom of the body upward.
rend Line: Shows the market direction (green for uptrend, red for downtrend, gray for neutral). Unlike many indicators, the trend line’s color is not tied to its breakout, allowing for more flexible interpretation of market dynamics.
Alerts: Set up alerts in TradingView for large signal candles or trend changes to receive real-time notifications.
Combining with Other Tools: Use the indicator alongside other technical analysis tools, such as support/resistance levels, RSI, moving averages, or Fair Value Gaps (FVG), to confirm signals.
█ APPLICATIONS
Price Action Trading: Large signal candles can indicate key market moments, such as breakouts of support/resistance levels or strong price rejections. Use signal candles in conjunction with support/resistance levels or FVG to identify entry opportunities. Retracement lines help set Stop Loss levels (e.g., below the line for bullish candles, above for bearish) or delayed entries after price returns to the retracement level and confirms trend continuation. Note that large candles often generate Fair Value Gaps (FVG), which should be considered when setting Stop Loss levels.
Trend Strategies: Enable the trend filter to limit signals to those aligned with the dominant market direction. For example, in an uptrend, look for large bullish candles as continuation signals. The indicator can also be used for position pyramiding, adding positions as subsequent large candles confirm trend continuation.
Practical Approach:
Large candles with high volume may indicate strong market participation, increasing signal reliability.
The trend line helps visually assess market direction and confirm large candle signals.
Retracement lines on signal candles aid in identifying key levels for Stop Loss or delayed entries.
█ NOTES
The indicator works across all markets and timeframes due to its universal logic based on candle body size and relative positioning.
Adjust settings (e.g., trend period, large candle multiplier, retracement level) to suit your trading style and timeframe.
Test the indicator on various markets (stocks, forex, cryptocurrencies) and timeframes to optimize its performance.
Use in conjunction with other technical analysis tools to enhance signal accuracy.

Golden Ratio Trend Persistence [EWT]Golden Ratio Trend Persistence
~~~~~~~~~~~~~~~~~~~~~~~~~~~~~~~~~~~~~~~~~~~~
Overview
The Golden Ratio Trend Persistence is a dynamic tool designed to identify the strength and persistence of market trends. It operates on a simple yet powerful premise: a trend is likely to continue as long as it doesn't retrace beyond the key Fibonacci golden ratio of 61.8%.
This indicator automatically identifies the most significant swing high or low and plots a single, dynamic line representing the 61.8% retracement level of the current move. This line acts as a "line in the sand" for the prevailing trend. The background color also changes to provide an immediate visual cue of the current market direction.
~~~~~~~~~~~~~~~~~~~~~~~~~~~~~~~~~~~~~~~~~~~~
The Power of the Golden Ratio (61.8%)
The golden ratio (ϕ≈1.618) and its inverse (0.618, or 61.8%) are fundamental mathematical constants that appear throughout nature, art, and science, often representing harmony and structure. In financial markets, this ratio is a cornerstone of Fibonacci analysis and is considered one of the most critical levels for price retracements.
Market movements are not linear; they progress in waves of impulse and correction. The 61.8% level often acts as the ultimate point of support or resistance. A trend that can hold this level demonstrates underlying strength and is likely to persist. A breach of this level, however, suggests a fundamental shift in market sentiment and a potential reversal.
~~~~~~~~~~~~~~~~~~~~~~~~~~~~~~~~~~~~~~~~~~~~
How to Use This Indicator
This indicator is designed for clarity and ease of use.
Identifying the Trend : The visual cues make the current trend instantly recognizable.
A teal line with a teal background signifies a bullish trend. The line acts as dynamic support.
A maroon line with a maroon background signifies a bearish trend. The line acts as dynamic resistance.
Confirming Trend Persistence : As long as the price respects the plotted level, the trend is considered intact.
In an uptrend, prices should remain above the teal line. The indicator will automatically adjust its anchor to new, higher lows, causing the support line to trail the price.
In a downtrend, prices should remain below the maroon line.
Spotting Trend Reversals : The primary signal is a trend reversal, which occurs when the price closes decisively beyond the plotted level.
Potential Sell Signal : When the price closes below the teal support line, it indicates that buying pressure has failed, and the uptrend is likely over.
Potential Buy Signal : When the price closes above the maroon resistance line, it indicates that selling pressure has subsided, and a new uptrend may be starting.
Think of this tool as an intelligent, adaptive trailing stop that is based on market structure and the time-tested principles of Fibonacci analysis.
~~~~~~~~~~~~~~~~~~~~~~~~~~~~~~~~~~~~~~~~~~~~
Input Parameters
You can customize the indicator's sensitivity through the following inputs in the settings menu:
Pivot Lookback Left : This number defines how many bars to the left of a candle must be lower (for a pivot high) or higher (for a pivot low) to identify a potential swing point. A higher value will result in fewer, but more significant, pivots being detected.
Pivot Lookback Right : This defines the number of bars that must close to the right before a swing point is confirmed. This parameter prevents the indicator from repainting. A higher value increases confirmation strength but also adds a slight lag.
Fibonacci Ratio : While the default is the golden ratio (0.618), you can adjust this to other key Fibonacci levels, such as 0.5 (50%) or 0.382 (38.2%), to test for different levels of trend persistence.
Adjusting these parameters allows you to fine-tune the indicator for different assets, timeframes, and trading styles, from short-term scalping to long-term trend following.
Trend Flow Trail [AlgoAlpha]OVERVIEW
This script overlays a custom hybrid indicator called the Money Flow Trail which combines a volatility-based trend-following trail with a volume-weighted momentum oscillator. It’s built around two core components: the AlphaTrail—a dynamic band system influenced by Hull MA and volatility—and a smoothed Money Flow Index (MFI) that provides insights into buying or selling pressure. Together, these tools are used to color bars, generate potential reversal markers, and assist traders in identifying trend continuation or exhaustion phases in any market or timeframe.
CONCEPTS
The AlphaTrail calculates a volatility-adjusted channel around price using the Hull Moving Average as the base and an EMA of range as the spread. It adaptively shifts based on price interaction to capture trend reversals while avoiding whipsaws. The direction (bullish or bearish) determines both the band being tracked and how the trail locks in. The Money Flow Index (MFI) is derived from hlc3 and volume, measuring buying vs selling pressure, and is further smoothed with a short Hull MA to reduce noise while preserving structure. These two systems work in tandem: AlphaTrail governs directional context, while MFI refines the timing.
FEATURES
Dynamic AlphaTrail line with regime switching logic that controls directional bias and bar coloring.
Smoothed MFI with gradient coloring to visually communicate pressure and exhaustion levels.
Overbought/oversold thresholds (80/20), mid-level (50), and custom extreme zones (90/10) for deeper signal granularity.
Built-in take-profit signal logic: crossover of MFI into overbought with bullish AlphaTrail, or into oversold with bearish AlphaTrail.
Visual fills between price and AlphaTrail for clearer confirmation during trend phases.
Alerts for regime shifts, MFI crossovers, trail interactions, and bar color regime changes.
USAGE
Add the indicator to any chart. Use the AlphaTrail plot to define trend context: bullish (trailing below price) or bearish (trailing above). MFI values give supporting confirmation—favor long setups when MFI is rising and above 50 in a bullish regime, and shorts when MFI is falling and below 50 in a bearish regime. The colored fills help visually track strength; sharp changes in MFI crossing 80/20 or 90/10 zones often precede pullbacks or reversals. Use the plotted circles as optional take-profit signals when MFI and trend are extended. Adjust AlphaTrail length/multiplier and MFI smoothing to better match the asset’s volatility profile.

Trend Impulse Channels (Zeiierman)█ Overview
Trend Impulse Channels (Zeiierman) is a precision-engineered trend-following system that visualizes discrete trend progression using volatility-scaled step logic. It replaces traditional slope-based tracking with clearly defined “trend steps,” capturing directional momentum only when price action decisively confirms a shift through an ATR-based trigger.
This tool is ideal for traders who prefer structured, stair-step progression over fluid curves, and value the clarity of momentum-based bands that reveal breakout conviction, pullback retests, and consolidation zones. The channel width adapts automatically to market volatility, while the step logic filters out noise and false flips.
⚪ The Structural Assumption
This indicator is built on a core market structure observation:
After each strong trend impulse, the market typically enters a “cooling-off” phase as profit-taking occurs and counter-trend participants enter. This often results in a shallow pullback or stall, creating a slight negative slope in an uptrend (or a positive slope in a downtrend).
These “cooling-off” phases don’t reverse the trend — they signal temporary pressure before the next leg continues. By tracking trend steps discretely and filtering for this behavior, Trend Impulse Channels helps traders align with the rhythm of impulse → pause → impulse.
█ How It Works
⚪ Step-Based Trend Engine
At the heart of this tool is a dynamic step engine that progresses only when price crosses a predefined ATR-scaled trigger level:
Trigger Threshold (× ATR) – Defines how far price must break beyond the current trend state to register a new trend step.
Step Size (Volatility-Guided) – Each trend continuation moves the trend line in discrete units, scaling with ATR and trend persistence.
Trend Direction State – Maintains a +1/-1 internal bias to support directional filters and step tracking.
⚪ Volatility-Adaptive Channel
Each step is wrapped inside a dynamic envelope scaled to current volatility:
Upper and Lower Bands – Derived from ATR and band multipliers to expand/contract as volatility changes.
⚪ Retest Signal System
Optional signal markers show when price re-tests the upper or lower band:
Upper Retest → Pullback into resistance during a bearish trend.
Lower Retest → Pullback into support during a bullish trend.
⚪ Trend Step Signals
Circular markers can be shown to mark each time the trend steps forward, making it easy to identify structurally significant moments of continuation within a larger trend.
█ How to Use
⚪ Trend Alignment
Use the Trend Line and Step Markers to visually confirm the direction of momentum. If multiple trend steps occur in sequence without reversal, this typically signals strong conviction and trend persistence.
⚪ Retest-Based Entries
Wait for pullbacks into the channel and monitor for triangle retest signals. When used in confluence with trend direction, these offer high-quality continuation setups.
⚪ Breakouts
Look for breakouts beyond the upper or lower band after a longer period of pause. For higher likelihood of success, look for breakouts in the direction of the trend.
█ Settings
Trigger Threshold (× ATR) - Defines how far price must move to register a new trend step. Controls sensitivity to trend flips.
Max Step Size (× ATR) - Caps how far each trend step can extend. Prevents runaway step expansion in high volatility.
Band Multiplier (× ATR) - Expands the upper and lower channels. Controls how much breathing room the bands allow.
Trend Hold (bars) - Minimum number of bars the trend must remain active before allowing a flip. Helps reduce noise.
Filter by Trend - Restrict retest signals to those aligned with the current trend direction.
-----------------
Disclaimer
The content provided in my scripts, indicators, ideas, algorithms, and systems is for educational and informational purposes only. It does not constitute financial advice, investment recommendations, or a solicitation to buy or sell any financial instruments. I will not accept liability for any loss or damage, including without limitation any loss of profit, which may arise directly or indirectly from the use of or reliance on such information.
All investments involve risk, and the past performance of a security, industry, sector, market, financial product, trading strategy, backtest, or individual's trading does not guarantee future results or returns. Investors are fully responsible for any investment decisions they make. Such decisions should be based solely on an evaluation of their financial circumstances, investment objectives, risk tolerance, and liquidity needs.
