Previous Day High Low Strategy only for LongWelcome to the "Previous Day High Low Strategy only for Long"!.
This strategy aims to identify potential long trading opportunities based on the previous day's high and low prices, along with certain market strength conditions.
Key Features:
Entry Conditions: The strategy triggers a long position when the current day's closing price crosses above the previous day's high or low.
Market Strength Filter: The strategy incorporates a market strength filter using the Average Directional Index (ADX). It only takes long positions when the ADX value is above a specific threshold and when there is a predominance of upward movement.
Trade Timing: The strategy operates within a specified trade window, starting at 09:30 and ending at 15:10. Positions are closed at 15:15 if still active.
Risk Management: The strategy employs dynamic stop-loss and profit-taking levels based on a user-defined Max Profit value. It has three profit targets (T1, T2, T3) and a stop-loss level to manage risk effectively.
Rules:
Ensure that the strategy idea is clearly understandable. Provide an easy-to-read title and a thoughtful description explaining the reasoning behind the strategy.
All content should be ad-free. Avoid any form of promotion, advertising, or solicitation.
No fundraising requests or money solicitation is allowed on TradingView.
Publish in the same language as the TradingView subdomain you're on, except for script titles, which must be in English.
Don't plagiarize. Create and share only unique content, and always give credit when using someone else's work.
Be respectful, kind, and constructive when engaging with others.
Zero tolerance for contentious political discourse, defamatory, threatening, or discriminatory remarks.
Avoid sharing harmful, misleading, or inappropriate content.
Respect the moderators' work and address complaints privately.
Use only your original account and avoid creating duplicate or fake accounts.
Do not attempt to manipulate the reputation system or engage in like-for-like schemes.
Explanation of how the strategy works
1. Previous Day's High and Low (HH, LL):
In this strategy, we start by obtaining the high and low prices of the previous day (not the current day) using the request.security function. This function allows us to access historical data for a specific time frame. The high and low prices are stored in the variables HH and LL, respectively.
2. Entry Conditions:
The strategy uses two conditions to trigger a long position:
Condition 1 (Long Condition 1): If the closing price of the current day crosses above the previous day's high (HH), it generates a long signal. This is achieved using the ta.crossover function, which detects when a crossover occurs.
Condition 2 (Long Condition 2): Similarly, if the closing price of the current day crosses above the previous day's low (LL), it also generates a long signal.
Combined Condition: To take long positions, the strategy combines both long conditions using the logical OR operator (or). This means that if either of the two conditions is met, a long position will be initiated.
3. Market Strength Filter:
The strategy also includes a filter based on the Average Directional Index (ADX) to gauge the market's strength before taking long positions. The ADX measures the strength of a trend in the market. The higher the ADX value, the stronger the trend.
Calculation of ADX: The ADX is calculated using the adx function, which takes two parameters: LWdilength (DMI Length) and LWadxlength (ADX period).
Strength Condition (strength_up): The strategy requires that the ADX value should be above a threshold (11 in this case) and that there is a predominance of upward movement (up > down) before initiating a long position. The LWADX value is multiplied by 2.5 and compared to the highest value of LWADX from the last 4 periods using ta.highest(LWADX , 4). If these conditions are met, the variable strength_up is set to true.
Combined Condition: The strength_up condition is then combined with the long conditions using the logical AND operator (and). This means that the strategy will only take a long position if both the long conditions and the market strength condition are met.
4. Trade Timing:
The strategy sets a specific trade window between 09:30 and 15:10. It will only execute trades within this time frame (TradeTime).
5. Risk Management:
The strategy implements dynamic stop-loss (SL) and profit-taking levels (T1, T2, T3) based on a user-defined Max Profit value. The stop-loss is set as a percentage of the Max Profit value. As the position moves in favor of the trader, the profit targets are adjusted accordingly.
6. Position Management:
The strategy uses the strategy.entry function to enter long positions based on the combined entry conditions. Once a position is open, the script uses strategy.exit to define the exit condition when either the profit target or stop-loss level is hit. The strategy.close function is used to close any open position at the end of the trade window (15:15).
7. Plotting:
The strategy uses the plot function to visualize the previous day's high and low prices, as well as the stop-loss (SL) and profit-taking (T1, T2, T3) levels on the chart.
Overall, the "Previous Day High Low Strategy only for Long" aims to identify potential long trading opportunities based on the previous day's price action and market strength conditions. However, as with any trading strategy, it's essential to thoroughly test it and consider risk management before applying it to real-world trading scenarios.
Disclaimer:
The information presented by this strategy is for educational purposes only and should not be considered as investment advice. The strategy is not designed for qualified investors. Always conduct your own research and consult with a financial advisor before making any trading decisions.
Remember, the success of any trading strategy depends on various factors, including market conditions, risk management, and individual trading skills. Past performance is not indicative of future results.
Pesquisar nos scripts por "tradingview界面调整"

Multiple Exponential Moving AveragesThe "Multiple Exponential Moving Averages" indicator is a custom technical analysis tool created for TradingView. It combines five different Exponential Moving Averages (EMAs) into a single indicator. Each EMA has a user-defined length, and they are plotted on the chart with different colors to differentiate them.
Exponential Moving Averages are commonly used in technical analysis to smooth out price data and identify trends. They give more weight to recent price data, making them more responsive to recent price changes than Simple Moving Averages (SMAs). By combining multiple EMAs with different lengths, TradingView users will no longer have to worry that they will run out of slots when wanting to add new indicators to their chart.

Highest High and lowest low - Sachin Wakpaijan
The "Highest High and Lowest Low" indicator, created by Sachin Wakpaijan, is a powerful tool designed to identify the highest high and lowest low in a trading instrument's price history. This indicator can be used on TradingView to gain insights into significant price levels and potential trend reversals.
Inputs:
Display Emoji: This input parameter enables or disables the display of emoji symbols on the chart.
Functionality:
The indicator calculates the highest high and lowest low based on the price history. It performs the following steps:
Highest High Calculation: The indicator calculates the highest high by comparing the current high with the previously recorded highest high. If a new high is found, the highest high is updated. The lowest low is set to the highest high.
Lowest Low Calculation: The indicator calculates the lowest low based on the current low. If a new low is found, the lowest low is updated, and the highest after the low is set to the lowest low.
Checking for Highest After Low: If the current high exceeds the highest after the low, the highest after the low is updated.
Plotting: The indicator plots the highest high, highest after low, and lowest high on the chart. Additionally, it displays emoji symbols on the chart based on specific conditions, such as the highest high and the relationship between the high and the open/close prices.
Usage:
The "Highest High and Lowest Low" indicator can be applied to any trading instrument and time frame. It helps traders identify significant price levels, potential trend reversal points, and gauge the strength of price movements. The indicator's customizable input parameter allows users to adjust the visual appearance according to their preferences.
Note:
This indicator is provided for informational purposes only and should not be considered as financial advice. Traders should conduct thorough analysis and use additional indicators or techniques to validate their trading decisions.
Author:
This indicator was created by Sachin Wakpaijan. You can find more of their work on TradingView.
Disclaimer:
Trading involves risks, and it is essential to understand and acknowledge the risks associated with trading before making any investment decisions. The author do not assume any responsibility for any trading losses incurred as a result of using this indicator.

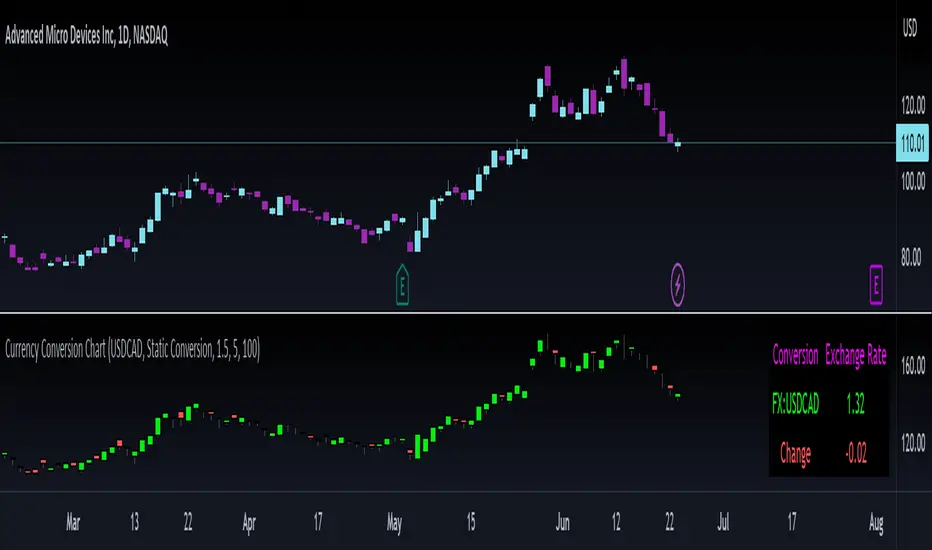
Currency Conversion ChartReleasing this utility indicator I made for myself and thought others may find it helpful.
It is a simple currency conversion indicator. I personally trade both the TSX and the NYSE and hold both CAD and USD. As such, when I take positions in either or, I like to track how the currency I hold is affecting my position.
What the indicator does:
So, as indicated above, it converts a ticker's candlestick chart into the designated currency. You can either manually set the currency exchange rate, or search the currency exchange chart on Tradingview and it will auto-convert:
Purple arrow: The purple arrow points to the auto-input. You can search the currency you want to convert and it will automatically apply the conversion. It defaults to USD to CAD, but you can do USD to JPY, AUD to CAD, whatever currency you want provided it is available on tradingview. Alternatively, you can select manual conversion and input the manual conversion rate to apply.
Green Arrow: The green arrow refers to the conversion type. The indicator will default to static auto. This will pull the previous daily close. As currency trades at all hours, real-time is not advisable because the currency is in constant flux. Static will provide more stable results. However, you can toggle between the two. You can also just toggle Manual conversion.
Yellow arrow and red arrow: These pertain to position management. The indicator will display the change in the currency price over the designated amount of days. If you want to know how much the currency has changed in price over the last 7 or 20 days, simply put that value in the change input.
When you click manage position, you can fill out the position size variable and put the number of days you have had the position in the change parameter. This is the cost of your position. It can be options or shares. It will then adjust your position cost for the current change in the currency based on the number of days you have held it.
The indicator can be viewed on any timeframe and you can see how the conversion price compares to the listed price.
And that's basically the indicator! Its a simple utility indicator and hopefully some people will find use from it like I do!
Safe trades everyone, take care.
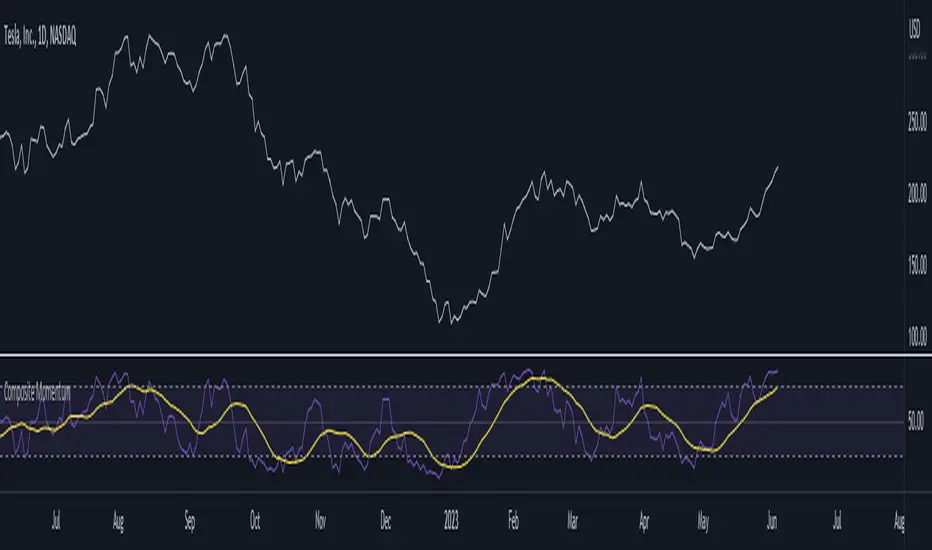
Composite MomentumComposite Momentum Indicator - Enhancing Trading Insights with RSI & Williams %R
The Composite Momentum Indicator is a powerful technical tool that combines the Relative Strength Index (RSI) and Williams %R indicators from TradingView. This unique composite indicator offers enhanced insights into market momentum and provides traders with a comprehensive perspective on price movements. By leveraging the strengths of both RSI and Williams %R, the Composite Momentum Indicator offers distinct advantages over a simple RSI calculation.
1. Comprehensive Momentum Analysis:
The Composite Momentum Indicator integrates the RSI and Williams %R indicators to provide a comprehensive analysis of market momentum. It takes into account both the strength of recent price gains and losses (RSI) and the relationship between the current closing price and the highest-high and lowest-low price range (Williams %R). By combining these two momentum indicators, traders gain a more holistic view of market conditions.
2. Increased Accuracy:
While the RSI is widely used for measuring overbought and oversold conditions, it can sometimes generate false signals in certain market environments. The Composite Momentum Indicator addresses this limitation by incorporating the Williams %R, which focuses on the price range and can offer more accurate signals in volatile market conditions. This combination enhances the accuracy of momentum analysis, allowing traders to make more informed trading decisions.
3. Improved Timing of Reversals:
One of the key advantages of the Composite Momentum Indicator is its ability to provide improved timing for trend reversals. By incorporating both RSI and Williams %R, traders can identify potential turning points more effectively. The Composite Momentum Indicator offers an early warning system for identifying overbought and oversold conditions and potential trend shifts, helping traders seize opportunities with better timing.
4. Enhanced Divergence Analysis:
Divergence analysis is a popular technique among traders, and the Composite Momentum Indicator strengthens this analysis further. By comparing the RSI and Williams %R within the composite calculation, traders can identify divergences between the two indicators more easily. Divergence between the RSI and Williams %R can signal potential trend reversals or the weakening of an existing trend, providing valuable insights for traders.
5. Customizable Moving Average:
The Composite Momentum Indicator also features a customizable moving average (MA), allowing traders to further fine-tune their analysis. By incorporating the MA, traders can smooth out the composite momentum line and identify longer-term trends. This additional layer of customization enhances the versatility of the indicator, catering to various trading styles and timeframes.
The Composite Momentum Indicator, developed using the popular TradingView indicators RSI and Williams %R, offers a powerful tool for comprehensive momentum analysis. By combining the strengths of both indicators, traders can gain deeper insights into market conditions, improve accuracy, enhance timing for reversals, and leverage divergence analysis. With the added customization of the moving average, the Composite Momentum Indicator provides traders with a versatile and effective tool to make more informed trading decisions.
FibonRSI / ErkOziHello,
This software is a technical analysis script written in the TradingView Pine language. The script creates a trading indicator based on Fibonacci retracement levels and the RSI indicator, providing information about price movements and asset volatility by using Bollinger Bands.
There are many different scripts in the market that draw RSI and Fibonacci retracement levels. However, this script was originally designed by me and shared publicly on TradingView.
***The indicator uses RSI (Relative Strength Index) and Bollinger Bands (BB) as the basis for the FibonRSI strategy. RSI measures the strength of a price movement, and BB measures the volatility of an asset. The FibonRSI strategy is based on the idea that the Fibonacci ratios and RSI can be used to predict a asset's price retracement levels.
***The script allows for various parameters to be adjusted. Users can specify the price source type and adjust the periods for RSI and Bollinger Bands. The standard deviation number for Bollinger Bands can also be customized.
***The script calculates the current RSI indicator position and the basic, upper, and lower levels of Bollinger Bands. It then calculates and draws the Fibonacci retracement levels. The color of the RSI line is determined by the upper and lower distribution levels of Bollinger Bands. Additionally, the color of the Fibonacci retracement levels can also be customized by the user.
***This script can be used to determine potential buy and sell signals using Fibonacci retracement levels and RSI. For example, when the RSI is oversold and the price is close to a Fibonacci retracement level, it can be interpreted as a buying opportunity. Similarly, when the RSI is overbought and the price is close to a Fibonacci retracement level, it can be interpreted as a selling opportunity.
***The script takes input parameters such as the price source used for calculation, the period for the RSI indicator, the period for the Moving Average in Bollinger Bands, and the number of standard deviations used in Bollinger Bands.
***The script's conditions include elements such as calculating the current position of the RSI indicator, calculating the upper and lower Bollinger Bands, calculating the dispersion factor, and calculating Fibonacci levels.
***The parameters in the code can be adjusted for calculation, including the price type used, the RSI period, the Moving Average period for BB, and the standard deviation count for BB. After this, the current position of the RSI, Moving Average, and standard deviation for BB are calculated. After calculating the upper and lower BB, the levels above and below the average are calculated using a specific dispersion constant.
CONDITIONS FOR THE SCRIPT
current_rsi = ta.rsi(src, for_rsi) // Current position of the RSI indicator
basis = ta.ema(current_rsi, for_ma)
dev = for_mult * ta.stdev(current_rsi, for_ma)
upper = basis + dev
lower = basis - dev
dispersion = 1
disp_up = basis + (upper - lower) * dispersion
disp_down = basis - (upper - lower) * dispersion
// Fibonacci Levels
f100 = basis + (upper - lower) * 1.0
f78 = basis + (upper - lower) * 0.78
f65 = basis + (upper - lower) * 0.65
f50 = basis
f35 = basis - (upper - lower) * 0.65
f23 = basis - (upper - lower) * 0.78
f0 = basis - (upper - lower) * 1.0
***When calculating Fibonacci levels, the distance between the average of BB and the upper and lower BB is used. These levels are 0%, 23.6%, 35%, 50%, 65%, 78.6%, and 100%. Finally, the RSI line that changes color according to a specific RSI position, Fibonacci levels, and BB are visualized. Additionally, the levels of 70, 30, and 50 are also shown.
The script then sets the color of the RSI position according to the EMA and draws Bollinger Bands, RSI, Fibonacci levels, and the 70, 30, and 50 levels.
In conclusion, this script enables traders to analyze market trends and make informed decisions. It can also be customized to suit individual trading strategies.
This script analyzes the RSI indicator using Bollinger Bands and Fibonacci levels. The default settings are 14 periods for RSI, 233 periods and 2 standard deviations for BB. The MA period inside BB is selected as the BB period and is used when calculating Fibonacci levels.
***The reason for selecting these settings is to provide enough time for BB period to confirm a possible trend. Additionally, the MA period inside BB is matched with the BB period and used when calculating Fibonacci levels.
***Fibonacci levels are calculated from the distance between the upper and lower bands of BB and show how RSI movement is related to these levels. Better results can be achieved when RSI periods are set to Fibonacci numbers such as 21, 55, and 89. Therefore, the use of Fibonacci numbers is recommended when adjusting RSI periods. Fibonacci numbers are among the technical analysis tools that can capture the reflection of naturally occurring movements in the market. Therefore, the use of Fibonacci numbers often helps to better track fluctuations in the market.
Finally, the indicator also displays the 70 and 30 levels and the middle level (50) with Fibonacci levels drawn in circles. Changing these settings can help optimize the Fibonacci levels and further improve the indicator.
Thank you in advance for your suggestions and opinions......

4 Pole ButterworthTitle: 4 Pole Butterworth Filter: A Smooth Filtering Technique for Technical Analysis
Introduction:
In technical analysis, filtering techniques are employed to remove noise from time-series data, helping traders to identify trends and make better-informed decisions. One such filtering technique is the 4 Pole Butterworth Filter. In this post, we will delve into the 4 Pole Butterworth Filter, explore its properties, and discuss its implementation in Pine Script for TradingView.
4 Pole Butterworth Filter:
The Butterworth filter is a type of infinite impulse response (IIR) filter that is widely used in signal processing applications. Named after the British engineer Stephen Butterworth, this filter is designed to have a maximally flat frequency response in the passband, meaning it does not introduce any distortions or ripples in the filtered signal.
The 4 Pole Butterworth Filter is a specific type of Butterworth filter that utilizes four poles in its transfer function. This design provides a steeper roll-off between the passband and the stopband, allowing for better noise reduction without significantly affecting the underlying data.
Why Choose the 4 Pole Butterworth Filter for Smoothing?
The 4 Pole Butterworth Filter is an excellent choice for smoothing in technical analysis due to its maximally flat frequency response in the passband. This property ensures that the filtered signal remains as close as possible to the original data, without introducing any distortions or ripples. Additionally, the 4 Pole Butterworth Filter provides a steeper roll-off between the passband and the stopband, enabling better noise reduction while preserving the essential features of the data.
Implementing the 4 Pole Butterworth Filter:
In Pine Script, we can implement the 4 Pole Butterworth Filter using a custom function called `fourpolebutter`. The function takes two input parameters: the source data (src) and the filter length (len). The filter length determines the cutoff frequency of the filter, which in turn affects the amount of smoothing applied to the data.
Within the `fourpolebutter` function, we first calculate the filter coefficients based on the filter length. These coefficients are essential for calculating the output of the filter at each data point. Next, we compute the filtered output using a recursive formula that involves the current and previous data points as well as the filter coefficients.
Finally, we create a script that takes user inputs for the source data and filter length and plots the 4 Pole Butterworth Filter on a TradingView chart.
By adjusting the input parameters, users can configure the 4 Pole Butterworth Filter to suit their specific requirements and improve the readability of their charts.
Conclusion:
The 4 Pole Butterworth Filter is a powerful smoothing technique that can be used in technical analysis to effectively reduce noise in time-series data. Its maximally flat frequency response in the passband ensures that the filtered signal remains as close as possible to the original data, while its steeper roll-off between the passband and the stopband provides better noise reduction. By implementing this filter in Pine Script, traders can easily integrate it into their trading strategies and enhance the clarity of their charts.

Average Cost (Costo Promedio)ENGLISH
This 'Average Cost' script allows the user to input and visualize profit or loss for different stocks (up to 50) with average cost and quantity data on a single chart. This is useful for tracking the profit or loss of each stock in real-time.
To use this script, the user should follow these steps:
1. Add the 'Average Cost' script to your TradingView chart.
2. In the script's configuration window, input the tickers, average costs, and quantity of shares for each ticker you want to monitor.
3. Click 'Accept' to apply the changes.
This script is primarily designed for stock markets, but can also be useful in other financial markets where the user is interested in tracking the performance of multiple assets.
ESPAÑOL
Este script de "Costo Promedio" permite al usuario ingresar y visualizar si hay ganancia o perdida para diferentes acciones (hasta 50) con los datos de costos promedio y cantidad de acciones en un solo gráfico. Esto es útil para realizar un seguimiento de la ganancia o pérdida de cada acción en tiempo real.
Para utilizar este script, el usuario debe seguir estos pasos:
1. Agregue el script "Costo Promedio" a su gráfico en TradingView.
2. En la ventana de configuración del script, ingrese los tickers, costos promedio y cantidad de acciones para cada ticker que desee monitorear.
3. Haga clic en "Aceptar" para aplicar los cambios.
Este script está diseñado principalmente para los mercados de acciones, pero también puede ser útil en otros mercados financieros donde el usuario esté interesado en rastrear el rendimiento de múltiples activos.

Number Formatting Indian/USAThis is a Pine script that helps traders format numbers in different ways to make it easier to read and display big numbers on TradingView.
this script is specifically to help other fellow pinecoder. Its not a indicator.
The above code is an example of how to format numbers in TradingView using two different formats: Indian and USA. The code defines a function called `formatNumber()` which takes two arguments: num (the number to format) and format (the format to use - either "Indian" or "USA").
If the "Indian" format is selected, the function rounds the number to the nearest crore, lakh or thousand and adds the appropriate suffix (i.e. "Cr", "Lac" or "K"). If the "USA" format is selected, the function rounds the number to the nearest billion, million or thousand and adds the appropriate suffix (i.e. "B", "M" or "K").
In both cases, the function then adds commas to the formatted number. The example usage shows how to call the `formatNumber()` function with a given number and format, and then plot the formatted number as a label on the chart.

Dark Energy Divergence OscillatorThe Dark Energy Divergence Oscillator (DEDO)
What makes The Universe grow at an accelerating pace?
Dark Energy.
What makes The Economy grow at an accelerating pace?
Debt.
Debt is the Dark Energy of The Economy.
I pronounce DEDO "Deed-oh", but variations are fine with me.
Note: The Pine Script version of DEDO is improved from the original formula, which used a constant all-time high calculation in the normalization factor. This was technically not as accurate for calculating liquidity pressure in historical data because it meant that historical prices were being tested against future liquidity factors. Now using Pine, the functions can be normalized for the bar at the time of calculation, so the liquidity factors are normalized per candle, not across the entire series, which feels like an improvement to me.
Thought Process:
It's all about the liquidity. What I started with is a correlation between major stock indices such as SPX and WRESBAL , a balance sheet metric on FRED
After September 2008, when QE was initiated, many asset valuations started to follow more closely with liquidity factors. This led me to create a function that could combine asset prices and liquidity in WRESBAL , in order to calculate their divergence and chart the signal in TradingView.
The original formula:
First, we don't want "non-QE" data. we only want data for the market affected by QE .
So, find SPX on the day of pre-QE: 1255.08 and subtract that from the 2022 top 4818.62 = 3563.54
With this post-QE SPX range, now you can normalize the price level simply by dividing by the range = ( SPX -1255.08)/3563.54)
Normalization produces values from 0 to 1 so that they can be compared with other normalized figures.
In order to test the 0 to 1 normalized SPX range measure against the liquidity number, WRESBAL , it's the same idea: normalize it using the max as the denominator and you get a 0 to 1 liquidity index:
( WRESBAL /4276000000000)
Subtract one from the other to get the divergence:
(( WRESBAL /4276000000000)-(( SPX -1255.08)/3563.54))*10
x10 to reduce decimal places, but this option is configurable in DEDO's input settings tab.
Positive values indicate there's ample liquidity to hold up price or even create bullish momentum in some cases. Negative values mean price levels are potentially extended beyond what liquidity levels can support.
Note: many viewers of the charts on social media wanted the values to go down in alignment with price moving down, so inverting the chart is what I do with Option + I. I like the fact that negative values represent a deficit in liquidity to hold up price but that's just me.
Now with Pine Script and some help from other liquidity focused accounts on TradingView , I was able to derive a script that includes central bank liquidity and Reverse Repo liquidity drain, all in one algorithm, with adjustable settings.
Central bank assets included in this version:
-JPY (Japan)
-CNY (China)
-UK (British Pound)
-SNB (Swiss National Bank)
-ECB (European Central Bank )
Central Bank assets can be adjusted to an allocation % so that the formula is adjusted for the market cap of the asset.
A handy table in the lower right corner displays useful information about the asset market cap, and percentage it represents in the liquidity pool.
Reverse repo soak is also an optional addition in the Input settings using the RRPONTSYD value from FRED. This value is subtracted from global liquidity used to determine divergence since it is swept away from markets when residing in the Fed's reverse repo facility.
There is an option to draw a line at the Zero bound. This provides a convenience so that the line doesn't keep having to be redrawn on every chart. The normalized equation produces a value that should oscillate around zero, as price/valuation grows past liquidity support, falls under it, and repeats in cycles.

TOMMAR#TOMMAR #MultiMovingAverages #MMAR
Dear fellow traders, this is Tommy, and today I'd like to introduce you to the Multi-Moving Averages Ribbon (MMAR) indicator, which I believe to be one of the best MMAR indicators available on TradingView. Moving Averages is a popular technical analysis tool used to smooth out price data by creating an average of past price data points over a specified time period. They can be used to identify trends and provide a clearer view of price action, as well as generate buy and sell signals by observing crossovers between different moving average lines.
In the MMAR indicator, we have incorporated 12 different types of Moving Averages, including Simple Moving Averages (SMA), Exponential Moving Averages (EMA), Weighted Moving Averages (WMA), Hull Moving Averages (HMA), and Smoothed Moving Averages (SMMA), among others. This allows traders to choose the optimal type for their preferred trading commodities.
One common technique in technical analysis is using multiple Moving Averages with varying lengths, which provides a more comprehensive view of price action. By analyzing multiple Moving Averages with different timeframes, traders can better understand both short- and long-term trends and make more informed trading decisions. Some of the well-known combinations of multiple moving averages used by traders are (5, 9, 14, 21, 45), (6, 11, 16, 22, 51), [8, 13, 21, 55), (50, 100, 200), and (60, 120, 240).
Another way to gauge the strength of the market trend is to look for the arrangement of the Moving Averages. If they are in a sequential order, with the shortest on top and the longest on the bottom, it is most likely a bullish trend. On the other hand, if they are arranged in reverse order, with the shortest on the bottom and the longest on top, it is most likely a bearish trend. The 'Trend Light' in the indicator settings will automatically signal when the Moving Averages are in either an orderly or reverse arrangement.
Lastly, I have added a useful feature to the indicator: the 'MA Projection'. This feature projects and forecasts the Moving Averages in the future, allowing traders to easily identify confluence zones in future candlesticks. Please note that the projection levels may change in the case of extreme price action that significantly affects the Moving Averages.
This is free so any Tradingview users can use this indicator. Just search TOMMAR in the indicator section located on top of the chart.
#TOMMAR #MultiMovingAverages #MMAR
안녕하세요 트레이더 여러분, 토미입니다. 오늘 여러분들에게 소개드릴 지표는 다양한 길이의 이동평균선 조합을 사용할 수 있는 MMAR (Multiple Moving Averages Ribbon)입니다. 아마 제가 만든 MMAR 지표가 트레이딩뷰에서 가장 쓸만할 겁니다. 이동평균선, 줄여서 이평선은 말 그대로 특정 기간 범위 내의 주가들을 평균한 값들로 이루어진 선입니다. 제가 이평선 관련된 강의 자료는 예전에 올려드린 바 있으니 더 자세한 내용이 궁금하신 분들은 아래 링크/이미지 클릭하시길 바랍니다.
본 지표는 Simple Moving Averages (SMA), Exponential Moving Averages (EMA), Weighted Moving Averages (WMA), Hull Moving Averages (HMA), 그리고 Smoothed Moving Averages (SMMA) 등을 포함해 총 12개 종류의 이평선 지표를 사용할 수 있습니다. 또한 각 이평선의 길이들도 하나하나 일일이 설정하실 수 있습니다. 예를 들어 요즘에 자주 보이는 이평선들의 조합이 , , , , 그리고 등등이 존재하는데 여러분의 취향에 맞게 설정하여 사용하시면 됩니다.
몇 가지 주요 기능에 대해서 설명 드리겠습니다. 설정에서 ‘Trend Light’를 키면 이평선들의 정배열 혹은 역배열 여부를 쉽게 볼 수 있습니다. 이평선이 정배열일때는 맨 아래의 이평선에 초록불이, 역배열일때는 맨 위의 이평선에 빨간불이 켜지며 둘 다 아닐 땐 아무 불도 켜지지 않습니다. 또한 ‘MA Projection’을 키면 이평선들의 미래 예측 값들을 확장해줍니다. 당연히 가격 변동이 갑자기 크게 나오면 이평선 예측 확장 레벨들이 확 바뀌겠죠.
지표창에 TOMMAR 검색하시거나 아래 즐겨찾기 인디케이터에 넣기 클릭하시면 누구나 사용하실 수 있습니다~ 여러분의 구독, 좋아요, 댓글은 저에게 큰 힘이 됩니다.

RSI Multi Alerts MTFThis indicator won't plot anything to the chart.
Please follow steps below to set your alarms based on RSI oversold and overbought levels:
1) Add indicator to the chart
2) Go to settings
3) Choose up to 8 different symbols to get alert notification
4) Choose up to 4 different timeframes
5) Set overbought and oversold levels
6) Once all is set go back to the chart and click on 3 dots to set alert in this indicator, rename your alert and confirm
7) You can remove indicator after alert is set and it'll keep working as expected
What is does:
This indicator will generate alerts based on symbols, timeframes and RSI levels settings.
It will consider overbought and oversold levels to alert in each symbol and each timeframe selected. Once these levels are achieved it will send an alert with the following information:
- Symbol name (BTC, ETH, LTC)
- Specific RSI level achieved (e.g: RSI 30, RSI 70 or any custom level)
- Timeframe (e.g: 5m, 1h, 1D)
- Current symbol price
This script will request RSI OB/OS information through request.security() function from all different symbols and timeframes settings. It also requests symbols' price (close).
Due to Tradingview limitation (40 requests calls) it can only request information for 8 symbols for this script (8 symbols X 4 timeframes = 32 + 8 symbols' price (close) = 40)
Standard symbols are Binance USDT-M Futures but you can choose any symbol from Tradingview.
Standard timeframes are 5m|15m|1h|4h but you can choose from a list.
Standard overbought and oversold levels are 70 and 30 but you can change it to other integer values.
Feel free to give feedbacks on comments section below.
Enjoy!
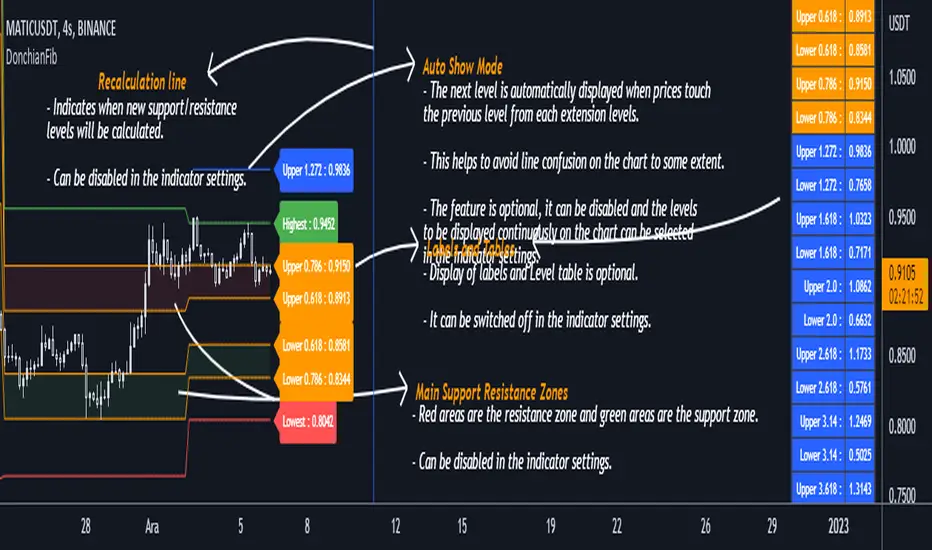
DonchianFib[Akcay]How does it work?
- The indicator detects the highest and lowest price level in the last x periods every time prices advance by x periods.
- From these values, retracement (0.618, 0.786) and expansion levels (1.272, 1.618, 2, 2.618, 3.14, 3.618, 4.236) are obtained.
- Since the symmetrical counterpart of the retracement levels is used, there are two of each of the 0.618 and 0.786 lines, for a total of four.
How can it be used?
- It can be used for step buying.
- It can be used for step selling.
- Can be used to set a profit target.
- Can be used to set a stop target.
- This indicator can be used in the same way as Pivot levels can be used. You can think of this indicator like the Pivot Points Standard indicator, where you set the period more flexibly.
Which indicators can it be combined with?
- I don't think there are any limitations, but I think it is compatible with trend detection indicators, trend detection with DonchianFib, and stepped buy/sell with limit orders.
- If you want to enter a position with mismatch signals, you can wait for the DonchianFib levels to break.
- Its use is limited by your imagination :)
Where does the name come from?
- As the name suggests, Donchian Channels. I was inspired by Donchian Channels when developing the indicator. Donchian channels show the highs and lows of prices over the last x number of periods. DonchianFib does this once for every x periods and uses the fibonacci levels to create upper and intermediate levels.
Note : I don't know if such an indicator has been done before or not. If it has been done, I haven't seen it in tradingview.
Çalışma mantığı nedir ?
- Gösterge, fiyatlar her x periyot kadar ilerlediğinde son x periyot içerisindeki en yüksek ve en düşük fiyat seviyesini tespit eder.
- Bu değerler üzerinden geri çekilme (0.618, 0.786) ve genişleme seviyeleri (1.272, 1.618, 2, 2.618, 3.14, 3.618, 4.236) elde edilir.
- Geri çekilme seviyelerinin simetrik karşılığı kullanıldığından 0.618 ve 0.786 çizgilerinden her birinden iki adet olmak üzere toplamda dört adet bulunur.
Nasıl kullanılabilir ?
- Kademeli alım yapmak için kullanılabilir.
- Kademeli satım yapmak için kullanılabilir.
- Kâr hedefi belirlemek için kullanılabilir.
- Stop hedefi belirlemek için kullanılabilir.
- Pivot seviyelerinden nasıl faydalanılıyorsa bu göstergeden de aynı şekilde faydalanılabilir. Bu göstergeyi, periyodunu kendinizin daha esnek bir şekilde belirlediğiniz Pivot Noktalar Standartı göstergesi gibi düşünebilirsiniz.
Hangi göstergelerle kombine edilebilir ?
- Bunun için herhangi sınırlama yapmak doğru değil ancak trend tespit etmeye çalışan göstergelerle uyumlu olduğunu düşünüyorum. Bu göstergeler ile trend tespiti yapıp DonchianFib ile alım/satım yerleri belirlenebilir ve limit emirleri ile kademeli alım/satım yapılabilir.
- Uyuşmazlık sinyalleri ile pozisyona girilmek isteniliyorsa DonchianFib seviyelerinin kırılması beklenebilir.
- Kullanımı sizin hayal gücünüz ile sınırlıdır :)
Adı nereden geliyor ?
- Adından da anlaşılacağı üzere Donchian Kanallarından. Göstergeyi geliştirirken Donchian Kanallarından ilham aldım. Donchian kanalları fiyatların son x periyot içerisindeki en yüksek ve en düşük seviyelerini grafikte gösteriyor. DonchianFib ise bunu her x periyot için bir defa yapıp, fibonacci seviyelerini de kullanarak üst ve ara seviyeler oluşturuyor.
Not : Daha önce böyle bir göstergenin yapılıp yapılmadığını bilmiyorum. Yapıldı ise ben tradingview'da görmedim.
WaveTrend 3D█ OVERVIEW
WaveTrend 3D (WT3D) is a novel implementation of the famous WaveTrend (WT) indicator and has been completely redesigned from the ground up to address some of the inherent shortcomings associated with the traditional WT algorithm.
█ BACKGROUND
The WaveTrend (WT) indicator has become a widely popular tool for traders in recent years. WT was first ported to PineScript in 2014 by the user @LazyBear, and since then, it has ascended to become one of the Top 5 most popular scripts on TradingView.
The WT algorithm appears to have origins in a lesser-known proprietary algorithm called Trading Channel Index (TCI), created by AIQ Systems in 1986 as an integral part of their commercial software suite, TradingExpert Pro. The software’s reference manual states that “TCI identifies changes in price direction” and is “an adaptation of Donald R. Lambert’s Commodity Channel Index (CCI)”, which was introduced to the world six years earlier in 1980. Interestingly, a vestige of this early beginning can still be seen in the source code of LazyBear’s script, where the final EMA calculation is stored in an intermediate variable called “tci” in the code.
█ IMPLEMENTATION DETAILS
WaveTrend 3D is an alternative implementation of WaveTrend that directly addresses some of the known shortcomings of the indicator, including its unbounded extremes, susceptibility to whipsaw, and lack of insight into other timeframes.
In the canonical WT approach, an exponential moving average (EMA) for a given lookback window is used to assess the variability between price and two other EMAs relative to a second lookback window. Since the difference between the average price and its associated EMA is essentially unbounded, an arbitrary scaling factor of 0.015 is typically applied as a crude form of rescaling but still fails to capture 20-30% of values between the range of -100 to 100. Additionally, the trigger signal for the final EMA (i.e., TCI) crossover-based oscillator is a four-bar simple moving average (SMA), which further contributes to the net lag accumulated by the consecutive EMA calculations in the previous steps.
The core idea behind WT3D is to replace the EMA-based crossover system with modern Digital Signal Processing techniques. By assuming that price action adheres approximately to a Gaussian distribution, it is possible to sidestep the scaling nightmare associated with unbounded price differentials of the original WaveTrend method by focusing instead on the alteration of the underlying Probability Distribution Function (PDF) of the input series. Furthermore, using a signal processing filter such as a Butterworth Filter, we can eliminate the need for consecutive exponential moving averages along with the associated lag they bring.
Ideally, it is convenient to have the resulting probability distribution oscillate between the values of -1 and 1, with the zero line serving as a median. With this objective in mind, it is possible to borrow a common technique from the field of Machine Learning that uses a sigmoid-like activation function to transform our data set of interest. One such function is the hyperbolic tangent function (tanh), which is often used as an activation function in the hidden layers of neural networks due to its unique property of ensuring the values stay between -1 and 1. By taking the first-order derivative of our input series and normalizing it using the quadratic mean, the tanh function performs a high-quality redistribution of the input signal into the desired range of -1 to 1. Finally, using a dual-pole filter such as the Butterworth Filter popularized by John Ehlers, excessive market noise can be filtered out, leaving behind a crisp moving average with minimal lag.
Furthermore, WT3D expands upon the original functionality of WT by providing:
First-class support for multi-timeframe (MTF) analysis
Kernel-based regression for trend reversal confirmation
Various options for signal smoothing and transformation
A unique mode for visualizing an input series as a symmetrical, three-dimensional waveform useful for pattern identification and cycle-related analysis
█ SETTINGS
This is a summary of the settings used in the script listed in roughly the order in which they appear. By default, all default colors are from Google's TensorFlow framework and are considered to be colorblind safe.
Source: The input series. Usually, it is the close or average price, but it can be any series.
Use Mirror: Whether to display a mirror image of the source series; for visualizing the series as a 3D waveform similar to a soundwave.
Use EMA: Whether to use an exponential moving average of the input series.
EMA Length: The length of the exponential moving average.
Use COG: Whether to use the center of gravity of the input series.
COG Length: The length of the center of gravity.
Speed to Emphasize: The target speed to emphasize.
Width: The width of the emphasized line.
Display Kernel Moving Average: Whether to display the kernel moving average of the signal. Like PCA, an unsupervised Machine Learning technique whereby neighboring vectors are projected onto the Principal Component.
Display Kernel Signal: Whether to display the kernel estimator for the emphasized line. Like the Kernel MA, it can show underlying shifts in bias within a more significant trend by the colors reflected on the ribbon itself.
Show Oscillator Lines: Whether to show the oscillator lines.
Offset: The offset of the emphasized oscillator plots.
Fast Length: The length scale factor for the fast oscillator.
Fast Smoothing: The smoothing scale factor for the fast oscillator.
Normal Length: The length scale factor for the normal oscillator.
Normal Smoothing: The smoothing scale factor for the normal frequency.
Slow Length: The length scale factor for the slow oscillator.
Slow Smoothing: The smoothing scale factor for the slow frequency.
Divergence Threshold: The number of bars for the divergence to be considered significant.
Trigger Wave Percent Size: How big the current wave should be relative to the previous wave.
Background Area Transparency Factor: Transparency factor for the background area.
Foreground Area Transparency Factor: Transparency factor for the foreground area.
Background Line Transparency Factor: Transparency factor for the background line.
Foreground Line Transparency Factor: Transparency factor for the foreground line.
Custom Transparency: Transparency of the custom colors.
Total Gradient Steps: The maximum amount of steps supported for a gradient calculation is 256.
Fast Bullish Color: The color of the fast bullish line.
Normal Bullish Color: The color of the normal bullish line.
Slow Bullish Color: The color of the slow bullish line.
Fast Bearish Color: The color of the fast bearish line.
Normal Bearish Color: The color of the normal bearish line.
Slow Bearish Color: The color of the slow bearish line.
Bullish Divergence Signals: The color of the bullish divergence signals.
Bearish Divergence Signals: The color of the bearish divergence signals.
█ ACKNOWLEDGEMENTS
@LazyBear - For authoring the original WaveTrend port on TradingView
@PineCoders - For the beautiful color gradient framework used in this indicator
@veryfid - For the inspiration of using mirrored signals for cycle analysis and using multiple lookback windows as proxies for other timeframes

[MT] Strategy Backtest Template| Initial Release | | EN |
An update of my old script, this script is designed so that it can be used as a template for all those traders who want to save time when programming their strategy and backtesting it, having functions already programmed that in normal development would take you more time to program, with this template you can simply add your favorite indicator and thus be able to take advantage of all the functions that this template has.
🔴Stop Loss and 🟢Take Profit:
No need to mention that it is a Stop Loss and a Take Profit, within these functions we find the options of: fixed percentage (%), fixed price ($), ATR, especially for Stop Loss we find the Pivot Points, in addition to this, the price range between the entry and the Stop Loss can be converted into a trailing stop loss, instead, especially for the Take Profit we have an option to choose a 1:X ratio that complements very well with the Pivot Points.
📈Heikin Ashi Based Entries:
Heikin Ashi entries are trades that are calculated based on Heikin Ashi candles but their price is executed to Japanese candles, thus avoiding false results that occur in Heikin candlestick charts, this making in certain cases better results in strategies that are executed with this option compared to Japanese candlesticks.
📊Dashboard:
A more visual and organized way to see the results and necessary data produced by our strategy, among them we can see the dates between which our operations are made regardless if you have activated some time filter, usual data such as Profit, Win Rate, Profit factor are also displayed in this panel, additionally data such as the total number of operations, how many were gains and how many losses, the average profit and loss for each operation and finally the maximum profits and losses followed, which are data that will be very useful to us when we elaborate our strategies.
Feel free to use this template to program your own strategies, if you find errors or want to request a new feature let me know in the comments or through my social networks found in my tradingview profile.
| Update 1.1 | | EN |
➕Additions: '
Time sessions filter and days of the week filter added to the time filter section.
Option to add leverage to the strategy.
5 Moving Averages, RSI, Stochastic RSI, ADX, and Parabolic Sar have been added as indicators for the strategy.
You can choose from the 6 available indicators the way to trade, entry alert or entry filter.
Added the option of ATR for Take Profit.
Ticker information and timeframe are now displayed on the dashboard.
Added display customization and color customization of indicator plots.
Added customization of display and color plots of trades displayed on chart.
📝Changes:
Now when activating the time filter it is optional to add a start or end date and time, being able to only add a start date or only an end date.
Operation plots have been changed from plot() to line creation with line.new().
Indicator plots can now be controlled from the "plots" section.
Acceptable and deniable range of profit, winrate and profit factor can now be chosen from the "plots" section to be displayed on the dashboard.
Aesthetic changes in the section separations within the settings section and within the code itself.
The function that made the indicators give inputs based on heikin ashi candles has been changed, see the code for more information.
⚙️Fixes:
Dashboard label now projects correctly on all timeframes including custom timeframes.
Removed unnecessary lines and variables to take up less code space.
All code in general has been optimized to avoid the use of variables, unnecessary lines and avoid unnecessary calculations, freeing up space to declare more variables and be able to use fewer lines of code.
| Lanzamiento Inicial | | ES |
Una actualización de mi antiguo script, este script está diseñado para que pueda ser usado como una plantilla para todos aquellos traders que quieran ahorrar tiempo al programar su estrategia y hacer un backtesting de ella, teniendo funciones ya programadas que en el desarrollo normal te tomaría más tiempo programar, con esta plantilla puedes simplemente agregar tu indicador favorito y así poder aprovechar todas las funciones que tiene esta plantilla.
🔴Stop Loss y 🟢Take Profit:
No hace falta mencionar que es un Stop Loss y un Take Profit, dentro de estas funciones encontramos las opciones de: porcentaje fijo (%), precio fijo ($), ATR, en especial para Stop Loss encontramos los Pivot Points, adicionalmente a esto, el rango de precio entre la entrada y el Stop Loss se puede convertir en un trailing stop loss, en cambio, especialmente para el Take Profit tenemos una opción para elegir un ratio 1:X que se complementa muy bien con los Pivot Points.
📈Entradas Basadas en Heikin Ashi:
Las entradas Heikin Ashi son operaciones que son calculados en base a las velas Heikin Ashi pero su precio esta ejecutado a velas japonesas, evitando así́ los falsos resultados que se producen en graficas de velas Heikin, esto haciendo que en ciertos casos se obtengan mejores resultados en las estrategias que son ejecutadas con esta opción en comparación con las velas japonesas.
📊Panel de Control:
Una manera más visual y organizada de ver los resultados y datos necesarios producidos por nuestra estrategia, entre ellos podemos ver las fechas entre las que se hacen nuestras operaciones independientemente si se tiene activado algún filtro de tiempo, datos usuales como el Profit, Win Rate, Profit factor también son mostrados en este panel, adicionalmente se agregaron datos como el número total de operaciones, cuantos fueron ganancias y cuantos perdidas, el promedio de ganancias y pérdidas por cada operación y por ultimo las máximas ganancias y pérdidas seguidas, que son datos que nos serán muy útiles al elaborar nuestras estrategias.
Siéntete libre de usar esta plantilla para programar tus propias estrategias, si encuentras errores o quieres solicitar una nueva función házmelo saber en los comentarios o a través de mis redes sociales que se encuentran en mi perfil de tradingview.
| Actualización 1.1 | | ES |
➕Añadidos:
Filtro de sesiones de tiempo y filtro de días de la semana agregados al apartado de filtro de tiempo.
Opción para agregar apalancamiento a la estrategia.
5 Moving Averages, RSI, Stochastic RSI, ADX, y Parabolic Sar se han agregado como indicadores para la estrategia.
Puedes escoger entre los 6 indicadores disponibles la forma de operar, alerta de entrada o filtro de entrada.
Añadido la opción de ATR para Take Profit.
La información del ticker y la temporalidad ahora se muestran en el dashboard.
Añadido personalización de visualización y color de los plots de indicadores.
Añadido personalización de visualización y color de los plots de operaciones mostradas en grafica.
📝Cambios:
Ahora al activar el filtro de tiempo es opcional añadir una fecha y hora de inicio o fin, pudiendo únicamente agregar una fecha de inicio o solamente una fecha de fin.
Los plots de operaciones han cambiados de plot() a creación de líneas con line.new().
Los plots de indicadores ahora se pueden controlar desde el apartado "plots".
Ahora se puede elegir el rango aceptable y negable de profit, winrate y profit factor desde el apartado "plots" para mostrarse en el dashboard.
Cambios estéticos en las separaciones de secciones dentro del apartado de configuraciones y dentro del propio código.
Se ha cambiado la función que hacía que los indicadores dieran entradas en base a velas heikin ashi, mire el código para más información.
⚙️Arreglos:
El dashboard label ahora se proyecta correctamente en todas las temporalidades incluyendo las temporalidades personalizadas.
Se han eliminado líneas y variables innecesarias para ocupar menos espacio en el código.
Se ha optimizado todo el código en general para evitar el uso de variables, líneas innecesarias y evitar los cálculos innecesarios, liberando espacio para declarar más variables y poder utilizar menos líneas de código.

RF+ Divergence Scalping SystemRF+ Divergence Scalping System + Custom Signals + Alerts.
This chart overlay indicator has been developed for the low timeframe divergence scalper.
Built upon the realtime divergence drawing code from the Divergence for Many indicator originally authored by Lonsometheblue, this chart overlay indicator bundles several additional unique features and modifications to serve as an all-in-one divergence scalping system. The current key features at the time of publishing are listed below (features are optional and can be enabled or disabled):
- Fully configurable realtime divergence drawing and alerting feature that can draw divergences directly on the chart using data sourced from up to 11 oscillators selected by the user, which have been included specifically for their ability to detect divergences, including oscillators not presently included in the original Divergence for Many indicator, such as the Ultimate Oscillator and TSI.
- Optional on chart table showing a summary of key statuses of various indicators, and nearby divergences.
- 2 x Range Filters with custom settings used for low timeframe trend detection.
- 3 x configurable multi-timeframe Stochastic RSI overbought and oversold signals with presentation options.
- On-chart pivot points drawn automatically.
- Automatically adjusted pivot period for up to 4 configurable time frames to fine tune divergences drawn for optimal divergence detection.
- Real-price line for use with Heikin Ashi candles, with styling options.
- Real-price close dots for use with Heikin Ashi candles, with styling options.
- A selection of custom signals that can be printed on-chart and alerted.
- Sessions indicator for the London, New York, Tokyo and Sydney trading sessions, including daylight savings toggle, and unique ‘invert background color’ option, which colours the entire chart - except the trading session you have selected, leaving your chart clear of distracting background color.
- Up to 4 fully configurable moving averages.
- Additional configurable settings for numerous built in indicators, allowing you to alter the lengths and source types, including the UO, TSI, MFI, TSV, 2 x Range Filters.
- Configurable RSI Trend detection signal filter used in a number of the signals, which filters buy signals where the RSI is over the RSI moving average, and only prints sell signals where RSI is under the moving average.
- Customisable on-chart watermark, with inputs for a custom title, subtitle, and also an optional symbol | timeframe | date feature.
The Oscillators able to be selected for use in drawing divergences at the time of publishing are as follows:
- Ultimate Oscillator (UO)
- True Strength Indicator (TSI)
- Money Flow Index (MFI)
- Cumulative Delta Volume (CDV)
- Time Segmented Volume (TSV)
- Commodity Channel Index (CCI)
- Awesome Oscillator
- Relative Strength Index (RSI)
- Stochastic
- On Balance Volume (OBV)
- MACD Histogram
What are divergences?
Divergence is when the price of an asset is moving in the opposite direction of a technical indicator, such as an oscillator, or is moving contrary to other data. Divergence warns that the current price trend may be weakening, and in some cases may lead to the price changing direction.
There are 4 main types of divergence, which are split into 2 categories;
regular divergences and hidden divergences. Regular divergences indicate possible trend reversals, and hidden divergences indicate possible trend continuation.
Regular bullish divergence: An indication of a potential trend reversal, from the current downtrend, to an uptrend.
Regular bearish divergence: An indication of a potential trend reversal, from the current uptrend, to a downtrend.
Hidden bullish divergence: An indication of a potential uptrend continuation.
Hidden bearish divergence: An indication of a potential downtrend continuation.
Setting alerts.
With this indicator you can set alerts to notify you when any/all of the above types of divergences occur, on any chart timeframe you choose, also when the triple timeframe Stochastic RSI overbought and oversold confluences occur, as well as when custom signals are printed.
Configurable pivot period values.
You can adjust the default pivot period values to suit your prefered trading style and timeframe. If you like to trade a shorter time frame, lowering the default lookback values will make the divergences drawn more sensitive to short term price action. By default, this indicator has enabled the automatic adjustment of the pivot periods for 4 configurable time frames, in a bid to optimize the divergences drawn when the indicator is loaded onto any of the 4 time frames selected. These time frames and their associated pivot periods can be fully reconfigured within the settings menu. By default, these have been further optimized for the low timeframe scalper trading on the 1-15 minute time frames.
How do traders use divergences in their trading?
A divergence is considered a leading indicator in technical analysis , meaning it has the ability to indicate a potential price move in the short term future.
Hidden bullish and hidden bearish divergences, which indicate a potential continuation of the current trend are sometimes considered a good place for traders to begin, since trend continuation occurs more frequently than reversals, or trend changes.
When trading regular bullish divergences and regular bearish divergences, which are indications of a trend reversal, the probability of it doing so may increase when these occur at a strong support or resistance level . A common mistake new traders make is to get into a regular divergence trade too early, assuming it will immediately reverse, but these can continue to form for some time before the trend eventually changes, by using forms of support or resistance as an added confluence, such as when price reaches a moving average, the success rate when trading these patterns may increase.
Typically, traders will manually draw lines across the swing highs and swing lows of both the price chart and the oscillator to see whether they appear to present a divergence, this indicator will draw them for you, quickly and clearly, and can notify you when they occur.
How do traders use overbought and oversold levels in their trading?
The oversold level is when the Stochastic RSI is above the 80 level is typically interpreted as being 'overbought', and below the 20 level is typically considered 'oversold'. Traders will often use the Stochastic RSI at, or crossing down from an overbought level as a confluence for entry into a short position, and the Stochastic RSI at, or crossing up from an oversold level as a confluence for an entry into a long position. These levels do not mean that price will necessarily reverse at those levels in a reliable way, however. This is why this version of the Stoch RSI employs the triple timeframe overbought and oversold confluence, in an attempt to add a more confluence and reliability to this usage of the Stoch RSI.
This indicator is intended for use in conjunction with related panel indicators including the TSI+ (True Strength Indicator + Realtime Divergences), UO+ (Ultimate Oscillator + Realtime Divergences), and optionally the STRSI+ (MTF Stochastic RSI + Realtime Divergences) and MFI+ (Money Flow Index + Realtime Divergences) available via this authors’ Tradingview profile, under the scripts section. The realtime divergence drawing code will not identify all divergences, so it is suggested that you also have panel indicators to observe. Each panel indicator also offers additional means of entry confirmation into divergence trades, for example, the Stochastic can indicate when it is crossing down from overbought or up from oversold, the TSi can indicate when the 2 TSI bands cross over one another upward or downward, and the UO and MFI can indicate an entry confluence when they are nearing, or crossing their centerlines, for more confidence in your divergence trade entries.
Additional information on the settings for this indicator can be found via the tooltips within the settings menu itself. Further information on feature updates, and usage tips & tricks will be added to the comments section below in due course.
Disclaimer: This indicator uses code adapted from the Divergence for Many v4 indicator authored by Lonesometheblue, and several stock indicators authored by Tradingview. With many thanks.

[GTH] RevenueVisually similar to the GTH Earnings indicator, this indicator plots
Reported Revenue (black line)
Difference to Estimated Revenue (colored bars)
Percentage change to the previous Reported Revenue (tags)
Note 1: Although in Tradingview the 'E' tags on the time line display Revenues alongside with Earnings , there is a difference in timing. Revenues are reported quarterly; Earnings reporting dates differ with each stock. Hence, the tags in this indicator are not necessarily aligned with the Earnings reporting dates.
Note 2: It should be obvious that this indicator can only report data provided by Tradingview. Even more obviousy, it can not display revenues of anything else but stocks.
If you find a malfunction, please provide examples. "Does not work" is not helpful.

BINANCE_Minimum_qty_for_tradingWe can not buy just 0.001ETH in Binance on 2022.8.8
Why? Binance have trading role about the minimum qty of coins.
Until now, we can not find the info in TradingView.
I hope Our TradingView give us this updating info easily oneday.
I am not a good English speaker.
Sorry about my short explanation.
reference: www.binance.com
3LS | 3 Line Strike Strategy [Kintsugi Trading]What is the 3LS | 3 Line Strike Strategy?
Incorporating the 3 Line Strike candlestick pattern into our strategy was inspired by Arty at The Moving Average and the amazing traders at TheTrdFloor .
The Three Line Strike is a trend continuation candlestick pattern consisting of four candles. Depending on their heights and collocation, a bullish or a bearish trend continuation can be predicted.
In a symphony of trend analysis, price action, and volume we can find and place high-probability trades with the 3LS Strategy.
How to use it!
----- First, start by choosing a Stop-Loss Strategy, Stop PIP Size, and Risk/Reward Ratio -----
- Stop-Loss Strategy
Fixed PIP Size – This uses the top/bottom of the indicator candle and places a TP based on the chosen Risk:Reward ratio.
ATR Trail (No set Target Profit, only uses ATR Stop)
ATR Trail-Stop (Has set Target Profit, however, stop is based on ATR inputs)
**If you choose an ATR Stop-Loss Strategy - input the desired ATR period and Multiple you would like the stop to be calculated at**
**ATR Stop-Loss Strategies have a unique alert setup for Auto-Trading. See Auto-Trading Section**
- Risk/Reward Ratio = If you have a .5 risk/reward, it means you are risking $100 to make $50.
- Additional Stop PIP Size = Number of PIPs over the default stop location of the top or bottom of the indicator candle.
----- Next, we set the Session Filter -----
Set the Timezone and Trade Session you desire. If no specific session is desired, simply set the Trade Session to 00:00 - 00:00.
----- Next, we set the Moving Average Cloud Fill -----
Enter the Fast and Slow Moving Average Length used to calculate trend direction:
MA Period Fast
MA Period Slow
These inputs will determine whether the strategy looks for Long or Short positions.
----- Next, we set the VSA – Volume Spread Analysis Settings -----
Check the box to show the indicator at the bottom of the chart if desired.
This is just a different visual output of the VSA | Volume Spread Analysis indicator available for free under the community indicators tab. You can add that indicator to your chart and see the same output in candle format.
In combination with the Moving Average Cloud, the Volume Spread Analysis will help us determine when to take a trade and in what direction.
The strategy is essentially looking for small reversals going against the overall trend and placing a trade once that reversal ends and the price moves back in the direction of the overall trend.
The 3LS Strategy utilizes confirmation between trend, volume, and price action to place high probability trades.
The VSA is completely customizable by:
Moving Average Length
MA-1 Multiplier
MA-2 Multiplier
MA-3 Multiplier
Check out the VSA | Volume Spread Analysis indicator in the community scripts section under the indicators tab to use this awesome resource on other strategies.
----- Next, we have the option to view the automated KT Bull/Bear Signals -----
Check the boxes to show the buy-sell signal on the chart if desired.
----- Next, we set the risk we want to use if Auto Trading the strategy -----
I always suggest using no more than 1-3% of your total account balance per trade. Remember, if you have multiple strategies triggering per day with each using 1%, the total percent at risk will be much larger.
For Example – if you have 10 strategies each risking 1% your total risk is 10% of your account, not 1%! Be mindful to only use 1-3% of your total account balance across all strategies, not just each individual one.
----- Finally, we backtest our ideas -----
After using the 'Strategy Tester' tab on TradingView to thoroughly backtest your predictions you are ready to take it to the next level - Automated Trading!
This was my whole reason for creating the script. If you work a full-time job, live in a time zone that is hard to trade, or just don't have the patience, this will be a game-changer for you as it was for me.
Auto-Trading
When it comes to auto-trading this strategy I have included two options in the script that utilize the alert messages generated by TradingView.
*Note: Please trade on a demo account until you feel comfortable enough to use real money, and then please stick to 1%-2% of your total account value in risk per trade.*
AutoView
PineConnector
**ATR Auto-Trading Alert Setup**
How to create alerts on 3 Line Strike Strategy
For Trailing Stops:
1) Adjust autoview/pineconnector settings
2) Click "add alert"
3) Select "Condition" = Strategy Name
4) Select "Order Fills Only" from the drop-down
3) Remove template message text from "message" box and place the exact text. '{{strategy.order.alert_message}}'
4) Click "create"
For Fixed Pip Stop:
1) Adjust autoview/pineconnector settings
2) Click "add alert"
3) Select "Condition" = Strategy Name
4) Select "alert() function calls only"
5) I like to title my Alert Name the same thing I named it as an Indicator Template to keep track
Good luck with your trading!

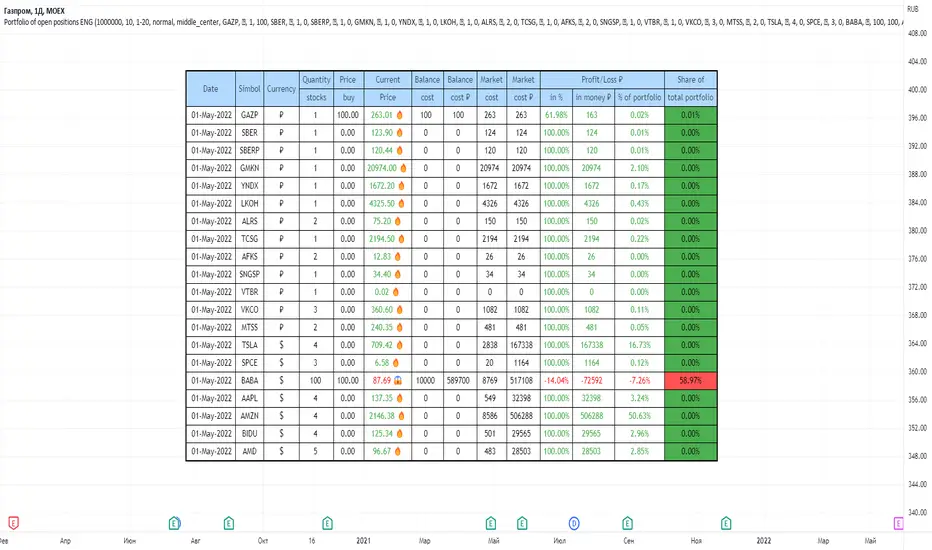
Portfolio of open positions ENGHello, I became interested in investing and trading, and there was a huge problem where and how to manage my portfolio,
I tried websites, got a spreadsheet in microsoft excel, and eventually it became possible to manage a portfolio in TradingView.
You enter data about purchases and follow the dynamics of your shares anytime, anywhere.
Added automatic transfer to one currency if the shares are traded in different currencies
The last column is how many percentages each share occupies of the total portfolio
Thanks to the TradingView team for the unique opportunity!
.b BTC-Exchange volumeBINANCE:BTCUSDT
It's tool to check exchange trading status.
You can see "BTC-exchange's realtime trading volume, previous closed volume" at once.
You can switch to see 'Previous close volume' on script's panel.
Timeframe recommended ; 15m, 1H, 4H, D, W, whatever.
Each exchange may have a different volume display unit, so I converted it into roughly BTC units. (using hl2 price)
This indicator aims to recognize the difference in the trading volume of the exchange at once.
It's not for the purpose of check the exact trading volume.
All data come from tradingview.
The comparison target exchanges refer to the ranking of CoinMarketCap.
if you have any questions freely contact to me by message on tradingview, or telegram @sr_bt
but please understand that responses may be quite late.

crypto futures hourly scalping with ma & rsi - ogcheckershi to all lovable traders,
hereby i want to share a combination of trade ideas for scalping
i've chosen hourly timeframe
indicators used: moving averages and rsi
moving averages:
ema 3, ema 5, ema 7
sma 3, sma 5, sma 7
daily_ema_3, daily_ema_5
daily_ema_5, daily_sma_5
rsi:
rsi 7, rsi 14, rsi 26
daily_rsi_7, daily_rsi_14, daily_rsi_26
as per the analysis over moving average behavioral patterns & rsi movements, useful points are given below which will be helpful while choosing good entry points & exit points,
strategical points for LONG:
* when ema3 crosses above sma3 - green candles start to form
* it's followed by ema5 > sma5 and ema7 > sma7
* when ema3 crosses down sma3 - it's considered as an indication of exit
* if rsi supports then can wait for ema5 crossing down sma5
* as similar, when daily_ema_3 crosses above daily_sma_3, its an higher timeframe bullish indication, so the lower timeframe entries inside this higher timeframe is a sure shot confident entry
* for LONG always take entries when rsi_14 < 30 or 25 else check rsi_7 < 25 or below
* as along the above, bullish CANDLE patterns like bullish engulfing , morning star is been used for entry at lower levels
* so here i've used OPEN as rsi_source in majority
* exit points also indicated at high_rsi and moving average crossunders or reverse crossovers
* for SHORTING, the above said ideas can be used in viceversa
* inputs in the indicator were tailored for users needs so that you will enjoy the magics of customization
if i am wrong in anyways regarding the above indicator strategy, please forgive me and help me improve in this aspect by commenting.
after few more studies and analysis and mainly QUERIES & COMMENTS, i'm planning to backtest these strategies here in tradingview.
also if these strategies are coded in python, we can link it to Binance Futures Algo or Bot Trading.
thankyou for this opportunity,
thanks to tradingview and pinecoders
thanks to Pranab (for 365MA)
thanks to Gandalf (for inspiring)
Special Thanks & Love to Chartbank for Everything

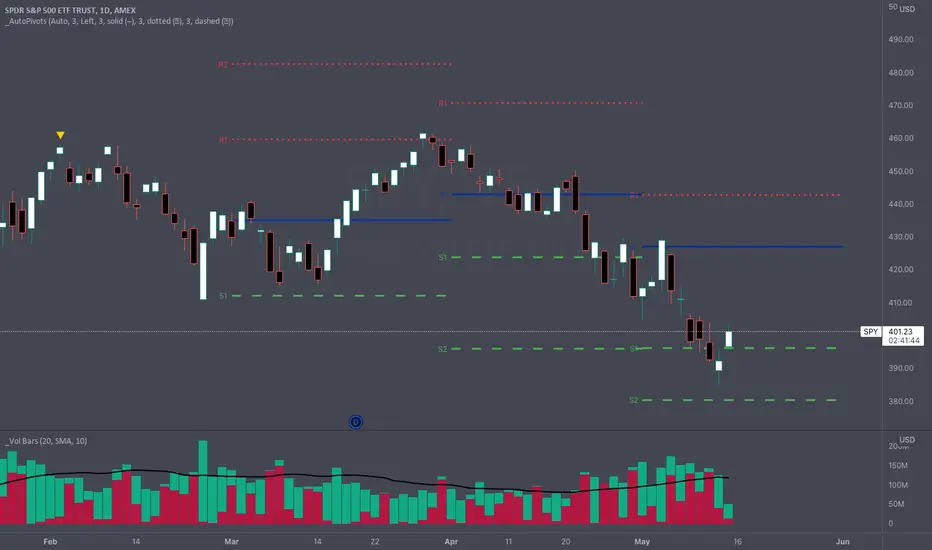
_Auto Pivot PointsOne of the main drawbacks to displaying Pivot Points on a chart is that many times the more extreme pivots (R/S3, R/S4, R/S5) aren't anywhere close to the price action during a timeframe. These extreme pivot points clutter up your chart and make it hard to use the "auto" zoom feature of TradingView.
The " _Auto Pivot Points " indicator solves these problems by automatically only displaying the pivot points if the price has crossed the pivot during the timeframe or it is the next closest pivot . For example, on monthly pivots if the price has only crossed the R1 Pivot then this indicator will display the R2 Pivot and any pivots below but it won't display the R3, R4, R5 pivots . The R3, R4, & R5 pivots are not very useful to the trader because the price hasn't even crossed the R2 Pivot . But as soon as the price crosses the R2 Pivot then this indicator will display the R3 Pivot because it is the next closest. And the same logic applies to the S Pivots .
If you need to see all the Pivots then there is a convenient toggle to display all the pivots by turning off the intelligent auto pivots . But as soon as you don't need to display all the pivots the toggle will turn on the automatic pivots .
This indicator has many style and logic options. This script allows you to control:
Number of past timeframes to display
Displaying Pivot labels
Label position (left/right)
Line color
Line width
Note: TradingView has a limit of 40 security calls per script. Due to this limitation this indicator can only display pivots a max of 7 time periods back.
Note 2: This indicator uses the Traditional pivot calculations.