TTP SuperTrend ADXThis indicator uses the strength of the trend from ADX to decide how the SuperTrend (ST) should behave.
Motivation
ST is a great trend following indicator but it's not capable of adapting to the trend strength.
The ADX, Average Directional Index measures the strength of the trend and can be use to dynamically tweak the ST factor so that it's sensitivity can adapt to the trend strength.
Implementation
The indicator calculates a normalised value of the ADX based on the data available in the chart.
Based on these values ST will use different factors to increase or reduce the factor use by ST: expansion or compression.
ST expansion vs compression
Expanding the ST would mean that the stronger a trends get the ST factor will grow causing it to distance further from the price delaying the next ST trend flip.
Compressing the ST would mean that the stronger a trends get the ST factor will shrink causing it to get closer to the price speeding up the next ST trend flip.
Features
- Alerts for trend flip
- Alerts for trend status
- Backtestable stream
- SuperTrend color gets more intense with the strength of the trend
Pesquisar nos scripts por "supertrend"

Auto SuperTrend+Based upon SuperTrend+ , this variation measures the volatility in order to determine the range of the trend.
Notes:
Upward volatility is measured separately from downward.
WMA is used for averaging to provide a recency bias.
Changing time-frames should display similar results as the settings are based upon time and not bars.

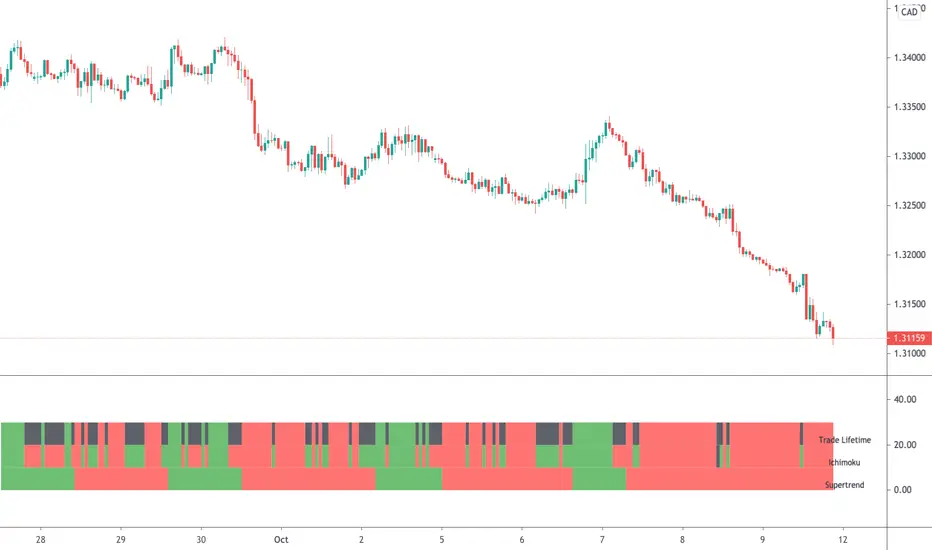
Ichimoku & Supertrend Combined StrategyOne of my mixed approach strategy indicators which include's:
- Ichimoku using much faster settings. (ECC-11)
- Supertrend
Whilst both Supertrend and Ichimoku are quite reliable, they do sometimes provide false signals. By combining both indicators, trading when both agree, it reduces the number of false alerts.
Using this indicator is simple. If the lifetime line is green then buy. If red then sell and when black don't trade. So...
Green Line - This strategy is in a buy position
Red Line - This strategy is in a sell position
Black Line - DON'T TRADE
The trader's approach is simple, when all indicators are green or red, then take the trade. As soon as one indicator changes, then re-evaluate using your normal process, such as price action, to determine whether to close the trade or continue.
There are also some alerts for opening and closing positions.
If you wish to make some changes or discuss, please don't hesitate to message me.
Variable SuperTrend - evoPlayed around with Lazy Bear's VMA and Gunazzi's SuperTrend Cloud .
It plots an uptrend if the low of a candle gets above the recent downtrend and plots a downtrend if the high of a candle gets below the recent uptrend, you have to wait for the candle to close to confirm the actual trend change.
I use it to give me a direction for longs or shorts, not as a stop/reverse indicator.
Thanks Lazy Bear and Gunazzi :)

Supertrend Trend Change Signals + Covered Points Only (v5)[NR]Supertrend with Buy/Sell Signals + Covered Points (v5)
Description
This indicator is a custom version of the Supertrend that provides:
Buy/Sell signals whenever the trend flips (Up → Buy, Down → Sell).
Covered points label at the end of each trend, showing the total price movement captured from entry to exit.
Optional colored candles based on trend direction.
Visual markers (triangle up/down) for quick identification of flips.
Built-in alert conditions for Buy and Sell flips.
Use case:
Designed for traders who want not only entry/exit alerts but also a quick view of how many points the previous run covered. Especially useful for index futures (e.g., NIFTY, BankNIFTY) or instruments where point movement matters.
⚠ Note: This is a study/indicator, not a strategy. It does not auto-trade and should be combined with your own analysis and risk management.

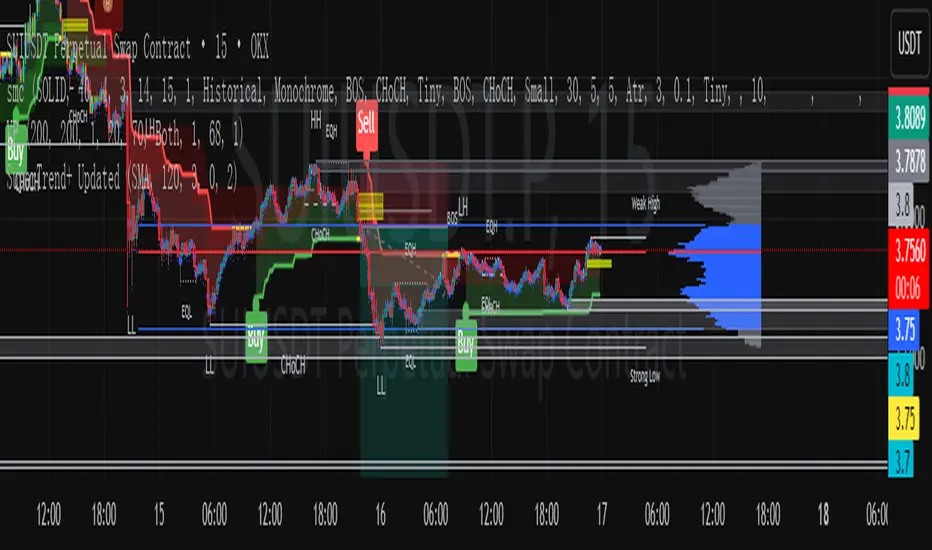
SuperTrend+ UpdatedSuperTrend+ with SL/TP is a technical analysis tool designed to identify market trends and potential trading opportunities. Based on the SuperTrend indicator, it incorporates additional features including stop loss and take profit level calculations.
The indicator visually displays uptrends and downtrends through colored lines and background highlighting, making trend direction easy to identify. It generates buy and sell signals when trend reversals are detected, with optional volume filtering to reduce false signals.
Key features include customizable ATR parameters, multiple calculation methods for stop loss and take profit levels (ATR-based or fixed percentage), and clear visual markers for entry points and target levels.
Ideal for traders looking to identify trend directions and manage risk with predefined exit levels, this indicator works across various timeframes and financial instruments.
Multi-timeframe 24 moving averages + BB+SAR+Supertrend+VWAP █ OVERVIEW
The script allows to display up to 24 moving averages ("MA"'s) across 5 timeframes plus two bands (Bollinger Bands or Supertrend or Parabolic SAR or VWAP bands) each from its own timeframe.
The main difference of this script from many similar ones is the flexibility of its settings:
- Bulk enable/disable and/or change properties of several MAs at once.
- Save 3 of your frequently used templates as presets using CSV text configurations.
█ HOW TO USE
Some use examples:
In order to "show 31, 50, 200 EMAs and 20, 100, 200 SMAs for each of 1H, 4H, D, W, M timeframes using blue for short MA, yellow for mid MA and red for long MA" use the settings as shown on a screenshot below.
In order to "Show a band of chart timeframe MA's of lengths 5, 8, 13, 21, 34, 55, 100 and 200 plus some 1H, 4H, D and W MAs. Be able to quickly switch off the band of chart tf's MAs. For chart timeframe MA's only show labels for 21, 100 and 200 EMAs". You can set TF1 and TF2 to chart's TF and set you fib MAs there and configure fixed higher timeframe MAs using TF3, TF4 and TF5 (e.g. using 1H, D and W timeframes and using 1H 800 in place of 4H 200 MA). However, quicker way may be using CSV - the syntax is very simple and intuitive, see Preset 2 as it comes in the script. You can easily switch chart tf's band of MAs by toggling on/off your chart timeframe TF's (in our example, TF1 and TF2).
The settings are either obvious or explained in tooltips.
Note 1: When using group settings and CSV presets do not forget that individual setting affected will no have any effect. So, if some setting does not work, check whether it is overridden with some group setting or a CSV preset.
Note 2: Sometimes you can notice parts of MA's hanging in the air, not lasting up to the last bar. This is not a bug as explained on this screenshot:
█ FOR DEVELOPERS
The script is a use case of my CSVParser library, which in turn uses Autotable library, both of which I hope will be quite helpful. Autotable is so powerful and comprehensive that you will hardly ever wish to use normal table functions again for complex tables.
The indicator was inspired by Pablo Limonetti's url=https://www.tradingview.com/script/nFs56VUZ/]Multi Timeframe Moving Averages and Raging @RagingRocketBull's # Multi SMA EMA WMA HMA BB (5x8 MAs Bollinger Bands) MAX MTF - RRB

Profitable Supertrend v0.1 - AlphaThis a script to try detect the best combination of supertrend parameters in a space of time. Sadly the script is slow. Evaluate all possibilities params is hard for a pinescript and my knowledge too. In some cases, when you want evaluate many time could be the script fails for timeout. Perhaps with time I could enhance. For this problem of speed the calculate of combinatios it's not complete: In factor use a increment of 0.2 in each param (0.1, 0.3, 0.5 ...) in period the increment for each value is 3. The range for factor it's from 3.0 to 12.0. The range of period it's from 10 to 43
My knowledge don't let me go more far. Perhaps with time I can enhance the script.

Divit Multi SuperTrendthese are all supertrend lines with different settings.
green lines indicate uptrend.
red line indicates down trend.
when all lines are green its very good uptrend - you can buy.
when all lines are red its very good downtrend - you can sell.
when few lines are red and few are green its not confirmed buy or sell.
in this situation you may confirm buy or sell with the help of other indicators.
its an easy to use indicator.

Williams Vix Fix paired with Supertrend HeatmapThis script shows my mod of the powerful Williams' Vix Fix indicator paired with a modified Supertrend Heatmap, originally created by Daveatt.


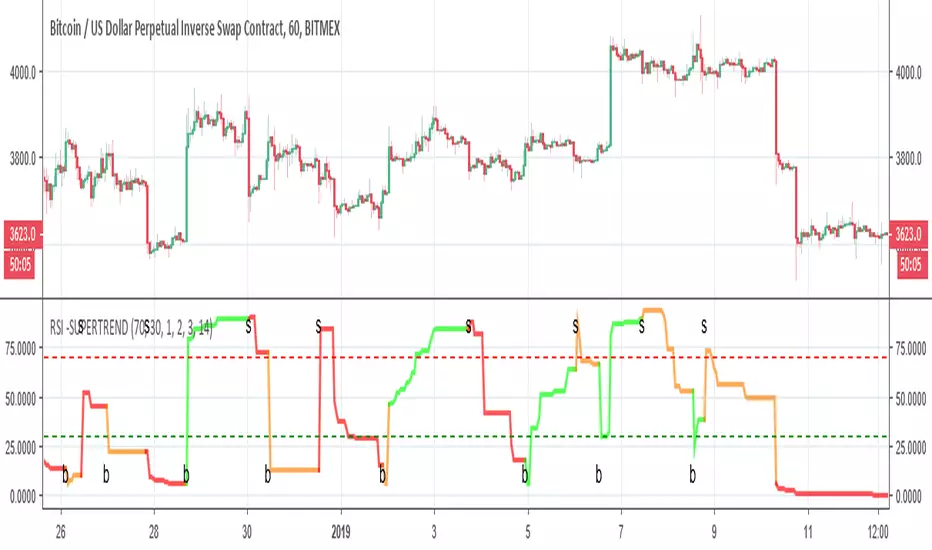
RSI -SUPERTRENDThis is hybrid of Super trend and RSI
the green and red zones are by the supertrend
so it seems the two indicator can compleemnt each other
Supertrend + EMA50 — Signal (no labels) chpolSupertrend + EMA50, best for 15 minutes, Forex, Crypto, XAUUSD.

SuperTrendSAP1212This indicator combines Supertrend, VWAP with bands, and an optional RSI filter to generate Buy/Sell signals.
How it works
Supertrend Flip (ATR-based): Detects when trend direction changes (from bearish to bullish, or bullish to bearish).
VWAP Band Filter: Signals only trigger if the candle close is beyond the VWAP bands:
Buy = Supertrend flips up AND close > VWAP Upper Band
Sell = Supertrend flips down AND close < VWAP Lower Band
Optional RSI Filter:
Buy requires RSI < 20
Sell requires RSI > 80
Can be enabled/disabled in settings.
Features
Choice of VWAP band calculation mode: Standard Deviation or ATR.
Adjustable ATR/StDev length and multiplier for VWAP bands.
Toggle Supertrend, VWAP lines, and Buy/Sell labels.
Alerts included: add alerts on BUY or SELL conditions (use Once Per Bar Close to avoid intrabar signals).
Use
Works best on intraday or higher timeframes where VWAP is relevant.
Use the RSI filter for more selective signals.
Can be combined with your own stop-loss and risk management rules.
⚠️ Disclaimer: This script is for educational and research purposes only. It is not financial advice. Always test thoroughly and trade at your own risk.

Supertrend0913This Pine Script (`@version=6`) combines **two Supertrend indicators** and a set of **moving averages (EMA & MA)** into one overlay chart tool for TradingView.
**Key features:**
* **Supertrend \ & \ :**
* Each has independent ATR period, multiplier, and ATR calculation method.
* Plots trend lines (green/red for \ , blue/yellow for \ ).
* Generates **buy/sell signals** when trend direction changes.
* Includes **alert conditions** for buy, sell, and trend reversals.
* **Moving Averages:**
* 6 EMAs (lengths 21, 55, 100, 200, 300, 400).
* 5 SMAs (lengths 11, 23, 25, 39, 200).
* Each plotted in different colors for trend visualization.
👉 In short: it’s a **combined trading tool** that overlays two configurable Supertrend systems with alerts plus multiple EMAs/SMAs to help identify trend direction, signals, and potential entry/exit points.

Supertrend3n1it combines the 3 super trend indicator values to save space for more indicators in the chart , and it works perfectly with the stochastic RSI indicator

Supertrend with Correct Y-axis Scaling OLEG_SLSThe functionality of the script:
1. Supertrend Calculation:
-The trend (Supertrend line) is updated dynamically:
-If the price is above the previous trend, the line follows the upper limit.
-If the price is lower, the line follows the lower boundary.
2. Calculation of the Supertrend for the higher timeframe:
-The function is used to calculate the Supertrend for the hourly, regardless of the current timeframe on the chart.
3. Buy and Sell Signals:
-Buy signal: When the price crosses the Supertrend line up and is above the Supertrend line.
-A sales signal: When the price crosses the Supertrend line down and is below the Supertrend line.
4. Display on the chart
-The Supertrend line is displayed:
-Green if the price is above the Supertrend line.
-Red if the price is below the Supertrend line.
-The Supertrend line for the hourly timeframe is displayed in blue.
5. Alerts
Two types of alerts are created:
-Buy Alert: When there is a buy signal.
-Sell Alert: When there is a sell signal.
Features and recommendations:
-Supertrend works best in trending markets. In a sideways movement, it can give false signals.
-Check the signals on multiple timeframes for confirmation.
-Add additional indicators (for example, RSI or MACD) to filter the signals.
-Test the strategy on historical data before using it in real trading.
_________________________________________________________________________________
Функционал скрипта:
1. Расчет Supertrend:
-Тренд (линия Supertrend) обновляется динамически:
-Если цена выше предыдущего тренда, линия следует за верхней границей.
-Если цена ниже, линия следует за нижней границей.
2. Расчет Supertrend для старшего таймфрейма:
-Используется функция чтобы рассчитать Supertrend для часового,независимо от текущего таймфрейма на графике.
3. Сигналы покупки и продажи:
-Сигнал покупки: Когда цена пересекает линию Supertrend вверх и находится выше линии Supertrend.
-Сигнал продажи: Когда цена пересекает линию Supertrend вниз и находится ниже линии Supertrend.
4. Отображение на графике
-Линия Supertrend отображается:
-Зеленым, если цена выше линии Supertrend.
-Красным, если цена ниже линии Supertrend.
-Линия Supertrend для часового таймфрейма отображается синим цветом.
5. Оповещения
Создаются два типа оповещений:
-Buy Alert: Когда возникает сигнал на покупку.
-Sell Alert: Когда возникает сигнал на продажу.
Особенности и рекомендации:
-Supertrend лучше всего работает в трендовых рынках. В боковом движении может давать ложные сигналы.
-Проверяйте сигналы на нескольких таймфреймах для подтверждения.
-Добавьте дополнительные индикаторы (например, RSI или MACD) для фильтрации сигналов.
-Тестируйте стратегию на исторических данных перед использованием в реальной торговле.

SuperTrend Weighted by Divergence█ OVERVIEW
SuperTrend Weighted by Divergence is a trend-following indicator based on the classic SuperTrend, enhanced with dynamic ATR weighting driven by divergences. Its key feature is adaptive behavior: when a divergence appears, the indicator temporarily reduces the ATR multiplier, allowing the trend line to react faster to potential market reversals.
The indicator remains clean, visually clear, and well suited for traders who want to combine trend-following with early detection of weakening momentum.
█ CONCEPT
One of the biggest drawbacks of trend indicators is their lagging nature, caused by the characteristics of source data. Classic SuperTrends react only after the trend has already developed, which often leads to late entries or exits.
The idea behind SuperTrend Weighted by Divergence is to introduce dynamic adjustment of the trend line in response to the first signs of trend weakening.
Instead of treating ATR as a constant volatility buffer, the indicator temporarily modifies its impact when the market sends warning signals in the form of price–oscillator divergences.
For divergence detection, a hidden auxiliary oscillator called “MPO4 Lines – Modal Engine” (default settings) is used. This oscillator is not displayed on the chart – only the points where divergences are detected are shown as markers on price bars.
Divergences do not generate direct entry signals; they are used solely to temporarily adjust the behavior of the SuperTrend.
If, after detecting a divergence against the current trend, a divergence in line with the trend appears, the previous divergence is invalidated and the SuperTrend returns to its standard behavior (base ATR multiplier).
█ FEATURES
Data sources:
- ATR (Average True Range)
- Reference point: HL2 (high/low average)
- MPO4 Lines – Modal Engine oscillator (hidden, used only for divergence detection)
Divergence logic:
- Bullish divergence: lower low in price + higher low in the oscillator
- Bearish divergence: higher high in price + lower high in the oscillator
- Divergences are detected using pivots (left/right)
- Divergence detection is delayed by the pivot length, as confirmation requires a fixed number of bars on the right side
Divergence impact:
- After a divergence is detected, the ATR multiplier is reduced
- The reduction strength is controlled by Divergence Sensitivity
- The effect is active only for a limited number of bars – 200 bars by default (divBars)
- The effect is canceled on trend change or when a trend-aligned divergence appears
Trend change logic:
- Trend changes only after a confirmed close beyond the trailing line
- No repainting
- Trend lines break at reversal points
Visual signals:
- “Buy” and “Sell” labels only on confirmed trend changes
- Optional bar coloring based on current trend (Color bars by trend)
- Soft fill between price and the trend line
- Divergence markers (dots above/below bars) shown at the point of divergence detection, not across the entire divergence structure
Alerts:
- Buy Signal – trend change to bullish
- Sell Signal – trend change to bearish
- Bullish Divergence
- Bearish Divergence
█ HOW TO USE
Adding the indicator:
Paste the code into Pine Editor or search for “SuperTrend Weighted by Divergence” on TradingView
Main settings:
- ATR Length – ATR period
- Base ATR Multiplier – base SuperTrend width
- Pivot Length – divergence sensitivity and detection delay
- Divergence Sensitivity – strength of divergence impact (0.0–1.0)
- Color bars by trend – enable / disable bar coloring
- Line and fill colors – fully customizable
Interpretation:
- Green line and bars = uptrend
- Red line and bars = downtrend
- Divergence against the trend = possible weakening and faster SuperTrend reaction
- Trend-aligned divergence = return to standard SuperTrend behavior
- No divergence = classic, stable SuperTrend behavior
█ APPLICATIONS
Ideal for:
- Trend-following
Entering positions only in the direction of the current trend, using the SuperTrend as a directional filter.
- Early detection of trend weakness
Repeated divergences against the trend may indicate decreasing momentum and a potential upcoming reversal.
- Markets with variable dynamics (crypto, indices, forex)
Entries based on trend changes, preferably confirmed by other tools such as Fibonacci levels, RSI, support/resistance, or market structure.
- Scalping, day trading, and swing trading (with parameter adjustments)
Increasing Divergence Sensitivity to around 0.4–0.5 produces many more signals on small, often short-lived moves.
These settings work well for scalping and day trading, but are not ideal for swing trading, as they tend to generate more false signals and frequent trend changes.
█ NOTES
- Works on all markets and timeframes
- Divergences are used to adapt SuperTrend behavior, not as standalone entry signals
- Higher Divergence Sensitivity = faster reaction and more signals
- Lower Divergence Sensitivity = smoother trend and fewer changes
- Best results are achieved by tuning parameters to the instrument and trading style

Supertrend X2 + CalcSize Calculator:
Size Calculator is a risk management tool that helps traders position themselves intelligently by calculating optimal position size, stop loss, and take profit levels based on account capital, ATR volatility, and personal risk tolerance. It takes the guesswork out of sizing so you can focus on execution.
Features:
✅ Risk-based position sizing
✅ ATR-based stop loss & take profit levels
✅ Dynamic leverage estimation
✅ Support for long and short positions
✅ Visual display of key levels and metrics via table
✅ Works across any timeframe with locked timeframe support
How It Works:
This tool computes the ideal position size as a % of account capital based on how much you're willing to risk per trade and how far your stop loss is (in ATR units). It calculates corresponding stop loss and take profit prices, and visually plots them along with a floating table of metrics. You can lock the timeframe used for ATR and price, keeping your risk logic stable even when changing chart views.
Customizable Inputs:
Account capital and risk tolerance
ATR-based stop loss & take profit multiples
Trade direction (Long or Short)
ATR period and locked timeframe
Optional detailed metrics display
Dual SuperTrend:
The Dual Supertrend indicator enhances the classic Supertrend strategy by layering two customizable Supertrend signals with independent ATR settings. This setup gives you a deeper, more nuanced read on trend strength and potential entry zones.
Features:
✅ Two Supertrend lines (each with adjustable ATR periods and multipliers)
✅ Optional Heikin Ashi candle smoothing for noise reduction
✅ Color-coded trend background for fast visual analysis
✅ Multi-timeframe trend table overlay (customizable)
✅ Built-in signal logic to identify "Long", "Short", or "N/A" zones
✅ Built-in alerts from Long and Short Entry Zones
How It Works:
The script calculates two Supertrend levels using separate ATR settings. Trend direction is derived from the relationship between price and each band. When the larger (slower) Supertrend flips and the smaller (faster) confirms, it signals a potential entry. The multi-timeframe table helps you align trades across different timeframes.
Customizable Inputs:
ATR Periods & Multipliers for both Supertrends
Timeframes for entry zone detection (up to 4)
Enable/disable Heikin Ashi candles for smoother trend detection

Supertrend with Extreme SignalsOriginality and Usefulness
The "Supertrend with Extreme Signals" indicator is an innovative tool I've developed to combine the strengths of the Supertrend indicator with the RSI (Relative Strength Index). This combination enhances the accuracy of entry and exit signals, making it more useful for traders looking to gain a comprehensive understanding of market conditions.
Justification for Mashup:
Supertrend: This is a trend-following indicator that identifies the current market trend and potential reversal points by adjusting dynamically based on market volatility.
RSI: A momentum oscillator that measures the speed and change of price movements. It helps pinpoint overbought and oversold conditions, adding an extra layer of confirmation to trend signals.
By merging these two indicators, the script filters out false signals and improves the precision of trade entries and exits. The Supertrend identifies the trend direction, while the RSI confirms the strength and potential reversals within that trend.
Description
Overview
The "Supertrend with Extreme Signals" indicator is a powerful hybrid tool that brings together the trend-following capability of the Supertrend and the momentum analysis of RSI. This integration provides clear buy and sell signals, helping traders make more informed decisions.
What It Does
Trend Identification: Utilizes the Supertrend to determine the prevailing market trend.
Signal Confirmation: Uses RSI to confirm signals by identifying overbought and oversold conditions.
Buy and Sell Signals: Generates buy signals when the price crosses above the Supertrend line and RSI indicates oversold conditions. Generates sell signals when the price crosses below the Supertrend line and RSI indicates overbought conditions.
How It Works
Supertrend Calculation:
Calculates the Average True Range (ATR) to assess market volatility.
Computes upper and lower levels based on the mid-price and ATR.
Determines trend direction by smoothing these levels over a specified period.
Dynamically adjusts the Supertrend value based on market conditions.
RSI Calculation:
Calculates the RSI over a defined period to measure price momentum.
Uses RSI levels to identify overbought (above 70) and oversold (below 30) conditions.
Signal Generation:
Buy Signal: Triggered when the price crosses above the Supertrend line and RSI is below the oversold threshold.
Sell Signal: Triggered when the price crosses below the Supertrend line and RSI is above the overbought threshold.
How to Use It
Trend Following: Use the Supertrend color to identify the current trend (green for uptrend, red for downtrend).
Entry Signals: Look for buy signals (green label) when the price crosses above the Supertrend line and RSI is in the oversold zone.
Exit Signals: Look for sell signals (red label) when the price crosses below the Supertrend line and RSI is in the overbought zone.
Visual Confirmation: The background color changes based on the trend direction, providing a quick visual cue for the current market state.
This script is especially useful for traders who combine trend-following strategies with momentum indicators. It helps filter out false signals and provides a robust framework for identifying profitable trading opportunities.
Concepts Underlying Calculations
ATR (Average True Range): Measures market volatility by calculating the average range of price movements over a specified period.
Supertrend: A trend-following indicator that adjusts dynamically based on market volatility.
RSI (Relative Strength Index): A momentum oscillator that measures the speed and change of price movements, helping to identify overbought and oversold conditions.
By combining these concepts, the "Supertrend with Extreme Signals" indicator offers a balanced approach to trading. It considers both trend direction and market momentum, making it a powerful tool for improving trading performance through informed market analysis.

Supertrend Channel Histogram OscillatorThis histogram is based on the script "Supertrend Channels "
The idea of the indicator is to visually represent the interaction of price with several different supertrend channels of various lengths in an oscillator in order to make it much more clear to the trader how the longer trends are interacting with shorter trends of the price movement of an asset. I got this idea from the "Kurutoga Cloud" and "Kurutoga Histogram" by D7R which is based on the centerlines of 3 Donchian Channels, however after I started using the Supertrend Channel by LuxAlgo I found that it was a more reliable price range channel than a standard Donchian Channel and I made this indicator to accompany it.
This indicator plots a positive value above 0 when the price is above the centerline of the supertrend channel and a negative value below 0 when the price is below the centerline.
The first supertrend's length and multiple can be adjusted in the settings.
The given supertrend input is then doubled and quadrupled in both length and multiplication so that a supertrend histogram with the values of 3, 3 will be accompanied by 2 additional supertrend histograms with the values of 6, 6 and 12, 12.
The larger price trend histograms are clearly visible behind the short term supertrend channel's histogram, giving traders a balanced view of short and long term trends interacting. The less visible columns of the larger trend remain above or below the 0 line behind the more visible short term channel trend, helping to spot pullbacks within a larger trend.
Additionally, when the 3 separate histograms are all positive or all negative but the histogram columns are separating from each other this can indicate a potential trend exhaustion leading to reversal or pullback about to happen.
The overbought and oversold lines at 50 and -50 are representative primarily of the short term trend with above 50 or below -50 indicating that the price is pushing the boundary and potentially beginning a new short term supertrend in the opposite direction. If values do not noticably exceed these levels, then the current short term trend movement can be viewed as a pullback within a larger trend, with continuation potentially to follow.
I have had troubles converting the original code to v6 so this will be published here in v5 of pinescript to be used in conjunction with the original. I was intending to create a companion indicator for this oscillator that represents 3 supertrends with corresponding 2x and 4x calculations based on LuxAlgo's script, but I can't seem to get it to work correctly in v5.
For best visualization of the trends 3 LuxAlgo Supertrend channels with 2x and 4x values should be used in conjunction with each other to fully visualize the histogram.
Used in conjunction with other indicators this can be a very effective strategy to capture larger trend moves and pullbacks within trends, as well as warn of potential price trend exhaustion.
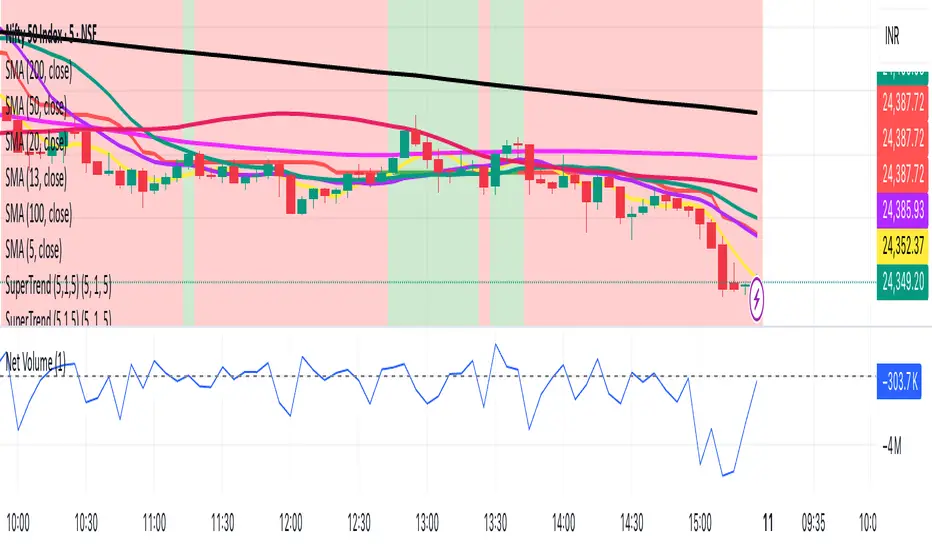
SuperTrend (5,1,5) By satish SWhy 3 Supertrends?
Short-term Supertrend (7, 1, 3) → reacts quickly, catches early trend changes but can give more false signals.
Medium-term Supertrend (14, 1, 2) → smoother, filters out noise.
Long-term Supertrend (21, 1, 3) → confirms major trend direction, fewer whipsaws.
How it Works
Trend Reversal Detection
If all three flip in the same direction → strong confirmation of trend change.
If only the short-term flips but others don’t → possible false signal, wait for confirmation.
Entry Signal Example
Buy when all three turn green (Supertrend below price).
Sell/short when all three turn red (Supertrend above price).
Exit / Partial Profit
Exit when the shortest one (7, 1, 3) flips against your position — protects profits in choppy markets.
TradingView Setup
You can do this by:
Adding Supertrend three times.
Setting their (Period, Multiplier, ATR Type) to:
ST1: 7, 1, 3
ST2: 14, 1, 2
ST3: 21, 1, 3
Use different colors or line styles for each so you can spot alignment quickly.