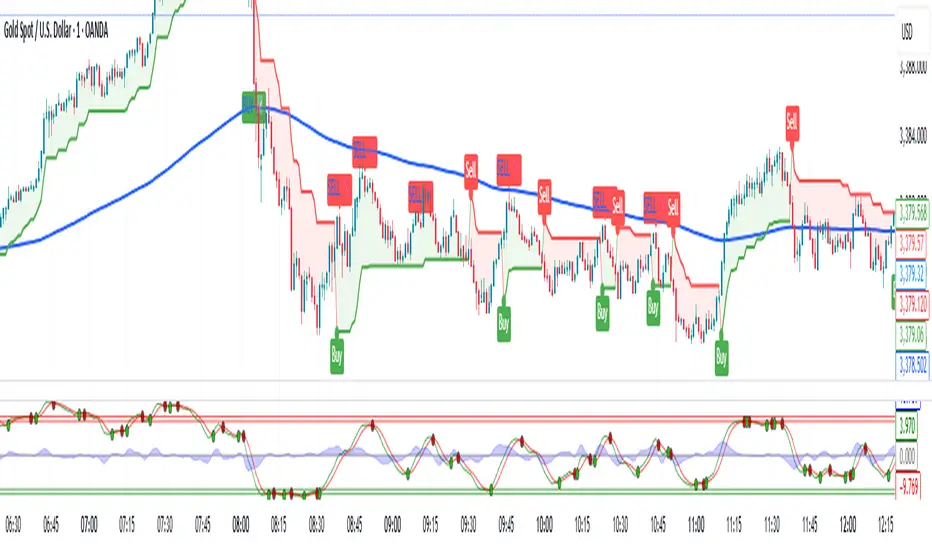
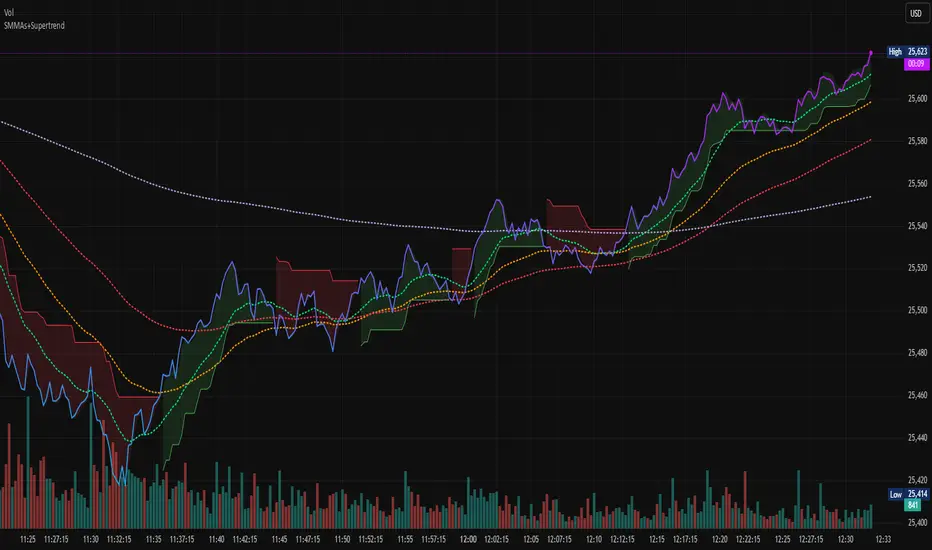
Multi Time Frame - Trend AnalysisMuti Time Frame - Trend Analysis
How does it work ? Price movements over range of period is to compute the trend forward.
This script used SuperTrend (ST) , ATR and RSI to determine the trend and direction so that a buy sell decision can be made
To Indicate the strength of the trendline , RSI is computed over multiple timeframes and then used to in sync with SuperTrend to help determine the direction
The user can customise the RSI strength validation. So one the Super Trend and ATR Levels are matched , the RSI is validated before giving a BUY/SELL suggestion
Best Time Frames to use : Upto 15/30 Mins if using RSI based logic , user can use higher timeframe if the goal is to identify the trend and the use lower time frame to determine Buy/Sell
Where to use
Trend Indicator using Multi Time Frame Analysis to suggest a long or a short
The main use of this indicator is quick scalping and Intra-day trading.
The Indicator shows the option to show the Trend Zone and Buy/Sell Signals which the use can on or off
How to use
User Choices : To avoid false positives we have introduced a double check using RSI ,
it is defaulted to 60/ 40 - the users are free to change it as per their preferences
The system will not suggest a trade when the the counter in beyond the RSI limits
Stop Loss - That should be done by following ones risk appetite , Ideally the open/close of the previous candle should be the stop loss for the buy/sell
but everyone has their own Risk Management Strategies based on the capital deployed.
Disclaimer : There could be scenarios when the candle is shown as a long or short and then the candle turns into opposite direction red/green .
In such scenarios , Please refer to the just preceding candle and if this candle is moving into positive direction (forming green candle) only then buy ,
Similarly Sell/Short only if this candle is forming a red candle
How to get access
Please click on the link / email in the signature or send me a private message to get access
Feedback
Please click on the link/email in the signature or send me a private message for suggestions/feedbacks
Pesquisar nos scripts por "supertrend"
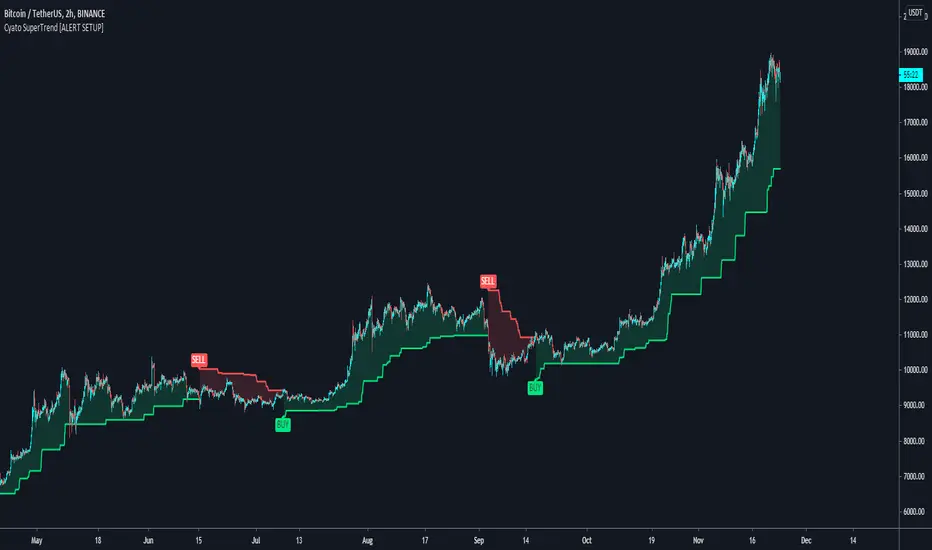
Cyatophilum SuperTrend [ALERT SETUP]Cyatophilum SuperTrend V1
A multi-timeframe indicator with Buy and Sell Alerts, built on ATR. (Averate True Range).
The SuperTrend line can be used as support when green, and resistance when red.
Reversals are strong buy/sell signals but perform badly in range markets.
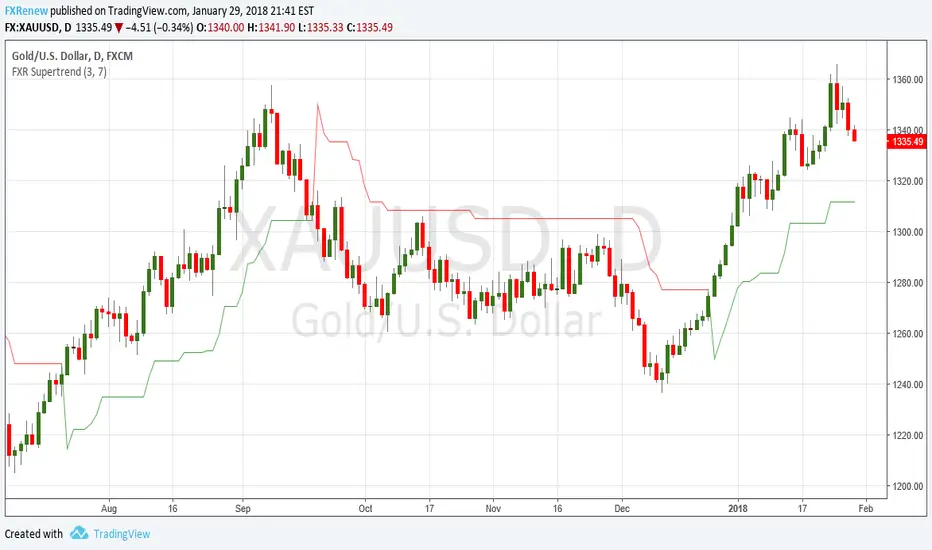
FXR SupertrendThis indicator plots the SuperTrend, a line trailing a multiple of the ATR behind the price mid-point.
It also plots upper and lower bands above and below the price mid-point that are the underlying ATR bands on which the SuperTrend is based.
SUPER SUPERTREND THREE LINE PROFIT STRATEGY//1.Buy when all three lines are become Red to Green or yellow and cover the position even one green become Red line next
//2.Sell when all the three line are become red and cove the position even one line become red to Green or yellow.


WMA SupertrendVWMA Supertrend for identifying good entry points
Divides the slow VWMA and fast VWMA and multiplies by the close price to give a mountain-style price showing possible entries.

Super-AO Engine - Sentiment Ribbon - 11-29-25Super-AO Sentiment Ribbon by Signal Lynx
Overview:
The Super-AO Sentiment Ribbon is the visual companion to the Super-AO Strategy Suite.
While the main strategy handles the complex mathematics of entries and risk management, this tool provides a simple "Traffic Light" visual at the top of your chart to gauge the overall health of the market.
How It Works:
This indicator takes the core components of the Super-AO strategy (The SuperTrend and the Awesome Oscillator), calculates the spread between them and the current price, and generates a normalized "Sentiment Score."
Reading the Colors:
🟢 Lime / Green: Strong Upward Momentum. Ideally, you only want to take Longs here.
🟤 Olive / Yellow: Trend is weakening. Be careful with new entries, or consider taking profit.
⚪ Gray: The "Kill Zone." The market is chopping sideways. Automated strategies usually suffer here.
🟠 Orange / Red: Strong Downward Momentum. Ideally, you only want to take Shorts here.
Integration:
This script uses the same default inputs as our Super-AO Strategy Template and Alerts Template. Use them together to confirm your automated entries visually.
About Signal Lynx:
Free Scripts supporting Automation for the Night-Shift Nation 🌙
(www.signallynx.com)

Super-AO with Risk Management Alerts Template - 11-29-25Super-AO with Risk Management: ALERTS & AUTOMATION Edition
Signal Lynx | Free Scripts supporting Automation for the Night-Shift Nation 🌙
1. Overview
This is the Indicator / Alerts companion to the Super-AO Strategy.
While the Strategy version is built for backtesting (verifying profitability and checking historical performance), this Indicator version is built for Live Execution.
We understand the frustration of finding a great strategy, only to realize you can't easily hook it up to your trading bot. This script solves that. It contains the exact same "Super-AO" logic and "Risk Management Engine" as the strategy version, but it is optimized to send signals to automation platforms like Signal Lynx, 3Commas, or any Webhook listener.
2. Quick Action Guide (TL;DR)
Purpose: Live Signal Generation & Automation.
Workflow:
Use the Strategy Version to find profitable settings.
Copy those settings into this Indicator Version.
Set a TradingView Alert using the "Any Alert() function call" condition.
Best Timeframe: 4 Hours (H4) and above.
Compatibility: Works with any webhook-based automation service.
3. Why Two Scripts?
Pine Script operates in two distinct modes:
Strategy Mode: Calculates equity, drawdowns, and simulates orders. Great for research, but sometimes complex to automate.
Indicator Mode: Plots visual data on the chart. This is the preferred method for setting up robust alerts because it is lighter weight and plots specific values that automation services can read easily.
The Golden Rule: Always backtest on the Strategy, but trade on the Indicator. This ensures that what you see in your history matches what you execute in real-time.
4. How to Automate This Script
This script uses a "Visual Spike" method to trigger alerts. Instead of drawing equity curves, it plots numerical values at the bottom of your chart when a trade event occurs.
The Signal Map:
Blue Spike (2 / -2): Entry Signal (Long / Short).
Yellow Spike (1 / -1): Risk Management Close (Stop Loss / Trend Reversal).
Green Spikes (1, 2, 3): Take Profit Levels 1, 2, and 3.
Setup Instructions:
Add this indicator to your chart.
Open your TradingView "Alerts" tab.
Create a new Alert.
Condition: Select SAO - RM Alerts Template.
Trigger: Select Any Alert() function call.
Message: Paste your JSON webhook message (provided by your bot service).
5. The Logic Under the Hood
Just like the Strategy version, this indicator utilizes:
SuperTrend + Awesome Oscillator: High-probability swing trading logic.
Non-Repainting Engine: Calculates signals based on confirmed candle closes to ensure the alert you get matches the chart reality.
Advanced Adaptive Trailing Stop (AATS): Internally calculates volatility to determine when to send a "Close" signal.
6. About Signal Lynx
Automation for the Night-Shift Nation 🌙
We are providing this code open source to help traders bridge the gap between manual backtesting and live automation. This code has been in action since 2022.
If you are looking to automate your strategies, please take a look at Signal Lynx in your search.
License: Mozilla Public License 2.0 (Open Source). If you make beneficial modifications, please release them back to the community!

Income Engine - Daily Supertrend Covered Call SignalsWhat This Indicator Does
1. Identifies the safest time to sell a 1-week covered call
The script uses the Daily Supertrend as a primary trend filter.
When the trend turns bearish or weak, the indicator highlights a Sell Zone, signaling a statistically safer window to sell a covered call.
Covered calls perform best when price is:
Sideways
Weak
Trending down
Not likely to surge upward
The Sell Zone captures exactly this behavior.
Green line=Let the stock run.
Red line=safe to sell calls without assignment. Gererate income while stock falters.

[CASH] Crypto And Stocks Helper (MultiPack w. Alerts)ATTENTION! I'm not a good scripter. I have just learned a little basics for this project, stolen code from other public scripts and modified it, and gotten help from AI LLM's.
If you want recognition from stolen code please tell me to give you the credit you deserve.
The script is not completely finished yet and contains alot of errors but my friends and family wants access so I made it public.
_________________________________________________________________________________
CASH has multiple indicators (a true all-in-one multipack), guides and alerts to help you make better trades/investments. It has:
- Bitcoin Bull Market Support Band
- Dollar Volume
- 5 SMA and 5 EMA
- HODL Trend (a.k.a SuperTrend) indicator
- RSI, Volume and Divergence indicators w. alerts
More to come as well, like Backburner and a POC line from Volume Profile.
Everything is fully customizable, appearance and off/on etc.
More information and explainations along with my guides you can find in settings under "Input" and "Style".

Trend Rider EMA9/21 + SuperTrend (EN)Trend Rider EMA9/21 + SuperTrend (EN) helps you watch ema 9 and 21 together for a trend.

EMA 9/15/45 + MACD Confirm + SupertrendThis indicator uses EMA 9, 15, 45 days along with combination of MACD and Supertrend

Awesome SuperTrend Zone Dynamic Alerts// created by © OmegaTools, upgrade to v6 and alert condition added
//@version=6
Awesome SuperTrend Zone Alerts with dynamic alerts

MACD + Supertrend + VWAP (Filtered with Background)MACD + Supertrend + VWAP (Filtered with Background)

FVMA + SuperTrend + top and bottom Strategy Full CustomizationFVMA + SuperTrend + top and bottom Strategy Full Customization
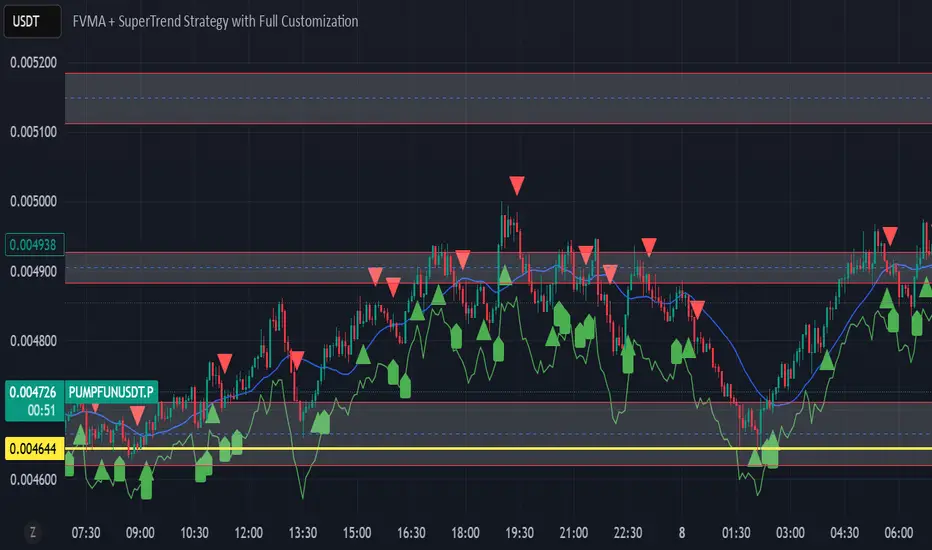
FVMA + SuperTrend Strategythis code is using a combination of 2 indicators, whcih are FVMA and the SuperTrend .
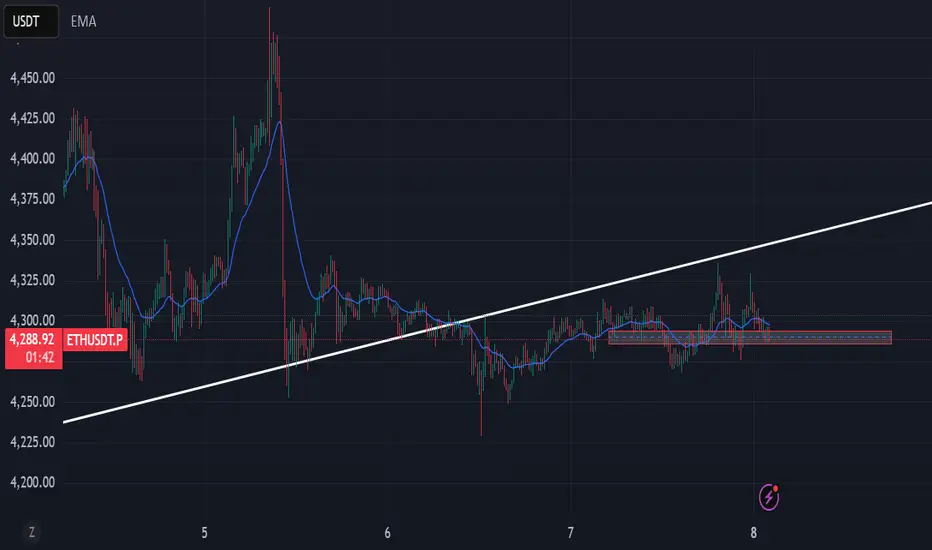
VWAP Price ChannelVWAP Price Channel cuts the crust off of a traditional price channel (Donchian Channel) by anchoring VWAPs at the highs and lows. By doing this, the flat levels, characteristic of traditional Donchian Channels, are no more!
Author's Note: This indicator is formed with no inherent use, and serves solely as a thought experiment.
> Concept
I would be hesitant to call this a "predictive" indicator, however the behavior of it would suggest it could be considered at least partially predictive
Essentially, the Anchored VWAPs creates something from otherwise nothing.
While the DC upper or lower values are staying flat, the VWAPs improvise based on price and volume to project a level that may be a better representation of where future highs or lows may settle.
Visually, this looks like we have cut off the corners of the Donchian Channel.
Note: Notice how we are calculating values before the corners are realized.
> Implementation
While this is only a concept indicator, The specific application I've gone with for this, is a sort of supertrend-ish display (A Trend Flipping Trailing Stop Loss).
The script uses basic logic to create a trend direction, and then displays the Anchored VWAPs as a form of trailing stop loss.
While "In Trend", the script fills in the area between the VWAP and Price in the direction of trend.
When new highs or lows are made while in trend, the opposite VWAP will start to generate at the new highs or lows. These happen on every new high or low, so they are not indicating the trend shift, but could be interpreted as breakout levels for the current trend direction in order for continuation.
Note: All values are drawn live, but when using higher timeframes, there is a natural calculation discrepancy when using live data vs. historical.
> Technicals
In this script, I'm simply detecting new highs or lows from the DC and using those as the anchor frequency on the built-in VWAP function.
So each time a new high or low is made based on DC, the VWAP function re-anchors to the high or low of the candle.
Past that, I have implemented some logic in order to account for a common occurrence I faced during development.
Frequently, the price would outpace the anchored VWAP, so we would end up with the VWAP being further from price than the actual DC upper or lower.
Due to this, what I have ended up with was a third value which, rather than switching between raw VWAP values and DC values, it adjusts the value based on the change in the VWAP value.
This can be simply thought of as a "Start + Change" type of setup.
By doing this, I can use the change values from the actual anchored VWAP, and under normal conditions, this will also be the true VWAP value.
However, situationally, I am able to update the start value which we're applying the VWAP change to.
In other words, when these situations happen, the VWAP change is added to the new (closer to price) DC value.
The specific trend logic being used is nothing fancy at all, we are simply checking if a new high or low is created and setting the trend in that direction.
This is in line with some traditional DC Strategies.
To those who made it here,
Just remember:
The chart may be ugly, but it's the fastest analysis of the data you can get.
Nicer displays often come at the hidden cost of latency.
You have to shoot your shot to make it.
Choose 2: Fast, Clean, Useful
Enjoy!

EMAS + SuperTrend+ Key Levels SpacemanBTC IDWMEma 200 800 supertrend and key levels.
Thanks to spaceman for making the code available.

Triple Trend v2 [DLL]Triple Trend v2 is a multi-layer trend detection tool using three customizable Supertrend calculations.
Plots three trend lines (short, medium, long) with independent ATR settings.
Highlights trend flips with labels (1, 2, 3) showing which trend(s) changed.
Integrates RSI reversal detection (fixed or dynamic) with optional reversal lines and labels.
Includes a bar-size filter to ignore insignificant flips.
Displays a multi-timeframe trend table for higher-timeframe confirmation.
Provides built-in alerts for flips, RSI thresholds, and reversals.

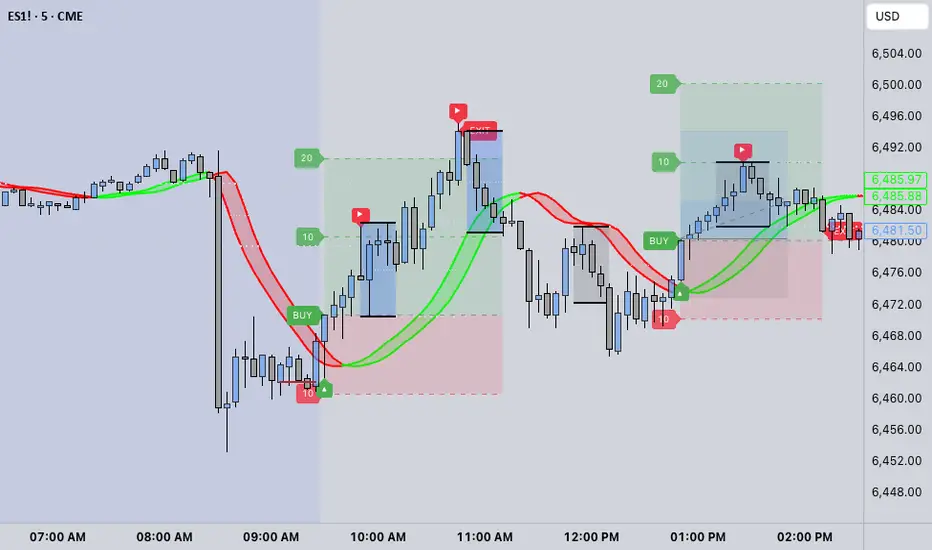
HMA V1 – Hull ATR SuperTrend with HTF Gate (Optimized for ES & NOverview
HMA V1 is a directional trend-following indicator designed for ES and NQ futures, combining a Hull ATR-based SuperTrend system with a Higher Timeframe HMA gate to filter entries. It can also be used on major indices and liquid stocks, but accuracy will be lower compared to ES/NQ optimization.
The indicator generates Buy and Sell signals based on the alignment of short-term price action with the higher timeframe trend filter. The logic is tuned for both scalping (more frequent signals, lower win rate) and day trading (fewer signals, higher win rate).
⸻
Signal Logic
1. Base Trend Engine:
• Uses an ATR-based Hull Moving Average (HMA) to dynamically calculate upper and lower bands for trend detection.
• Price crossing above the upper band in an uptrend = potential Buy trigger.
• Price crossing below the lower band in a downtrend = potential Sell trigger.
2. HTF HMA Gate Filter:
• All signals must pass a Higher Timeframe HMA check to confirm the broader trend direction.
• This acts as a noise filter, reducing false signals in choppy conditions.
3. Timeframe Behavior:
• Long Signals:
• Works best on 15m for day trading (higher win rate).
• 5m gives more scalping opportunities but with more false signals.
• If you want to trade longs, uncheck “Lock Long Signals to Specific Timeframe” for flexibility.
• Short Signals:
• Currently only coded to appear on 5m timeframe (bug to be fixed in future versions).
4. Partial Profit Logic (optional):
• Although not enforced in this version, the system is often used with partial profit-taking at fixed % targets and moving stops to breakeven after P1.
⸻
Best Use Practices:
• ES/NQ Futures: Best performance and most accurate filtering.
• Other Indices/Stocks: Usable but expect lower accuracy; re-tune ATR/HMA parameters for better results.
• Scalping: Use 5m for quicker entries, accept more noise.
• Day Trading: Use 15m for fewer, higher-probability setups.
• Always combine with your own market structure and higher timeframe bias for best results.
⸻
Known Bugs / Limitations:
• Long signal lock is sometimes overly restrictive — uncheck the “Lock Long Signals to Specific Timeframe” option to see more entries.
• Short signals currently only appear on the 5m timeframe.
🔍 Confirmed Scalping Signals (Stoch+EMA+Supertrend)🔍 Confirmed Scalping Signals (Stoch+EMA+Supertrend)