Key Session LevelsKey Session Levels - Indicator Guide
Created by: MecarderoAurum
Why This Indicator Exists: An Overview
The "Key Session Levels" indicator is a comprehensive tool for day traders that automatically plots the most critical price levels from the current premarket and the previous two full trading days. These levels are watched by countless traders and often act as significant areas of support and resistance.
This indicator provides a clear, objective map of these key zones, helping traders anticipate potential turning points, identify areas of confluence, and make more informed trading decisions without having to manually draw and manage these lines every day.
Features & How to Use Them
This indicator plots several types of important historical levels on your chart. Each one is fully customizable.
1. Premarket Levels (PMH / PML)
What they are: The highest (PMH) and lowest (PML) prices reached during the current day's premarket session (04:00 - 09:30 ET).
Why they matter: The premarket high and low are the first significant levels established for the trading day. They often act as initial support or resistance once the market opens.
How to use them: In the settings under "Premarket Levels," you can toggle the visibility of the PMH and PML, and customize their color, line style, and width.
2. Prior Day Levels (PDH / PDL / PDM / PDP)
What they are: The key price points from the previous full trading day.
PDH: Prior Day High
PDL: Prior Day Low
PDM: Prior Day Midpoint (the exact middle of the PDH and PDL)
PDP: Prior Day Pivot (a classic pivot point calculation)
Why they matter: These are often the most important levels for the current trading day. The market frequently tests the previous day's high and low.
How to use them: Under the "Prior Day" settings, you can enable or disable each of these four levels and customize their appearance.
3. 2-Day Prior Levels (PDH2 / PDL2 / etc.)
What they are: The same set of key levels (High, Low, Mid, Pivot) from two trading days ago.
Why they matter: These levels can still be highly relevant, especially if the market is trading within a multi-day range or returning to test a significant prior level.
How to use them: Under the "2-Day Prior" settings, you can customize the visibility and style of these levels. They are styled with more transparency by default to distinguish them from the more recent prior day's levels.
4. General Settings
Days of History: This setting allows you to control how many past days of historical lines are kept on your chart. This is excellent for back-testing strategies and seeing how price has reacted to these levels in the past.
Label Settings: You can customize the color and size of the on-chart labels (e.g., "PDH," "PML") for better visibility.
Sample Strategy: The Key Level Rejection
This strategy focuses on using the indicator's levels to identify potential reversals at key areas of support or resistance.
Identify a Key Level: Watch as the price approaches a significant level plotted by the indicator, such as the Prior Day High (PDH) or the Premarket Low (PML).
Look for Rejection: Do not trade simply because the price touches the level. Wait for a price action signal that confirms the level is holding. This could be a bearish engulfing candle or a shooting star pattern at a resistance level like PDH, or a bullish hammer or morning star pattern at a support level like PML.
Entry: Once you see a clear rejection candle, enter a trade in the direction of the rejection. For a bearish rejection at the PDH, you would enter a short position.
Stop-Loss: A logical place for a stop-loss is just above the high of the rejection candle (for a short trade) or just below the low of the rejection candle (for a long trade). This defines your risk clearly.
Profit Target: Your first profit target could be the next key level plotted by the indicator. For example, if you shorted a rejection at the PDH, your first target might be the Premarket High (PMH) or the day's opening price.
Pesquisar nos scripts por "session"
Intraday Session Levels: Pre-Mkt, 5m, 15m (Replay/Toggle/Labels)Intraday Session Levels: Pre-Mkt, 5m, 15m (Replay/Toggle/Labels)
Version v1.0
Live session levels for every trader!
This indicator automatically tracks and draws the most actionable intraday levels as they develop—live in real-time and fully compatible with TradingView’s bar replay and backtesting.
How it works:
Pre-Market High & Low:
Levels appear and update live as soon as the pre-market session starts (4:00am ET), then “freeze” at the official open (9:30am ET) and remain visible for the rest of the day.
First 5-Minute Candle High/Low:
Drawn instantly after the first 5-minute candle (9:30–9:35am ET) completes.
First 15-Minute Candle High/Low:
Drawn right after the first 15-minute candle (9:30–9:45am ET) completes.
Labels on every line
Each level is clearly labeled on your chart (“PreMkt High”, “5m Low”, “15m High”, etc).
Perfect for backtesting:
All levels display exactly as they would have appeared in real time, making this indicator fully bar replay and historical test compatible.
Flexible ON/OFF toggles:
Instantly show or hide Pre-Mkt, 5m, and 15m levels via the settings panel.
Why use it?
Identify support/resistance and key reaction zones intraday
Fade or break the opening range with confidence
Backtest your strategies with accurate historical context
Reduce chart clutter with customizable, minimal visuals
Whether you’re a scalper, day trader, or backtest enthusiast, this tool keeps your charts focused and your edge sharp.
Developed by

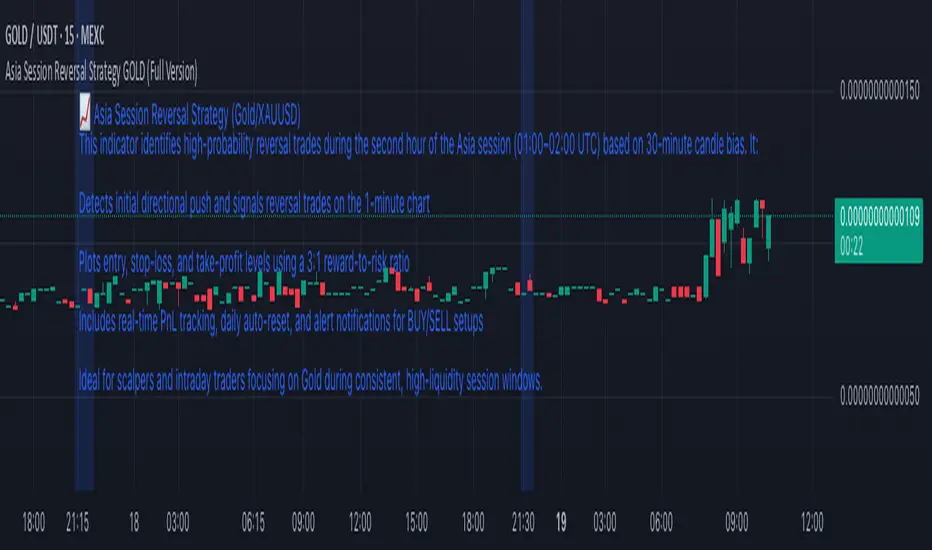
Asia Session Reversal Strategy GOLD (Full Version)📈 Asia Session Reversal Strategy (Gold/XAUUSD)
This indicator identifies high-probability reversal trades during the second hour of the Asia session (01:00–02:00 UTC) based on 30-minute candle bias. It:
Detects initial directional push and signals reversal trades on the 1-minute chart
Plots entry, stop-loss, and take-profit levels using a 3:1 reward-to-risk ratio
Includes real-time PnL tracking, daily auto-reset, and alert notifications for BUY/SELL setups
Ideal for scalpers and intraday traders focusing on Gold during consistent, high-liquidity session windows.
Swing Structure + Session Sweeps“Scalper-Friendly Trend & Sweep Detector”
Swing Structure + Session Sweeps with TEMA Cloud
This powerful all-in-one tool is designed for intraday traders, swing traders, and scalpers who want to spot high-probability reversals, trend continuations, and liquidity sweeps with confluence.
🔹 Core Features
Multi-layered TEMA Cloud (9, 20, 34, 50) for clear trend structure
Dynamic Bull/Bear labels when the trend flips
Centerline for TEMA 20 to visualize core trend direction
Session-based liquidity sweep detection (Asia, London, NY)
Volume and absorption dots to catch hidden pressure
Swing high/low detection (external and internal)
Visual VWAP, daily highs/lows, and customizable session zones
Optional alerts for volume spikes, absorption, and reversal sweeps
📈 Use it to:
Confirm directional bias
Anticipate pullbacks and breakouts
Identify volume-backed reversals
Align trades with session strength and swing confluence
⚙️ Built for scalpers, intraday opportunists, and precision chartists alike.

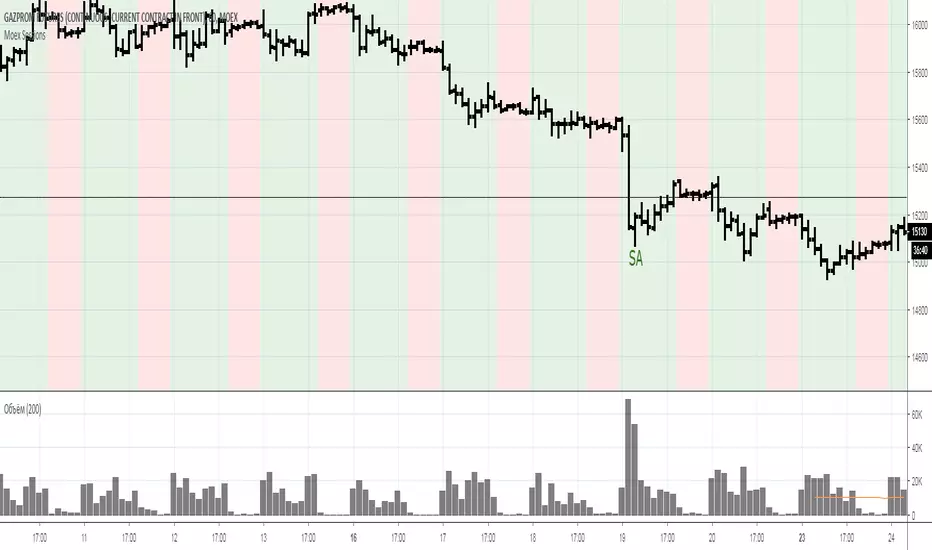
Open interest buildup & Session Open high-lowThis indicator is to be used on srcipts in Futures Segment.
1. It visually displays in tabular format the change in open interest and the change in price compared to the previous day.
2. It also displays the scenario where open price of session is near high price of session or low price of session, indicating a emergence of strong sellers or strong buyers from start of session respectively.
3. A positive change in open interest and a positive change in price is denoted by a long buildup and open price near low price is an additional confirmation for a probable long scenario in the script.
4. A positive change in open interest and a negative change in price is denoted by a short buildup and open price near high price is and additional confirmation for a probable short scenario in the script.
Key features of the indicator include:
Override Symbol Input: Traders can override the default symbol and input their preferred symbol for analysis.
Open Interest Data: The indicator retrieves open interest data for the selected symbol and time frame, facilitating analysis based on changes in open interest.
Dashboard: The indicator features a customizable dashboard that displays key information such as build-up conditions, OI change, and price change.
Build-Up Conditions: The indicator identifies long build-up and short build-up scenarios based on user-defined thresholds for OI change and price change percentages.
Customization Options: Traders have the flexibility to customize various aspects of the indicator, including colors for long build-up, short build-up, positive OI change, negative OI change, positive price change, and negative price change.
Label Plots: Buy and sell labels are plotted on the chart to highlight potential trading opportunities. Traders can customize the colors and text colors of these labels based on their preferences.
Overall, the indicator offers traders a comprehensive tool for analyzing price movements and open interest changes, helping them make informed trading decisions in the futures segment.

Extended Hour CandleThe Extended Hour Candle shows extended hour candle formations on the Daily chart. This indicator can be useful for those who want to analyse price movements during extended trading sessions without switching to intraday charts with "Extended trading hours" enabled.
How to Use:
Add the Extended Hour Candle indicator to a TradingView chart.
Adjust the color settings according to personal preferences, using the options to set the desired colors for up and down candles.
See the Candle during extended trading hours on the Daily chart

ICT Session Opening FVG / Silver Bullet [MK]Students of ICT concepts will know that the first FVG found within particular session periods can identify an important price level for intraday traders.
"Find the first FVG at the start of the session and drag a box from it to the right"....ICT
The script finds the first FVG (either bull or bear) within the following periods:
London Killzone (0200 - 0500) EST
02:00 - 0259
03:00 - 0359
0400 - 0459
Dead Zone (05-00 - 0600) EST
05-00 - 0559
0600 - 0659
NY AM Killzone (0700 - 1100) EST
0700 - 0759
0830 - 0929
0929 - 0959
1000 - 1100 (Silver Bullet)
A chart higher timeframe can be chosen to detect the FVGs and they will be displayed on lower timeframe. Default is 5min for detection. I like to then following price reacting to 5mi FVGs on a 1 min chart.
FVG boxes can be extended to the end of the session, or to any time within the current days trading hours. Colors/Labels/ Session Periods can all be edited. A maximum timeframe for display is available and
timezone can be adjusted.
FVGs are only shown for the current days trading hours.

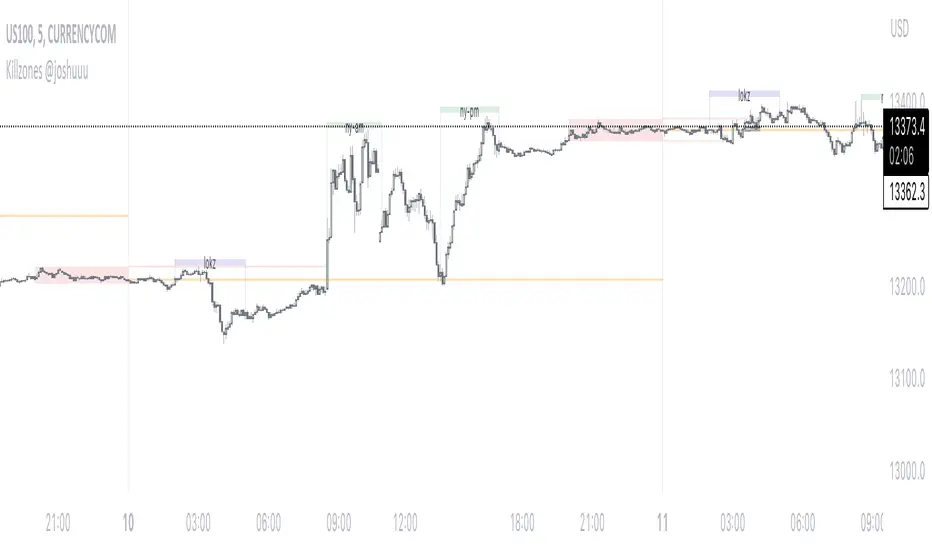
Killzones @joshuuuThis Indicator is based on "ICT Killzones" - sessions in which price moves the "cleanest" and usually has the most volume.
The script is able to either display Killzones as a Label above current bars, or in form of lines on top or bottom of the charts.
Also, the user is able to choose between Forex Killzones and Indices Killzones.
times for killzones:
Forex
-London 0200-0500
-NY 0700-1000
Indices
-London 0200-0500
-NY AM 0830-1100
-NY PM 1330-1600
⚠️ Open Source ⚠️
Coders and TV users are authorized to copy this code base, but a paid distribution is prohibited. A mention to the original author is expected, and appreciated.
⚠️ Terms and Conditions ⚠️
This financial tool is for educational purposes only and not financial advice. Users assume responsibility for decisions made based on the tool's information. Past performance doesn't guarantee future results. By using this tool, users agree to these terms.

Time Sessions - S/RThis scripts shows you some time sessions such as NY open, NY mid, London Open and Daily Close for UTC - 0
It also plots resistance and support based on the last 15 candles but you can change it in settings.

Market Sessions(4sessions)Special for CLUB SM))) Special for CLUB SM))) Special for CLUB SM))) Special for CLUB SM))) Special for CLUB SM))) Special for CLUB SM))) Special for CLUB SM))) Special for CLUB SM))) Special for CLUB SM))) Special for CLUB SM))) Special for CLUB SM))) Special for CLUB SM))) Special for CLUB SM))) Special for CLUB SM))) Special for CLUB SM))) Special for CLUB SM))) Special for CLUB SM))) Special for CLUB SM))) Special for CLUB SM))) Special for CLUB SM))) Special for CLUB SM))) Special for CLUB SM))) Special for CLUB SM))) Special for CLUB SM))) Special for CLUB SM))) Special for CLUB SM))) Special for CLUB SM))) Special for CLUB SM))) Special for CLUB SM))) Special for CLUB SM))) Special for CLUB SM))) Special for CLUB SM))) Special for CLUB SM))) Special for CLUB SM))) Special for CLUB SM))) Special for CLUB SM))) Special for CLUB SM))) Special for CLUB SM))) Special for CLUB SM))) Special for CLUB SM))) Special for CLUB SM))) Special for CLUB SM))) Special for CLUB SM))) Special for CLUB SM))) Special for CLUB SM))) Special for CLUB SM))) Special for CLUB SM))) Special for CLUB SM))) Special for CLUB SM))) Special for CLUB SM))) Special for CLUB SM))) Special for CLUB SM))) Special for CLUB SM))) Special for CLUB SM))) Special for CLUB SM))) Special for CLUB SM))) Special for CLUB SM))) Special for CLUB SM))) Special for CLUB SM))) Special for CLUB SM))) Special for CLUB SM))) Special for CLUB SM))) Special for CLUB SM))) Special for CLUB SM))) Special for CLUB SM))) Special for CLUB SM))) Special for CLUB SM))) Special for CLUB SM))) Special for CLUB SM))) Special for CLUB SM))) Special for CLUB SM))) Special for CLUB SM))) Special for CLUB SM))) Special for CLUB SM))) Special for CLUB SM))) Special for CLUB SM))) Special for CLUB SM))) Special for CLUB SM))) Special for CLUB SM))) Special for CLUB SM))) Special for CLUB SM))) Special for CLUB SM))) Special for CLUB SM))) Special for CLUB SM))) Special for CLUB SM))) Special for CLUB SM))) Special for CLUB SM))) Special for CLUB SM))) Special for CLUB SM))) Special for CLUB SM))) Special for CLUB SM))) Special for CLUB SM))) Special for CLUB SM))) Special for CLUB SM))) Special for CLUB SM))) Special for CLUB SM))) Special for CLUB SM))) Special for CLUB SM))) Special for CLUB SM))) Special for CLUB SM))) Special for CLUB SM))) Special for CLUB SM))) Special for CLUB SM))) Special for CLUB SM))) Special for CLUB SM))) Special for CLUB SM))) Special for CLUB SM))) Special for CLUB SM))) Special for CLUB SM))) Special for CLUB SM))) Special for CLUB SM))) Special for CLUB SM))) Special for CLUB SM))) Special for CLUB SM))) Special for CLUB SM))) Special for CLUB SM))) Special for CLUB SM))) Special for CLUB SM))) Special for CLUB SM))) Special for CLUB SM))) Special for CLUB SM))) Special for CLUB SM))) Special for CLUB SM))) Special for CLUB SM))) Special for CLUB SM))) Special for CLUB SM))) Special for CLUB SM))) Special for CLUB SM))) Special for CLUB SM))) Special for CLUB SM))) Special for CLUB SM))) Special for CLUB SM))) Special for CLUB SM))) Special for CLUB SM))) Special for CLUB SM))) Special for CLUB SM))) Special for CLUB SM))) Special for CLUB SM))) Special for CLUB SM))) Special for CLUB SM))) Special for CLUB SM))) Special for CLUB SM))) Special for CLUB SM))) Special for CLUB SM))) Special for CLUB SM))) Special for CLUB SM))) Special for CLUB SM))) Special for CLUB SM))) Special for CLUB SM))) Special for CLUB SM))) Special for CLUB SM))) Special for CLUB SM))) Special for CLUB SM))) Special for CLUB SM))) Special for CLUB SM))) Special for CLUB SM))) Special for CLUB SM))) Special for CLUB SM))) Special for CLUB SM))) Special for CLUB SM))) Special for CLUB SM))) Special for CLUB SM))) Special for CLUB SM))) Special for CLUB SM))) Special for CLUB SM))) Special for CLUB SM))) Special for CLUB SM))) Special for CLUB SM))) Special for CLUB SM))) Special for CLUB SM))) Special for CLUB SM))) Special for CLUB SM))) Special for CLUB SM))) Special for CLUB SM))) Special for CLUB SM))) Special for CLUB SM))) Special for CLUB SM))) Special for CLUB SM))) Special for CLUB SM))) Special for CLUB SM))) Special for CLUB SM))) Special for CLUB SM))) Special for CLUB SM))) Special for CLUB SM))) Special for CLUB SM))) Special for CLUB SM))) Special for CLUB SM))) Special for CLUB SM))) Special for CLUB SM))) Special for CLUB SM))) Special for CLUB SM))) Special for CLUB SM))) Special for CLUB SM))) Special for CLUB SM))) Special for CLUB SM))) Special for CLUB SM))) Special for CLUB SM))) Special for CLUB SM))) Special for CLUB SM))) Special for CLUB SM))) Special for CLUB SM))) Special for CLUB SM))) Special for CLUB SM))) Special for CLUB SM))) Special for CLUB SM))) Special for CLUB SM))) Special for CLUB SM))) Special for CLUB SM))) Special for CLUB SM))) Special for CLUB SM))) Special for CLUB SM))) Special for CLUB SM))) Special for CLUB SM))) Special for CLUB SM))) Special for CLUB SM))) Special for CLUB SM))) Special for CLUB SM))) Special for CLUB SM))) Special for CLUB SM))) Special for CLUB SM))) Special for CLUB SM))) Special for CLUB SM))) Special for CLUB SM))) Special for CLUB SM))) Special for CLUB SM))) Special for CLUB SM))) Special for CLUB SM))) Special for CLUB SM))) Special for CLUB SM))) Special for CLUB SM))) Special for CLUB SM))) Special for CLUB SM))) Special for CLUB SM))) Special for CLUB SM))) Special for CLUB SM))) Special for CLUB SM))) Special for CLUB SM))) Special for CLUB SM))) Special for CLUB SM))) Special for CLUB SM))) Special for CLUB SM))) Special for CLUB SM))) Special for CLUB SM))) Special for CLUB SM))) Special for CLUB SM))) Special for CLUB SM))) Special for CLUB SM))) Special for CLUB SM))) Special for CLUB SM))) Special for CLUB SM))) Special for CLUB SM))) Special for CLUB SM))) Special for CLUB SM))) Special for CLUB SM)))

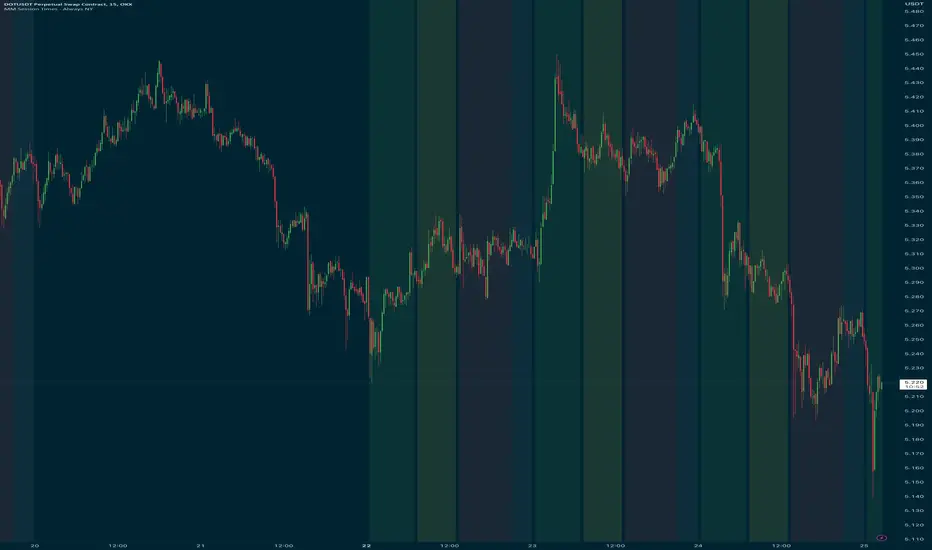
Market Maker Session TimesThis indicator is design to mark out the session times for the Market Maker Method. All times are on NY time however you do not need to change your personal timezone.
The colours are also changeable, here's what the standard version are:
Asia Session - Green
UK Session - Yellow
US Session - Red
Dead Zone - Grey
Single Prints - Session Initial BalancesDisclaimer: Expose yourself to the knowledge of different trading methods. If you are unaware of what a Single Print is then do some research and broaden your knowledge.
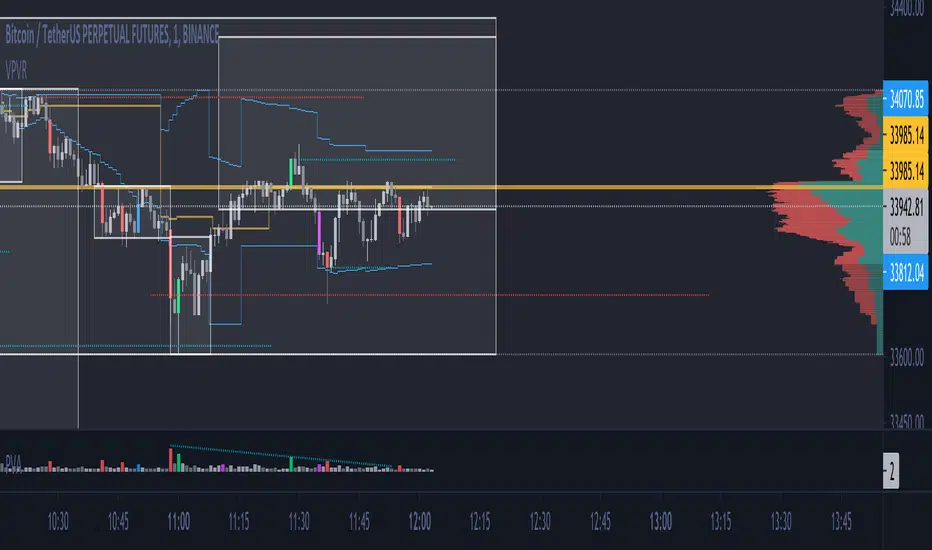
This indicator has only been tested on BTCUSDT Binance pair. This indicator is meant to be used on the 30 minute timeframe to highlight Single Prints.
The calculations are base on 0000 UTC and what Single Prints are created during that day.
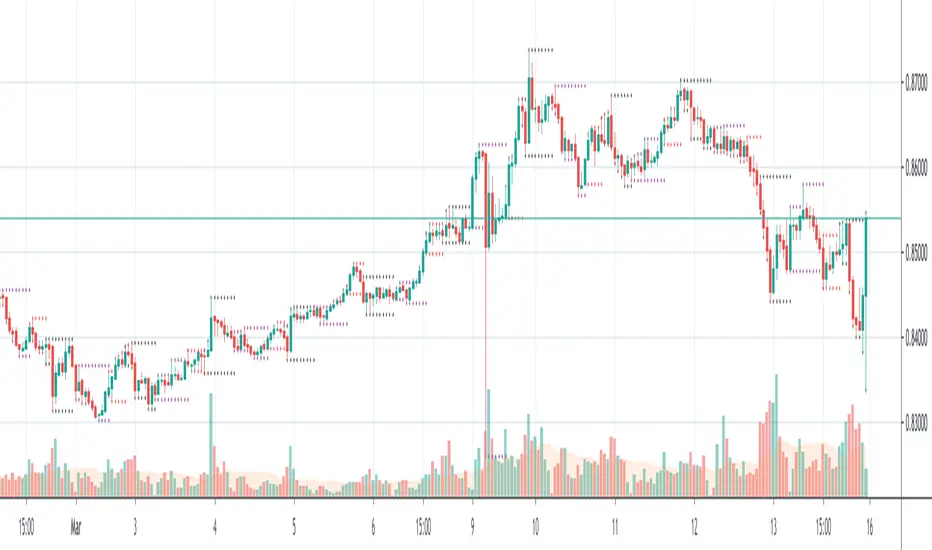
Single Prints
Single Prints are where prices moves to fast through an area (on a 30 minute timeframe), in the case of this indicator in $50 intervals, where the price has not yet cross back past, represented as orange lines. If you were viewing this on a Time Price Opportunity Chart (TPO) each $50 would be represented as a square with a letter in it. If price has only been through that area once, within that 24 hour period, then it is called a Single Print. If however the Single Print is on the lower wick of the candle it is called a Buying Tail and on the Upper Wick a Selling Tail.
Single Prints leave low volume nodes with liquidity gaps, these inefficient moves tend to get filled, and we can seek trading opportunities once they get filled, or we can also enter before they get filled and use these single prints as targets.
Single Prints are a sign of emotional buying or selling as very little time was spent at those levels and thus there is no value there.
The endpoints of single print sections are considered to be potential support or resistance points and or get filled (like a CME gap).
The above is only a very short summary, to understand Single Prints, Buying Tails and Selling Tails more please do your own research (DYOR).
References:
Trading Riot Volume Profile - Website
TOROS TPO Charts Explained - Youtube
Session Boxes
Session Boxes are the high and low of that markets session before the new market session opens. I used the data from the website Trading Hours for the time input.
White box – Start of day UTC 0000 to Market Close UTC 2000
Purple box – Asia Start UTC 0130 to London Start UTC 0700
Yellow box – London Start UTC 0700 to New York Start UTC 1330
Blue box – New York Start UTC 1330 to Market Close UTC 2000
Red box – Market Close UTC 2000 to End of day UTC 2359
References:
Trading Hours - Website
Initial Balance
The Initial Balance is the market range between the high and low of the first hour of trading for the market. In the case of crypto when is the Initial Balance if it is 24/7.
Context of Initial Balance:
The Initial Balance is traditionally the range of prices transacted in the first hour of trade. Many regard the Initial Balance as a significant range because, especially for the index futures which are tied to the underlying stocks, orders entered overnight or before the open are typically executed prior to the end of the first hour of trade. Some use it to understand how the rest of the day may develop, while others use it as a span of time to avoid trading altogether because of its potential volatility.
For this indicator I have coded the Initial Balance time as below:
White Box - To appear for the first hour of the day 0000 to 0100 UTC .
Purple Box - To appear for the first hour of the day 0130 to 0230 UTC .
Yellow Box - To appear for the first hour of the day 0700 to 0800 UTC .
Blue Box - To appear for the first hour of the day 1330 to 1430 UTC .
Red Box - To appear for the first hour of the day 2000 to 2100 UTC .
The diagram above shows some examples:
How price (white arrows) retraces the single prints.
How price (red arrows) uses the single prints as S/R.
References:
Not Hard Trading – Website
My Pivots Initial Balance - Website
Thanks go to:
StackOverFlow Bjorn Mistiaen
Trading View user mvs1231
Please message me if you have any feedback/questions.
I am looking at developing this indicator further in the future.

ICT Market SessionsThis indicator highlights sessions, kill-zones and significant time elements on the chart based on ITC's method.

Trading Sessions by Aflaq for UF TradersThis indicator is meant for traders under the UF Program who needs a quick way to show multiple sessions high and low
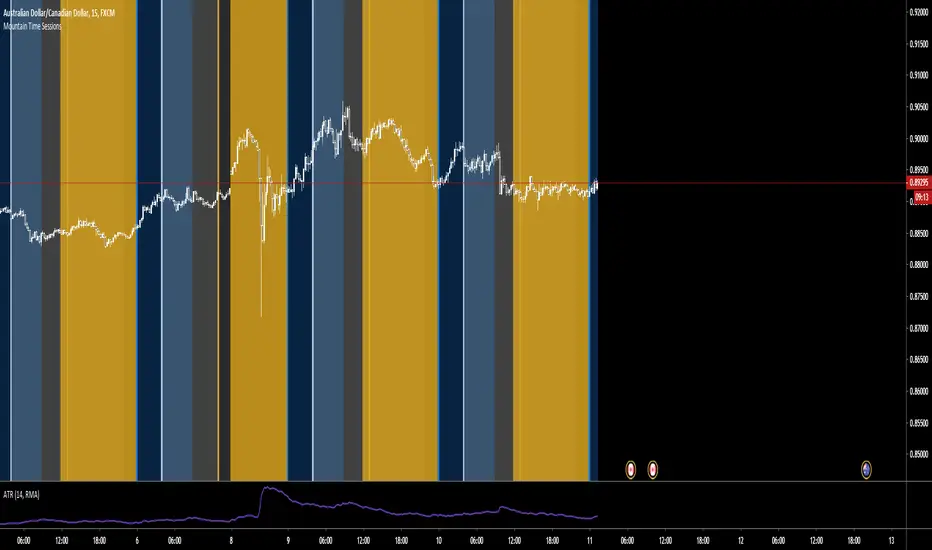
Mountain Time SessionsEdited sessions time zones for people in the Mountain Time Zone. thanks to original creator ChrisMoody.

Market Profile for Futures with Session and After Hours SplitAdapted existing Market Profile scripts to be move suitable for Futures Markets with Session and After Hours split
Script Provides split Market Profiles for Session and After Hours
Users can customize the Session and AH hours inputs to suit any ticker and their interpretation of prime and non-prime hours

Fx Sessions For CryptoFx Sessions for crypto traders. High Volatility occurs at weekends, and NY-Assia overlap in week days.