Three-Step 9:30 Range Scalping# Three-Step 9:30 Range Scalping Strategy Rules
## Step 1: Mark the Levels (9:30 AM)
- Wait for the **first 5-minute candle** starting at 9:30 AM EST to close
- Mark the **HIGH** and **LOW** of this candle
- Switch to **1-minute chart** for trading
## Step 2: Find Your Entry (Trade for 1 hour only: 9:30-10:30 AM)
### BREAK Entry
- Need: **Fair Value Gap (FVG)** + **ANY** of the 3 FVG candles closes outside the range
- FVG = Gap between candle wicks (3-candle pattern)
### TRAP Entry
- Need: Break outside range → Retest back inside → Close back outside again
### REVERSAL Entry
- Need: Failed break in one direction → Opposite FVG back into the range
## Step 3: Trade Management
### Stop Loss:
- **Break/Trap**: Low/High of first candle that closed outside the range
- **Reversal**: Low/High of first candle in the FVG pattern
### Take Profit:
- **Always 2:1 risk-to-reward ratio**
- If you risk $100, you make $200
## Key Rules:
- ✅ **Body close** outside range (not just wicks)
- ✅ Trade on **1-minute chart** only
- ✅ Only trade **first hour** (9:30-10:30 AM EST)
- ✅ **Fixed 2:1** take profit every time
- ✅ One strategy, stay consistent
**That's it. No complicated indicators, no higher timeframe bias, no guesswork.**
Pesquisar nos scripts por "scalping"

FlowStateTrader FlowState Trader - Advanced Time-Filtered Strategy
## Overview
FlowState Trader is a sophisticated algorithmic trading strategy that combines precision entry signals with intelligent time-based filtering and adaptive risk management. Built for traders seeking to achieve their optimal performance state, FlowState identifies high-probability trading opportunities within user-defined time windows while employing dynamic trailing stops and partial position management.
## Core Strategy Philosophy
FlowState Trader operates on the principle that peak trading performance occurs when three elements align: **Focus** (precise entry signals), **Flow** (optimal time windows), and **State** (intelligent position management). This strategy excels at finding reversal opportunities at key support and resistance levels while filtering out suboptimal trading periods to keep traders in their optimal flow state.
## Key Features
### 🎯 Focus Entry System
**Support/Resistance Zone Trading**:
- Dynamic identification of key price levels using configurable lookback periods
- Entry signals triggered when price interacts with these critical zones
- Volume confirmation ensures genuine breakout/reversal momentum
- Trend filter alignment prevents counter-trend disasters
**Entry Conditions**:
- **Long Signals**: Price closes above support buffer, touches support level, with above-average volume
- **Short Signals**: Price closes below resistance buffer, touches resistance level, with above-average volume
- Optional trend filter using EMA or SMA for directional bias confirmation
### ⏰ FlowState Time Filtering System
**Comprehensive Time Controls**:
- **12-Hour Format Trading Windows**: User-friendly AM/PM time selection
- **Multi-Timezone Support**: UTC, EST, PST, CST with automatic conversion
- **Day-of-Week Filtering**: Trade only weekdays, weekends, or both
- **Lunch Hour Avoidance**: Automatically skips low-volume lunch periods (12-1 PM)
- **Visual Time Indicators**: Background coloring shows active/inactive trading periods
**Smart Time Features**:
- Handles overnight trading sessions seamlessly
- Prevents trades during historically poor performance periods
- Customizable trading hours for different market sessions
- Real-time trading window status in dashboard
### 🛡️ Adaptive Risk Management
**Multi-Level Take Profit System**:
- **TP1**: First profit target with optional partial position closure
- **TP2**: Final profit target for remaining position
- **Flexible Scaling**: Choose number of contracts to close at each level
**Dynamic Trailing Stop Technology**:
- **Three Operating Modes**:
- **Conservative**: Earlier activation, tighter trailing (protect profits)
- **Balanced**: Optimal risk/reward balance (recommended)
- **Aggressive**: Later activation, wider trailing (let winners run)
- **ATR-Based Calculations**: Adapts to current market volatility
- **Automatic Activation**: Engages when position reaches profitability threshold
### 📊 Intelligent Position Sizing
**Contract-Based Management**:
- Configurable entry quantity (1-1000 contracts)
- Partial close quantities for profit-taking
- Clear position tracking and P&L monitoring
- Real-time position status updates
### 🎨 Professional Visualization
**Enhanced Chart Elements**:
- **Entry Zone Highlighting**: Clear visual identification of trading opportunities
- **Dynamic Risk/Reward Lines**: Real-time TP and SL levels with price labels
- **Trailing Stop Visualization**: Live tracking of adaptive stop levels
- **Support/Resistance Lines**: Key level identification
- **Time Window Background**: Visual confirmation of active trading periods
**Dual Dashboard System**:
- **Strategy Dashboard**: Real-time position info, settings status, and current levels
- **Performance Scorecard**: Live P&L tracking, win rates, and trade statistics
- **Customizable Sizing**: Small, Medium, or Large display options
### ⚙️ Comprehensive Customization
**Core Strategy Settings**:
- **Lookback Period**: Support/resistance calculation period (5-100 bars)
- **ATR Configuration**: Period and multipliers for stops/targets
- **Reward-to-Risk Ratios**: Customizable profit target calculations
- **Trend Filter Options**: EMA/SMA selection with adjustable periods
**Time Filter Controls**:
- **Trading Hours**: Start/end times in 12-hour format
- **Timezone Selection**: Four major timezone options
- **Day Restrictions**: Weekend-only, weekday-only, or unrestricted
- **Session Management**: Lunch hour avoidance and custom periods
**Risk Management Options**:
- **Trailing Stop Modes**: Conservative/Balanced/Aggressive presets
- **Partial Close Settings**: Enable/disable with custom quantities
- **Alert System**: Comprehensive notifications for all trade events
### 📈 Performance Tracking
**Real-Time Metrics**:
- Net profit/loss calculation
- Win rate percentage
- Profit factor analysis
- Maximum drawdown tracking
- Total trade count and breakdown
- Current position P&L
**Trade Analytics**:
- Winner/loser ratio tracking
- Real-time performance scorecard
- Strategy effectiveness monitoring
- Risk-adjusted return metrics
### 🔔 Alert System
**Comprehensive Notifications**:
- Entry signal alerts with price and quantity
- Take profit level hits (TP1 and TP2)
- Stop loss activations
- Trailing stop engagements
- Position closure notifications
## Strategy Logic Deep Dive
### Entry Signal Generation
The strategy identifies high-probability reversal points by combining multiple confirmation factors:
1. **Price Action**: Looks for price interaction with key support/resistance levels
2. **Volume Confirmation**: Ensures sufficient market interest and liquidity
3. **Trend Alignment**: Optional filter prevents counter-trend positions
4. **Time Validation**: Only trades during user-defined optimal periods
5. **Zone Analysis**: Entry occurs within calculated buffer zones around key levels
### Risk Management Philosophy
FlowState Trader employs a three-tier risk management approach:
1. **Initial Protection**: ATR-based stop losses set at strategy entry
2. **Profit Preservation**: Trailing stops activate once position becomes profitable
3. **Scaled Exit**: Partial profit-taking allows for both security and potential
### Time-Based Edge
The time filtering system recognizes that not all trading hours are equal:
- Avoids low-volume, high-spread periods
- Focuses on optimal liquidity windows
- Prevents trading during news events (lunch hours)
- Allows customization for different market sessions
## Best Practices and Optimization
### Recommended Settings
**For Scalping (1-5 minute charts)**:
- Lookback Period: 10-20
- ATR Period: 14
- Trailing Stop: Conservative mode
- Time Filter: Major session hours only
**For Day Trading (15-60 minute charts)**:
- Lookback Period: 20-30
- ATR Period: 14-21
- Trailing Stop: Balanced mode
- Time Filter: Extended trading hours
**For Swing Trading (4H+ charts)**:
- Lookback Period: 30-50
- ATR Period: 21+
- Trailing Stop: Aggressive mode
- Time Filter: Disabled or very broad
### Market Compatibility
- **Forex**: Excellent for major pairs during active sessions
- **Stocks**: Ideal for liquid stocks during market hours
- **Futures**: Perfect for index and commodity futures
- **Crypto**: Effective on major cryptocurrencies (24/7 capability)
### Risk Considerations
- **Market Conditions**: Performance varies with volatility regimes
- **Timeframe Selection**: Lower timeframes require tighter risk management
- **Position Sizing**: Never risk more than 1-2% of account per trade
- **Backtesting**: Always test on historical data before live implementation
## Educational Value
FlowState serves as an excellent learning tool for:
- Understanding support/resistance trading
- Learning proper time-based filtering
- Mastering trailing stop techniques
- Developing systematic trading approaches
- Risk management best practices
## Disclaimer
This strategy is for educational and informational purposes only. Past performance does not guarantee future results. Trading involves substantial risk of loss and is not suitable for all investors. Users should thoroughly backtest the strategy and understand all risks before live trading. Always use proper position sizing and never risk more than you can afford to lose.
---
*FlowState Trader represents the evolution of systematic trading - combining classical technical analysis with modern risk management and intelligent time filtering to help traders achieve their optimal performance state through systematic, disciplined execution.*

AUD/USD 1-Min Scalping Strategy with LabelsHere’s a complete TradingView Pine Script v5 for the 1-minute AUD/USD scalping strategy we just discussed. This strategy uses:
EMA 13 and EMA 26 for trend filtering
Bollinger Bands for volatility extremes
RSI (4) for momentum confirmation

ChopFlow ATR Scalp StrategyA lean, high-velocity scalp framework for NQ and other futures that blends trend clarity, volume confirmation, and adaptive exits to give you precise, actionable signals—no cluttered bands or lagging indicators.
⸻
🔍 Overview
This strategy locks onto rapid intraday moves by:
• Filtering for directional momentum with the Choppiness Index (CI)
• Confirming conviction via On-Balance Volume (OBV) against its moving average
• Automatically sizing stops and targets with a multiple of the Average True Range (ATR)
It’s designed for scalp traders who need clean, timely entries without wading through choppy noise.
⸻
⚙️ Key Features & Inputs
1. ATR Length & Multiplier
• Controls exit distances based on current volatility.
2. Choppiness Length & Threshold
• Measures trend strength; only fires when the market isn’t “stuck in the mud.”
3. OBV SMA Length
• Smoothes volume flow to confirm genuine buying or selling pressure.
4. Custom Session Hours
• Avoid overnight gaps or low-liquidity periods.
All inputs are exposed for rapid tuning to your preferred scalp cadence.
🚀 How It Works
1. Long Entry triggers when:
• CI < threshold (strong trend)
• OBV > its SMA (positive volume flow)
• You’re within the defined session
2. Short Entry mirrors the above (CI < threshold, OBV < SMA)
3. Exit uses ATR × multiplier for both stop-loss and take-profit
⸻
🎯 Usage Tips
• Start with defaults (ATR 14, multiplier 1.5; CI 14, threshold 60; OBV SMA 10).
• Monitor signal frequency, then tighten/loosen CI or OBV look-back as needed.
• Pair with a fast MA crossover or price-action trigger if you want even sharper timing.
• Backtest across different sessions (early open vs. power hours) to find your edge.
⸻
⚠️ Disclaimer
This script is provided “as-is” for educational and research purposes. Always paper-trade any new setup extensively before deploying live capital, and adjust risk parameters to your personal tolerance.
⸻
Elevate your scalp game with ChopFlow ATR—where trend, volume, and volatility converge for clear, confident entries. Happy scalping!

Morning Scalp StrategyThe Morning Scalp Strategy combines the 50EMA with the Stochastic Momentum Index. The morning period is when penny stocks usually have the highest volatility, so the strategy works between 10:00 AM and 12:10 PM.
***It opens only long positions. The ideal timeframe for this scalping strategy is 5 minutes on low-price stocks. The stock should spike in the morning with momentum and Volume.
***Look for a daily or intraday support area, close to the open position, to increase the confidence in the play
The components are:
- EMA50: Exponential Moving Average (EMA50)
- Stochastic Momentum Index (SMI)
Rules:
- Period: 10:00 AM and 12:10 PM
- if SMI Crossover and SMI < 0, open a position
- If close < EMA50, close the position
- Profit target: To be decided by the user, default value = 10% above the entry price
If you have any questions, let me know!

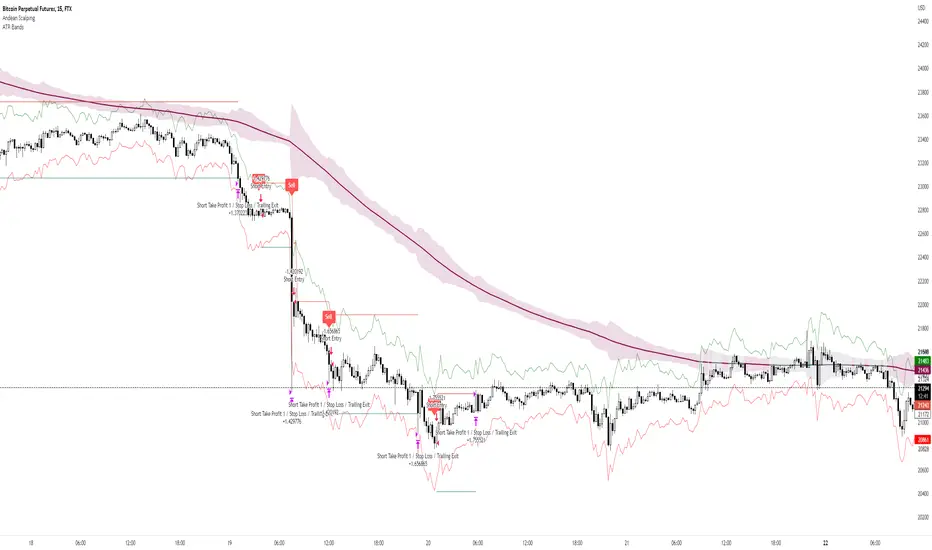
Andean ScalpingAndean Scalping Implementation - BETA
- Uses Andean Oscillator: alpaca.markets
- Implements a threshold moving average (SMA 1000) on the Andean Signal line at 1.1 factor to filter out small moves
- TP/SL using ATR bands at 3x multiplier
Bollinger Bands + EMA 9A 1 minute scalping strategy.
Uses Bollinger Bands (no basis line) and a 9 period EMA.
Waits for price to close below the lower Bollinger Band and the next candle to close bullish above the lower Bollinger Band but below the 9 Period EMA.
If all conditions are met, the script enters a long position with TP at the 9 Period EMA.

MACD Willy StrategyThis strategy is mainly developed for scalping / intraday trading. It could potentially be used to identify entry/exit signals for short term options trading. It performs decently well on popular stocks when used on time frames between 5 min to 15 min using regular session bar data. It combines 3 popular indicators, EMA, MACD, and William %range, to generate both long and short signals.
EMA:
Default is 200 EMA line.
MACD:
Default is 12/26 lengths for fast/slow signal inputs.
William %R - Smoothed (Published):
This is a custom indicator that generates two moving average lines from the original William %R line.
How it works:
Entry conditions:
1. Long/short entries when bar closes above/below EMA line
2. Long/short entries when MACD line is above/below signal line (histogram > 0 for long, < 0 for short)
3. Long/short entries when William %R fast MA line is above/below slow MA line
Exit conditions:
1. Exit long when MACD line is below signal line, vise versa for exit short
2. Exit long when William %R fast MA line is below slow MA line, vise versa for exit short
3. Exit long when William %R fast MA line must in below the overbought (-20) limit, exit short when above the oversold (-80) limit.
***Note that parameters are NOT optimized for any particular stocks / instruments.
Enjoy~~!!

EDMA Scalping Strategy (Exponentially Deviating Moving Average)This strategy uses crossover of Exponentially Deviating Moving Average (MZ EDMA ) along with Exponential Moving Average for trades entry/exits. Exponentially Deviating Moving Average (MZ EDMA ) is derived from Exponential Moving Average to predict better exit in top reversal case.
EDMA Philosophy
EDMA is calculated in following steps:
In first step, Exponentially expanding moving line is calculated with same code as of EMA but with different smoothness (1 instead of 2).
In 2nd step, Exponentially contracting moving line is calculated using 1st calculated line as source input and also using same code as of EMA but with different smoothness (1 instead of 2).
In 3rd step, Hull Moving Average with 2/3 of EDMA length is calculated using final line as source input. This final HMA will be equal to Exponentially Deviating Moving Average.
EDMA Defaults
Currently default EDMA and EMA length is set to 20 period which I've found better for higher timeframes but this can be adjusted according to user's timeframe. I would soon add Multi Timeframe option in script too. Chikou filter's period is set to 25.
Additional Features
EMA Band: EMA band is shown on chart to better visualize EMA cross with EDMA .
Dynamic Coloring: Chikou Filter library is used for derivation of dynamic coloring of EDMA and its band.
Trade Confirmation with Chikou Filter: Trend filteration from Chikou filter library is used as an option to enhance trades signals accuracy.
Strategy Default Test Settings
For backtesting purpose, following settings are used:
Initial capital=10000 USD
Default quantity value = 5 % of total capital
Commission value = 0.1 %
Pyramiding isn't included.
Backtesting data never assures that the same results would occur in future and also above settings use very less of total portfolio for trades, which in a way results less maximum drawdown along with less total profit on initial capital too. For example, increasing default quantity value will definity increase maximum drawdown value. The other way is also to use fix contracts in backtesting but it all depends on users general practice. Best option is to explore backtesting results with manually modified settings on different charts, before trusting them for other uses in future.
Usage and In-Detail Backtesting
This strategy has built-in option to enable trade confirmations with Chikou filter which will reduce the total number of trades increasing profit factor.
Symmetrically Weighted Moving Average (SWMA) on input source, may risk repainting in real-time data. Better option is to run a trade on bar close or simply left this optin unchecked.
I've set Chikou filter unchecked to increase number of trades (greater than 100) on higher timeframe (12H) and this can be changed according to your precision requirement and timeframe.
Timeframes lower than 4H usually have more noise. So its better to use higher EDMA and EMA length on lower timeframes which will decrease total number of offsetting trades increasing average total number of bars within a single trade.
Original "Exponentially Deviating Moving Average (MZ EDMA )" Indicator can be found here.

Contrarian Scalping Counter Trend Bb Envelope Adx and StochasticContrarian Scalping is an trading strategy designed to take advanted of a counter-trend.
The advantage of these strrategies types is that they have a good profitability but with do not great gain (in relation at the time frame).
Indicators used:
Bollinger
Envelope
ADX
Stochastic
Rules for entry
For short: close of the price is above upper band from bb and envelope, adx is below 30 and stochastic is above 50
For long: close of the price is below lower band from bb and envelope, adx is below 30 and stochastic is below 50
Rules for exit
For short: either close of the candle is below lower band of bb or enveloper or stochastic is below 50
For long: either close o the candle is above upper band of bb or envelope or stochastic is above 50
If there are any questions let me know !

5min MACD scalp by JoelThis strategy is inspired by a youtuber called Joel on Crypto. He trades this using Ema, MACD indicators and his own experience. For more information, check out his Best Crypto Scalping Strategy for the 5 Min Time Frame video. I have tried to automate this a little.
Long or Short trades are determined with a crossing of the fast Ema over the slow Ema for Long and the opposite for Short. Trades should only happen close to the crossovers. Then for Long we use the MACD indicator with a 1min TF (I had better results using the 5min) where we look for high peaks in negative values for Long and vice versa for Shorts. These should be significantly higher than other peaks (or if you will lower peaks for a Long).
Hence, the key is to detect high peaks on the histogram, which I try to achieve by checking if the last 2 values were higher than X bars back. If you want to make it even more specific, then you can turn on the additional checkbox which compares the current value to the average value of X bars back, and if it is greater than, say, 50% the value of the average (= 1.5x the average), then it's ok for the trade.
I also noticed that the strategy often bought at the top or bottom, so I added a check that compares whether the last evaluated bar is the first rising bar (for Long) or falling bar (for Short). This can be turned on or off.
Target profit 0,5% and stop loss 0,4% are based on his recommendation. The strategy is set to take only 1 trade at a time , and you can have a back tester table on.
I'm still a pine script beginner, so the strategy is certainly not perfect and could be improved. If you have any tips on how to improve it further, please let me know. I will try to update it when I have time.
I would also like to thank Joel on Crypto for sharing the strategy and @ZenAndTheArtOfTrading for his great library and code (thanks to him we have a back tester table in here), but especially his educational videos on youtube, which taught me a lot about pine script.
Forex Scalping 1min Bollinger Bands, RSI and ADX Trading SystemThis is a Forex Scalping Trading Sytem based on the Bollinger Bands.
Its suited for major pairs, with lowest possible comission (below 1 pip) and with timeframes ranging between 1-15 min.
Indicators:
Bollinger bands
ADX
RSI
Rules for entry:
Long Entry: price to move below the upper Bollinger Bands RSI raise above the 30 line and ADX<32 at the same time.
Short Entry: price to move above the upper Bollinger Bands, RSI raise below the 70 line and ADX<32 at the same time.
Rules for exit
Profit Exit: 3 options: 1, exit position when the price touches the middle band, 2) when the price touches the opposite band, X pips target profit.
Loss Exit: X pips loss

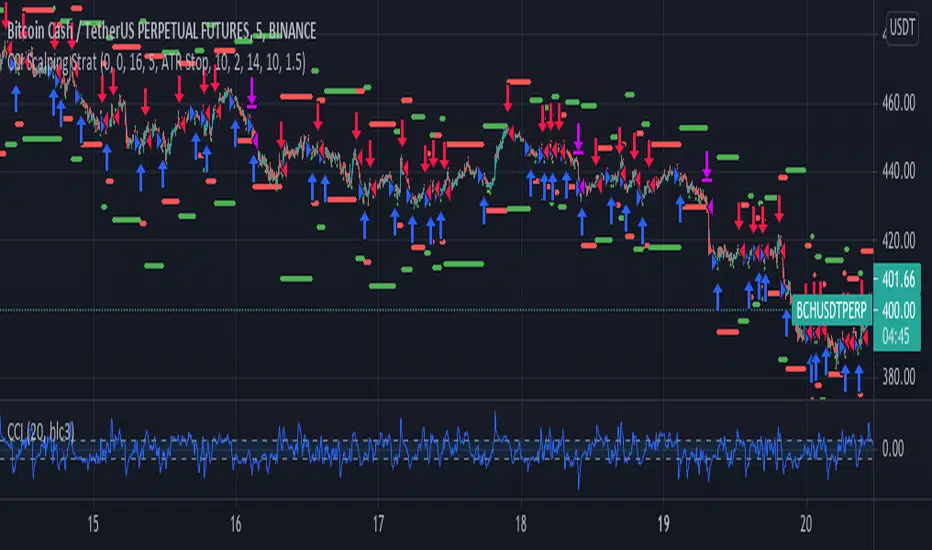
CCI Scalping Strategy---From the "Bitcoin Trading Strategies" book, by David Hanson---
After testing, works better with an ATR stop instead of the Strategy Stop. This parameter
can be changed from the strategy Inputs panel.
"CCI Scalping Strategy
Recommended Timeframe: 5 minutes
Indicators: 20 Period CCI, 20 WMA
Long when: Price closes above 20 WMA and CCI is below -100, enter when CCI crosses above -100.
Stop: Above 20 WMA"
DRSI DMA Scalping Strategy No RepaintThis strategy compares the slope of a Moving Average (of your choosing) to the slope of a Momentum Indicator (of your choosing). Zero is the center line because 0 slope means sideways movement. When both lines cross your buy threshold, it buys. When both lines cross your Sell threshold, it sells. The lines may look choppy, but that is probably because it is referencing a different timeframe than what the chart is set to. I left as many settings adjustable by the user as possible so you can tune this strategy to the relative behavior of whatever you are trading.
This also includes a No Repaint function so the backtest should be as close to live trading as possible.

BTC Rapid fire strategy 1M ScalpingRapid Fire strategy is known for scalping strategy for 1 min EURUSD
I change 15 pip stop loss for eurusd and 1.5% for BTC
for Take profit 10 pip foreurusd and 1% for BTC

Full strategy AllinOne with risk management MACD RSI PSAR ATR MAHey, I am glad to present you one of the strategies where I put a lot of time in it.
This strategy can be adapted to all type of timecharts like scalping, daytrading or swing.
The context is the next one :
First we have the ATR to calculate our TP/SL points. At the same time we have another rule once we enter(we enter based on % risk from total equity, in this example 1%, at the same time, lowest ammount for this example is 0.1 lots, but can be modified to 0.01), so we can exit both by tp/sl points, or by losing 1% of our equity or winning 1% of our total equity. It's dinamic.
The strategy is made from
Trend direction :
PSAR
First confirmation point :
Crossover between 10EMA and Bollinger bands middle point
Second confirmation
MACD histogram
Third confirmation
RSI overbought/oversold levels
For entries : we check trend with psar, then once ema cross bb middle point, we confirm together with rsi level for overbought/oversold and macd histogram ( > 0 or <0).
We exit, when we have opposite sign, like from buy to sell or sell to buy, or when we reach tp/sl points, or when we reach % basaed equity points.
It can be changed to be fixed lots, or fixed tp/sl , you just have to uncomment the size from entries, and tp/sl lines.
At the same time, it has the possibility if one desires, to trade only concrete forex session like european, asian and so on for intraday trading.
Hope you enjoy it.
Let me know how it goes.

Candle checker for long/short for scalping/day tradingHey.
This strategy is still in working.
For it I check a x amount of candles in the past if they been for example all red/green in row, and based on that I enter. For example candle 7 < candle 6 .... candle 3 < candle 2 .... candle 1 < candle current for long and viceversa for short.
After that,once the trade is initiated, I exit based on 2 possibilities : candle color is different than the color of candle when entry, or based tp/sl.
Let me know what you think of it.
I will try to make the process to calculate automatically and input the number of candles to check like 5-10-15 and so on.

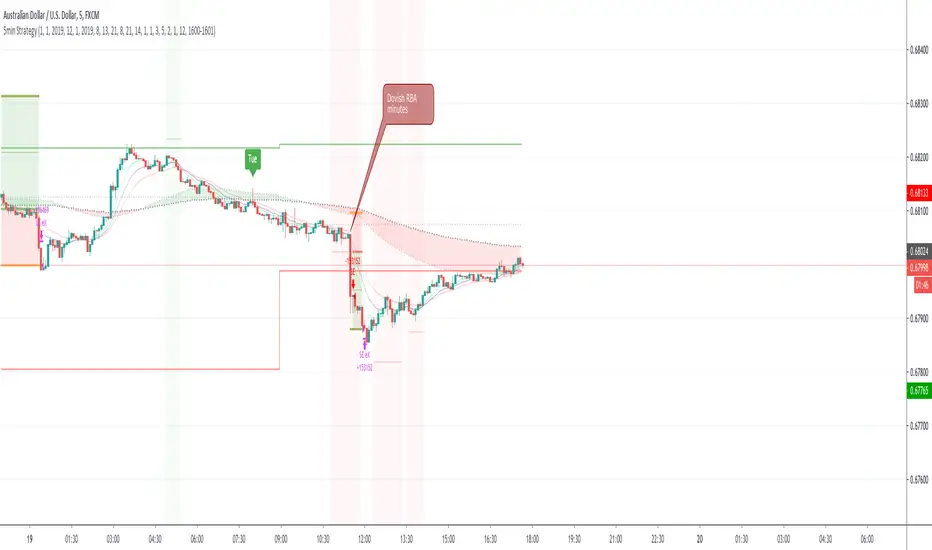
First time coding - a 5min forex Scalping strategy This is my first attempt at producing a strategy in Pine Script.
I am NOT a professional coder. I'm not even a good coder at that. I've only started Pine Script coding since September 2019. I am teaching myself.
This script is far from finished. I need to tweak a number of things about this script. Namely:
Add a validity window to the 'trigger bar' condition. Ie, I want to shut down the condition when the price closes above EMA21
Change the order entry so they are stop orders, using the stop entry price derived from the signals
Make changes to lot sizing
Add a trailing stop condition
Comments welcome, but do not expect me to reply to any questions or requests. In fact, don't expect any replies from me. I consider myself notoriously bad at replies.
I do welcome any feedback from any seasoned coders out there, as I am still a novice coder, and have so much to learn!
As to anyone who wants to criticise me - constructive and helpful criticism are most welcome, criticism to make yourself feel superior to me - you kind can eat a dk.
For the strategy rules, google the user ForexSignals TV account and look for the video "SIMPLE and PROFITABLE Forex Scalping Strategy".
Share, learn, prosper
Peace to y'all
Serialhenry
6/11/19
RSI scalpingLook for trending market on higher timeframe with ADX and SMA
Scalping with rsi shorter time frame
US100 Liquidity Precision StrategyScalping strategy 5-10 point sl / 17 points tp
Automatic BE
Consistent money over time

Scalping Dips On Trend (by Coinrule)Coinrule's Community is an excellent source of inspiration for our trading strategies.
In these months of Bull Market, our traders opted mostly on buy-the-dips strategies, which resulted in great returns recently. But there has been an element that turned out to be the cause for deep division among the Community.
Is it advisable or not to use a stop-loss during a Bull Market?
This strategy comes with a large stop-loss to offer a safer alternative for those that are not used to trade with a downside protection.
Entry
The strategy buys only when the price is above the Moving Average 50 , making it less risky to buy the dip, which is set to 2%.
The preferred time frame is 1-hour.
The stop-loss is set to be quite loose to increase the chances of closing the trade in profit, yet protecting from unexpected larger drawdowns that could undermine the allocation's liquidity.
Exit
Stop loss: 10%
Take Profit: 3%
In times of Bull Market, such a trading system has a very high percentage of trades closed in profit (ranging between 70% to 80%), which makes it still overall profitable to have a stop-loss three times larger than the take profit.
Pro tip: use a larger stop-loss only when you expect to close in profit most of the trades!
The strategy assumes each order to trade 30% of the available capital and opens a trade at a time. A trading fee of 0.1% is taken into account.

[ETH] Optimized Trend Strategy - Lorenzo SuperScalpStrategy Title: Optimized Trend Strategy - Lorenzo SuperScalp
Description:
The Optimized Trend Strategy is a comprehensive trading system tailored for Ethereum (ETH) and optimized for the 15-minute timeframe but adaptable to various timeframes. This strategy utilizes a combination of technical indicators—RSI, Bollinger Bands, and MACD—to identify and act on price trends efficiently, providing traders with actionable buy and sell signals based on market conditions.
Key Features:
Multi-Indicator Approach:
RSI (Relative Strength Index): Identifies overbought and oversold conditions to time market entries and exits.
Bollinger Bands: Acts as a dynamic support and resistance level, helping to pinpoint precise entry and exit zones.
MACD (Moving Average Convergence Divergence): Detects momentum changes through bullish and bearish crossovers.
Signal Conditions:
Buy Signal:
RSI is below 45 (indicating an oversold condition).
Price is near or below the lower Bollinger Band.
MACD bullish crossover occurs.
Sell Signal:
RSI is above 55 (indicating an overbought condition).
Price is near or above the upper Bollinger Band.
MACD bearish crossunder occurs.
Trade Execution Logic:
Long Trades: Opened when a buy signal flashes. If there’s an open short position, it is closed before opening a long.
Short Trades: Opened when a sell signal flashes. If there’s an open long position, it is closed before opening a short.
The strategy also ensures a minimum number of bars between consecutive trades to avoid rapid trading in choppy conditions.
Pyramiding Support:
Up to 3 consecutive trades in the same direction are allowed, enabling traders to scale into positions based on strong signals.
Visual Indicators:
RSI Levels: Dotted lines at 45 and 55 for quick reference to oversold and overbought levels.
Buy and Sell Signals: Visual markers on the chart indicate where trades are executed, ensuring clarity on entry and exit points.
Best Used For:
Swing Trading & Scalping: While optimized for the 15-minute timeframe, this strategy works across various timeframes, making it suitable for both short-term scalping and swing trading.
Crypto Trading: Tailored for Ethereum but effective for other cryptocurrencies due to its dynamic indicator setup.
