Pesquisar nos scripts por "scalp"
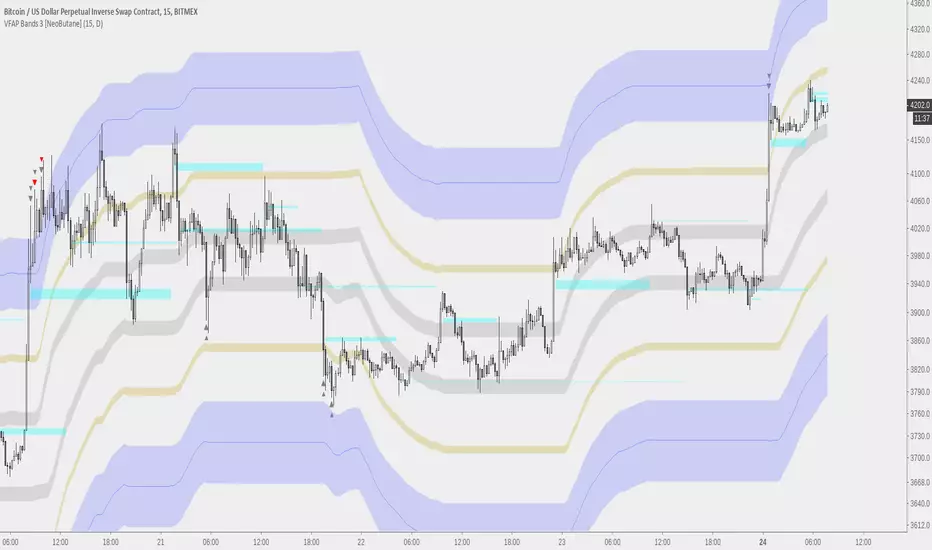
MVWAP Scalper Prototype [NeoButane]This is a tool that is best utilized on timeframes under 30 minutes.
Besides the MVWAP, the horizontal levels provide support/resistance and shows a 'magnet' to where price might go again.
SMA_CrossThis strategy is a variation of standard sma cross that comes as default with pine script
The idea is to NOT wait for a cross between fast and slow moving averages but to anticipate it considering the distance between the two MAs
Strategy can be used also for scalping, just need to be optimized for low tiime frames as 1 minute or 5 minute.
TIP: stay far from resistance and supports. I use my script "LCS/HCR Support and Resistance multi timeframes" to easily identify major supports
and resistance areas (note that I said areas and not lines).
Thanks to ChrisMoody: I used his code snippet for switching between various moving average types and calculation of TEMA and HULL ma.
Next improvements:
- money managment
- self optimization
- convert to study with alerts
This strategy is free to use but code is private. If you like or have question please use comment section.
Check also my other scripts at www.tradingview.com .
Thanks for your feedbaks.
CryptoCaptain 15M ScalperAfter huge success in CryptoCaptain AI 4H Swing trade indicator ,
My group requested me to make a scalping indicator.
Here is the masterpiece.
No repaints guaranteed.
PS: Its not free.
Always trade with StopLoss.
CryptoCaptain 0_0
Works best on bitfinex 15m chart.
Leave a comment if you want to try. Temporary trial is legit.
Checkout my 4H swing indicator :

BitSinais - Simple version of our indicatorSimple indicator with arrows pointing long or short entries.
Works on low time frames for scalping as well as on bigger time frames for position.
It's part of our trading bot. (in development)
Private use. To get access, send me a private message and we can talk about.
//
Versão simples do nosso inicador, com setas indicando entradas long ou short.
Funciona em tempos mais curtos para scalp e em tempos mais longos para position.
É parte do nosso bot, que ainda está em desenvolvimento.
Uso privado. Para ter acesso, me envie uma mensagem no chat privado.

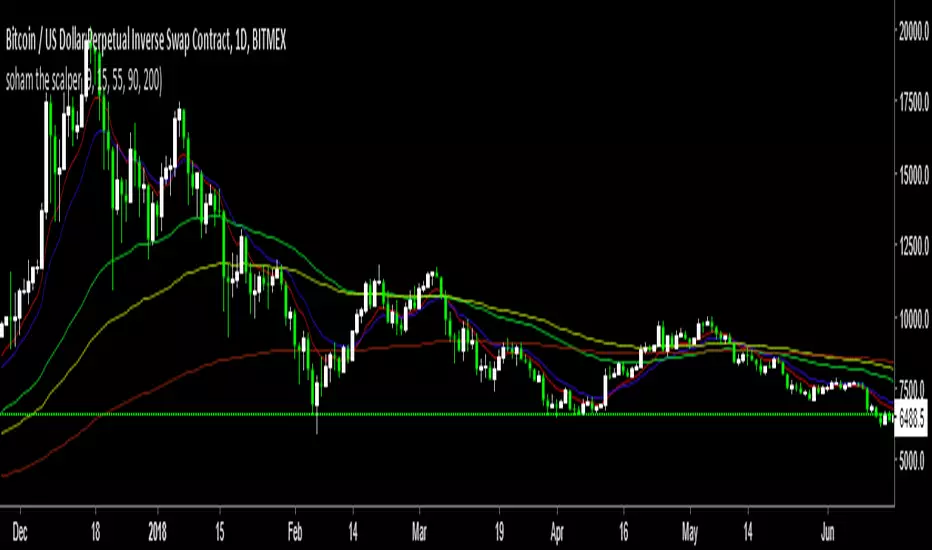
soham the scalperMultiple Ema you can use this is for scalp in any timeframe you want.
and also you can this ema with "laguerre based-rsi" so you can find clear buy and sell signals.
if you want beauty on chart then go with Guppy ema xD
if you guys need access just Dm me its free..
Shinkansen EMA ScalperRed = Last 8 Candle Support
Green = Last 8 Candle Resistant
Blue line is EMA
I'm glad if you happy to using this indicator and take more profit from scalp :D

Shinkansen SAR ScalperRed = Last 8 Candle Support
Green = Last 8 Candle Resistant
Blue line is Parabolic SAR
I'm glad if you happy to using this indicator and take more profit from scalp :D

JustHung EMA Scalper update
This is a recent update of the 20-cycle EMA scenario combined with the highest and lowest prices for a good support and resistance.
In this chart I push the EMA price at high and low to get points to buy and sell earlier, combined with the color of the body of the change when the RSI is over 70 or below 30 to maximize profit.
Should use reasonable stop loss.
Good luck!


Godmode 3.1.4 - SNOW_CITY SCALPER EDITION - 7/2017 Updates to xSilas Godmode Oscillator published December 19th, 2014
Thanks to LEGION, LAZYBEAR, Ni6HTH4wK, xSilas
Updates:
Changed default sources to include BITSTAMP and REMOVED BTC-e
Changed default lengths for SCALPING SUPREMACY - See Instructions
Changed "Caution dots" to RED because YELLOW was hard to see.
I mostly Ignore the oscillators and only use the caution dots with this configuration:
MOST EFFECTIVE USE: BITSTAMP:BTCUSD BITSTAMP:BTCUSD
- Use on 1m charts of your BITMEX swap, yes 1m. I know, but it works better this way. 5m and 15m work best when using on an exchange index.
- IF overall 2H trend is DOWN, the 1m godmode on swap CAUTION DOTS appear on the UPPER BOUNDS means good SHORT entry points, and the lower dots suggest a possible reversal and good exit opportunity (not always)
- If overall 2H trend is UP, the 1m godmode on swap CAUTION DOTS appear on the LOWER BOUNDS means good LONG entry points, and upper dots suggest possible oversold if they start to round over, again not always.
This is ultra simple, and very effective.
Default settings for VERY sensitive CAUTION DOT blop: 17,6,4
Use these settings for a slightly less sensitive CAUTION DOT blop: 14,12,9

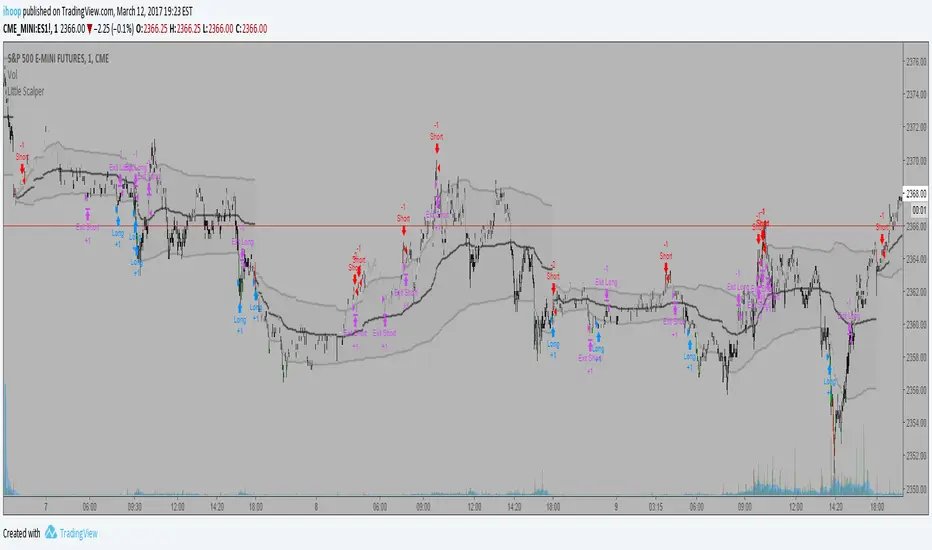
Little ScalperYet another script to scalp the ES......This script contains completely different algorithm than my "Bottom Feeder" scripts and seeks to take advantage of the great intraday tool known as VWAP as well as several other tools as filters. This strategy has the ability to go long or short, being almost equally profitable on trades from either side. While this script does has defined entries, exits, and profit targets, it does not have a defined stop loss. As with all my other scripts, this script DOES NOT repaint and can be used for live trading, albeit with caution since the exit criteria is relatively loose.
ATR ZigZag BreakoutATR ZigZag Breakout
This strategy uses my ATR ZigZag indicator (powered by the ZigZagCore library) to scalp breakouts at volatility-filtered highs and lows.
Everyone knows stops cluster around clear swing highs and lows. Breakout traders often pile in there, too. These levels are predictable areas where aggressive orders hit the tape. The idea here is simple:
→ Let ATR ZigZag define clean, volatility-filtered pivots
→ Arm a stop market order at those pivots
→ Join the breakout when the crowd hits the level
The key to greater success in this simple strategy lies in the ZigZag. Because the pivots are filtered by ATR instead of fixed bar counts or fractals, the levels tend to be more meaningful and less noisy.
This approach is especially suited for intraday trading on volatile instruments (e.g., NQ, GC, liquid crypto pairs).
How It Works
1. Pivot detection
The ATR ZigZag uses an ATR-based threshold to confirm swing highs and lows. Only when price has moved far enough in the opposite direction does a pivot become “official.”
2. Candidate breakout level
When a new swing direction is detected and the most recent high/low has not yet been broken in the current leg, the strategy arms a stop market order at that pivot.
• Long candidate → most recent swing high
• Short candidate → most recent swing low
These “candidate trades” are shown as dotted lines.
3. Entry, SL, and TP
If price breaks through the level, the stop order is filled and a bracket is placed:
• Stop loss = ATR × SL multiplier
• Take profit = SL distance × RR multiplier
Once a level has traded, it is not reused in the same swing leg.
4. Cancel & rotate
If the market reverses and forms a new swing in the opposite direction before the level is hit, the pending order is cancelled and a new candidate is considered in the new direction.
Additional Features
• Optional session filter for backtesting specific trading hours

Flow Rider Mother Candle Breakout Long Short indicator - ScalpOVERVIEW
// ═══════════════════════════════════════════════════════════
// 1. Detects HIGH VOLUME "Mother/Big" candles
// 2. Waits for 2+ INSIDE bars (consolidation)
// 3. Enters SHORT on bearish breakout below mother low Enters Long on bullish breakout above
// 4. Stop Loss: Highest point + 1.5x largest upper wick (default)
// 5. Targets: TP1 @ 0.618, TP2 @ 1.618 Fibonacci extensions

Trend BG v2Trend BG v2 colors the chart background based on Directional Movement (DM) and DI strength. It provides an easy visual way to identify trending and non-trending conditions on any timeframe.
How It Works
The script calculates:
Upward Directional Movement (DM+)
Downward Directional Movement (DM–)
True Range smoothed with RMA (14-period)
Positive DI and Negative DI values from classic ADX logic
The trend state is determined by comparing +DI vs –DI:
+DI > –DI → Uptrend
–DI > +DI → Downtrend
Otherwise → Neutral / Sideways
The script then applies a background color based on the detected trend.
Color transparency and theme can be adjusted using the input options.
Why This Script Is Useful
Instead of plotting DI lines or ADX curves, this version presents the trend directly on the background, making it ideal for:
Quick trend recognition
Visual filtering of choppy vs trending markets
Enhancing manual or automated setups
Intraday scalping, positional trend following, and multi-timeframe analysis
The background display is subtle, customizable, and does not interfere with other indicators on the chart.
Key Features
Trend-colored chart background (Up / Down / Neutral)
Adjustable color palette and transparency
Built using classic Directional Movement logic
Works on all markets and all timeframes
Lightweight and efficient (no repainting)
How to Use It
Apply the indicator on your chart and use the background colors to:
Align trades with the market trend
Avoid trading during neutral or low-momentum periods
Confirm trend direction before entries
Improve clarity when using your existing indicators
This indicator does not generate buy/sell signals by itself; instead, it helps visualize the underlying trend environment so traders can make more informed decisions.

Doctor Scalp (BUY/SELL) [by Adi]A script for fast scalping using. Works best with a 5-minute-to-1-hour interval.

XAUUSD Scalping 1min TFThis script is for use on the 1min timeframe, we are looking for quick scalp trades when price reverses from Highs or lows - when the shot fires taking a 1:2 Trade 500pips TP and 250pips SL

30M Scalping Strategy with Debug LogsWhat’s changed
Spot‑only: all short logic removed—only long entries and exits are generated.
Logging: uses log.info() to send entry/exit details (timestamp, price, ATR, RSI) to the Pine Logs console.
Clean & concise: core scalp logic (EMAs, RSI, MACD, volume, ATR SL/TP) remains intact.

AL Brooks - Price Action Multi-Signal Suite📘 Price Action Multi-Signal Suite📘
This indicator is a complete visual toolset for traders who use price action principles inspired by Al Brooks-style analysis.
It combines multiple nuanced signals — like first/second entries, breakout failures, trend bias, higher-timeframe context, and dynamic trend channels — into one elegant, customizable interface.
It is built with clarity, flexibility, and actionable precision in mind.
🧠 Core Concepts Behind the Tool
1. Trend Bias with EMA (20 by default)
The indicator calculates a standard EMA (default: 20) to establish trend direction bias.
When price is above EMA, we consider the market to be in a bull trend, and vice versa.
The EMA line changes color dynamically — green (bull), red (bear), gray (neutral).
🟢 Example:
If price is forming higher highs and staying above EMA with strong bull bars, the bias is bullish. In this phase, you're looking for High 1 and High 2 (H1/H2) setups.
2. First and Second Entries (H1/H2 and L1/L2)
High 1 (H1): First pullback in a bull trend after a minor new high.
High 2 (H2): A second attempt to push up after a failed H1.
Low 1 (L1) and Low 2 (L2): Mirror the above logic for bear trends.
📈 Example Trade – H2 Long:
Price breaks out above EMA.
Pulls back and forms an H1, but it fails to break out.
Second push (H2) forms a higher low, then closes strong above previous bar → BUY entry.
📉 Example Trade – L2 Short:
Market is below EMA.
A rally creates L1, fails.
L2 forms and closes below the previous bar low with a bear body → SELL entry.
3. Second Entry Logic (Simplified Swing Count)
This adds context to H2/L2 by ensuring at least two swings occurred in the same direction.
Reduces false signals in choppy markets.
Painted as colored circles (aqua = long, fuchsia = short).
4. Breakout Failure Detection
Detects false breakouts using 10-bar highs/lows:
Failed High Breakout: Price breaks a 10-bar high but closes back inside → potential reversal short.
Failed Low Breakout: Price breaks a 10-bar low but closes back inside → potential long.
🚨 Example:
Price breaks above a recent high but closes below it with a strong bear bar → look for reversal or fade setups.
5. Inside / Outside Bars
Helps recognize compression (inside bars) or volatility expansions (outside bars).
Inside bars often precede breakouts.
Outside bars may signal traps or indecision.
Use these in combination with entry logic. An H2 after an inside bar can signal a strong, clean breakout.
6. Higher Timeframe (HTF) Context
Pulls EMA and trend bias from a higher timeframe (default: 1hr).
Background color indicates HTF bias (adjustable opacity).
Green = HTF uptrend.
Red = HTF downtrend.
🧭 Usage: Trade in the direction of the HTF bias when possible. An H2 with HTF bias bullish adds confluence.
7. Trend Channels (Automatic, Visual)
Dynamically draws trend channel lines based on pivot highs/lows.
These act as support/resistance, visual guides for traps or continuation.
Trendline breakouts or touches often align with H2/L2 setups.
📏 Example:
Price touches lower channel and forms a second entry long (L2) with a strong bull bar → high-quality reversal trade.
⚙️ Customization Options
Toggle each signal component (entries, bias, bars, failures, channels).
Adjust EMA length, HTF resolution, background opacity.
Keep your chart clean and focused on the signals that matter to you.
📊 Trade Example Summary
H2 with HTF Bullish
Trade Setup: Strong bull bar after a failed H1, above EMA
Expected Move: Trend continuation upward
L2 with Channel Hit
Trade Setup: Pullback hits lower trend channel, forms L2
Expected Move: Reversal or scalp down
Failed High Breakout
Trade Setup: Price breaks above a 10-bar high, but reverses and closes inside
Expected Move: Quick fade or reversal short
Inside Bar + H2
Trade Setup: Price compresses into an inside bar, followed by a breakout with H2
Expected Move: Momentum breakout trade
Outside Bar + L2
Trade Setup: Price breaks strongly in one direction (outside bar), second push fails upward, forms L2
Expected Move: Short on weakness
Please note, this is an educational idea and representation of whatever I understood of it.
Historical performances may not be replicable in present/future.
Trade at your own responsibility.
Regards! ^^

Luxmi AI Filtered Option Scalping Signals (INDEX)Introduction:
Luxmi AI Filtered Option Scalping Signals (INDEX) is an enhanced iteration of the Luxmi AI Directional Option Buying (Long Only) indicator. It's designed for use on index charts alongside the Luxmi AI Smart Sentimeter (INDEX) indicator to enhance performance. This indicator aims to provide refined signals for option scalping strategies, optimizing trading decisions within index markets.
Understanding directional bias is crucial when trading index and index options because it helps traders align their strategies with the expected movement of the underlying index.
The Luxmi AI Filtered Option Scalping Signals (INDEX) indicator aims to simplify and expedite decision-making through comprehensive technical analysis of various data points on a chart. By leveraging advanced analysis of data points, this indicator scrutinizes multiple factors simultaneously to offer traders clear and rapid insights into market dynamics.
The indicator is specifically designed for option scalping, a trading strategy that aims to profit from short-term price fluctuations. It prioritizes signals that are conducive to quick execution and capitalizes on rapid market movements typical of scalping strategies.
Major Features:
Trend Cloud:
Working Principle:
The script utilizes the Relative Strength Index (RSI) to assess market momentum, identifying bullish and bearish phases based on RSI readings. It calculates two boolean variables, bullmove and bearmove, which signal shifts in momentum direction by considering changes in the Exponential Moving Average (EMA) of the closing price. When RSI indicates bullish momentum and the closing price's EMA exhibits positive changes, bullmove is triggered, signifying the start of a bullish phase. Conversely, when RSI suggests bearish momentum and the closing price's EMA shows negative changes, bearmove is activated, marking the beginning of a bearish phase. This systematic approach helps in understanding the current trend of the price. The script visually emphasizes these phases on the chart using plot shape markers, providing traders with clear indications of trend shifts.
Benefits of Using Trend Cloud:
Comprehensive Momentum Assessment: The script offers a holistic view of market momentum by incorporating RSI readings and changes in the closing price's EMA, enabling traders to identify both bullish and bearish phases effectively.
Structured Trend Recognition: With the calculation of boolean variables, the script provides a structured approach to recognizing shifts in momentum direction, enhancing traders' ability to interpret market dynamics.
Visual Clarity: Plotshape markers visually highlight the start and end of bullish and bearish phases on the chart, facilitating easy identification of trend shifts and helping traders to stay informed.
Prompt Response: Traders can promptly react to changing market conditions as the script triggers alerts when bullish or bearish phases begin, allowing them to seize potential trading opportunities swiftly.
Informed Decision-Making: By integrating various indicators and visual cues, the script enables traders to make well-informed decisions and adapt their strategies according to prevailing market sentiment, ultimately enhancing their trading performance.
How to use this feature:
The most effective way to maximize the benefits of this feature is to use it in conjunction with other key indicators and visual cues. By combining the color-coded clouds, which indicate bullish and bearish sentiment, with other features such as IS candles, microtrend candles, volume candles, and sentimeter candles, traders can gain a comprehensive understanding of market dynamics. For instance, aligning the color of the clouds with the trend direction indicated by IS candles, microtrend candles, and sentimeter candles can provide confirmation of trend strength or potential reversals.
Furthermore, traders can leverage the trend cloud as a trailing stop-loss tool for long entries, enhancing risk management strategies. By adjusting the stop-loss level based on the color of the cloud, traders can trail their positions to capture potential profits while minimizing losses. For long entries, maintaining the position as long as the cloud remains green can help traders stay aligned with the prevailing bullish sentiment. Conversely, a shift in color from green to red serves as a signal to exit the position, indicating a potential reversal in market sentiment and minimizing potential losses. This integration of the trend cloud as a trailing stop-loss mechanism adds an additional layer of risk management to trading strategies, increasing the likelihood of successful trades while reducing exposure to adverse market movements.
Moreover, the red cloud serves as an indicator of decay in option premiums and potential theta effect, particularly relevant for options traders. When the cloud turns red, it suggests a decline in option prices and an increase in theta decay, highlighting the importance of managing options positions accordingly. Traders may consider adjusting their options strategies, such as rolling positions or closing out contracts, to mitigate the impact of theta decay and preserve capital. By incorporating this insight into options pricing dynamics, traders can make more informed decisions about their options trades.
Scalping Cloud:
The scalping cloud serves as a specialized component within the trend cloud feature, specifically designed to pinpoint potential long and short entry points within the overarching trend cloud. Here's how it works:
Trend Identification: The trend cloud feature typically highlights the prevailing trend direction based on various technical indicators, price action, or other criteria. It visually represents the momentum and direction of the market over a given period.
Refined Entry Signals: Within this broader trend context, the scalping cloud narrows its focus to identify shorter-term trading opportunities. It does this by analyzing more granular price movements and shorter timeframes, seeking out potential entry points that align with the larger trend.
Long and Short Entries: The scalping cloud distinguishes between potential long (buy) and short (sell) entry opportunities within the trend cloud. For instance, within an uptrend indicated by the trend cloud, the scalping cloud might identify brief retracements or pullbacks as potential long entry points. Conversely, in a downtrend, it may signal short entry opportunities during temporary upward corrections.
Risk Management: By identifying potential entry points within the context of the trend, the scalping cloud also aids in risk management. Traders can use these signals to place stop-loss orders and manage their positions effectively, reducing the risk of adverse price movements.
The scalping cloud operates by analyzing the crossover and crossunder events between two key indicators: the Double Exponential Moving Average (DEMA) and a Weighted Average. Here's how it works:
Double Exponential Moving Average (DEMA): DEMA is a type of moving average that seeks to reduce lag by applying a double smoothing technique to price data. It responds more quickly to price changes compared to traditional moving averages, making it suitable for identifying short-term trends and potential trading opportunities.
Weighted Average: The weighted average calculates the average price of an asset over a specified period. However, it incorporates a weighting scheme that assigns more significance to recent price data, resulting in a more responsive indicator that closely tracks current market trends.
CE and NO CE Signals:
CE signals typically represent a Long Scalping Opportunity, suggesting that conditions are favorable for entering a long position. These signals indicate a strong upward momentum in the market, which traders can exploit for short-term gains through scalping strategies.
On the other hand, when there are no CE signals present, it doesn't necessarily mean that the trend has reversed or turned bearish. Instead, it indicates that the trend is still bullish, but the market is experiencing an active pullback. During a pullback, prices may temporarily retreat from recent highs as traders take profits or reevaluate their positions. While the overall trend remains upward, the pullback introduces a degree of uncertainty, making it less favorable for entering new long positions.
In such a scenario, traders may opt to exercise caution and refrain from entering new long positions until the pullback phase has concluded. Instead, they might consider waiting for confirmation signals, such as the resumption of CE signals or other bullish indications, before reengaging in long positions.
PE and NO PE Signals:
PE signals typically indicate a Short Entry opportunity, signaling that market conditions are conducive to entering a short position.
Conversely, when there are no PE signals present, it signifies that while the trend remains bearish, the market is currently in an active phase of consolidation or pullback. During such periods, prices may temporarily rise from recent lows, reflecting a pause in the downward momentum. While the overall trend remains downward, the absence of PE signals suggests that it may not be an optimal time to enter new short positions.
In this context, traders may exercise caution and wait for clearer signals before initiating new short positions. They might monitor the market closely for signs of a resumption in bearish momentum, such as the emergence of PE signals or other bearish indications. Alternatively, traders may choose to wait on the sidelines until market conditions stabilize or provide clearer directional signals.
Working Principle Of CE and PE Signals:
The feature calculates candlestick values based on the open, high, low, and close prices of each bar. By comparing these derived candlestick values, it determines whether the current candlestick is bullish or bearish. Additionally, it signals when there is a change in the color (bullish or bearish) of the derived candlesticks compared to the previous bar, enabling traders to identify potential shifts in market sentiment.
Micro Trend Candles:
Working Principle:
This feature begins by initializing variables to determine trend channel width and track price movements. Average True Range (ATR) is then calculated to measure market volatility, influencing the channel's size. Highs and lows are identified within a specified range, and trends are assessed based on price breaches, with potential changes signaled accordingly. The price channel is continually updated to adapt to market shifts, and arrows are placed to indicate potential entry points. Colors are assigned to represent bullish and bearish trends, dynamically adjusting based on current market conditions. Finally, candles on the chart are colored to visually depict the identified micro trend, offering traders an intuitive way to interpret market sentiment and potential entry opportunities.
Benefits of using Micro Trend Candles:
Traders can use these identified micro trends to spot potential short-term trading opportunities. For example:
Trend Following: Traders may decide to enter trades aligned with the prevailing micro trend. If the candles are consistently colored in a certain direction, traders may consider entering positions in that direction.
Reversals: Conversely, if the script signals a potential reversal by changing the candle colors, traders may anticipate trend reversals and adjust their trading strategies accordingly. For instance, they might close existing positions or enter new positions in anticipation of a trend reversal.
It's important to note that these micro trends are short-term in nature and may not always align with broader market trends. Therefore, traders utilizing this script should consider their trading timeframes and adjust their strategies accordingly.
How to use this feature:
This feature assigns colors to candles to represent bullish and bearish trends, with adjustments made based on current market conditions. Green candles accompanied by a green trend cloud signal a potential long entry, while red candles suggest caution, indicating a bearish trend. This visual representation allows traders to interpret market sentiment intuitively, identifying optimal entry points and exercising caution during potential downtrends.
Scalping Candles (Inspired by Elliott Wave and Open Interest Concepts):
Working Principle:
This feature draws inspiration from the Elliot Wave method, utilizing technical analysis techniques to discern potential market trends and sentiment shifts. It begins by calculating the variance between two Exponential Moving Averages (EMAs) of closing prices, mimicking Elliot Wave's focus on wave and trend analysis. The shorter-term EMA captures immediate price momentum, while the longer-term EMA reflects broader market trends. A smoother Exponential Moving Average (EMA) line, derived from the difference between these EMAs, aids in identifying short-term trend shifts or momentum reversals.
Benefits of using Scalping Candles Inspired by Elliott Wave:
The Elliott Wave principle is a form of technical analysis that attempts to predict future price movements by identifying patterns in market charts. It suggests that markets move in repetitive waves or cycles, and traders can potentially profit by recognizing these patterns.
While this script does not explicitly analyze Elliot Wave patterns, it is inspired by the principle's emphasis on trend analysis and market sentiment. By calculating and visualizing the difference between EMAs and assigning colors to candles based on this analysis, the script aims to provide traders with insights into potential market sentiment shifts, which can align with the broader philosophy of Elliott Wave analysis.
How to use this feature:
Candlestick colors are assigned based on the relationship between the EMA line and the variance. When the variance is below or equal to the EMA line, candles are colored red, suggesting a bearish sentiment. Conversely, when the variance is above the EMA line, candles are tinted green, indicating a bullish outlook. Though not explicitly analyzing Elliot Wave patterns, the script aligns with its principles of trend analysis and market sentiment interpretation. By offering visual cues on sentiment shifts, it provides traders with insights into potential trading opportunities, echoing Elliot Wave's emphasis on pattern recognition and trend analysis.
Chart Timeframe Support and Resistance:
Working Principle:
This feature serves to identify and visualize support and resistance levels on the chart, primarily based on the chosen Chart Timeframe (CTF). It allows users to specify parameters such as the number of bars considered on the left and right sides of each pivot point, as well as line width and label color. Moreover, users have the option to enable or disable the display of these levels. By utilizing functions to calculate pivot highs and lows within the specified timeframe, the script determines the highest high and lowest low surrounding each pivot point.
Additionally, it defines functions to create lines and labels for each detected support and resistance level. Notably, this feature incorporates a trading method that emphasizes the concept of resistance turning into support after breakouts, thereby providing valuable insights for traders employing such strategies. These lines are drawn on the chart, with colors indicating whether the level is above or below the current close price, aiding traders in visualizing key levels and making informed trading decisions.
Benefits of Chart Timeframe Support and Resistance:
Identification of Price Levels: Support and resistance levels help traders identify significant price levels where buying (support) and selling (resistance) pressure may intensify. These levels are often formed based on historical price movements and are regarded as areas of interest for traders.
Decision Making: Support and resistance levels assist traders in making informed trading decisions. By observing price reactions near these levels, traders can gauge market sentiment and adjust their strategies accordingly. For example, traders may choose to enter or exit positions, set stop-loss orders, or take profit targets based on price behavior around these levels.
Risk Management: Support and resistance levels aid in risk management by providing reference points for setting stop-loss orders. Traders often place stop-loss orders below support levels for long positions and above resistance levels for short positions to limit potential losses if the market moves against them.
How to use this feature:
Planning Long Positions: When considering long positions, it's advantageous to strategize when the price is in proximity to a support level identified by the script. This suggests a potential area of buying interest where traders may expect a bounce or reversal in price. Additionally, confirm the bullish bias by ensuring that the trend cloud is green, indicating favorable market conditions for long trades.
Waiting for Breakout: If long signals are generated near resistance levels detected by the script, exercise patience and wait for a breakout above the resistance. A breakout above resistance signifies potential strength in the upward momentum and may present a more opportune moment to enter long positions. This approach aligns with trading methodologies that emphasize confirmation of bullish momentum before initiating trades.
StopLoss and Target Lines:
In addition to generating entry signals, this indicator also incorporates predefined stop-loss ray lines and configurable risk-reward (R:R) target lines to enhance risk management and profit-taking strategies. Here's how these features work:
Predefined Stop-loss Ray Lines: The indicator automatically plots stop-loss ray lines on the chart, serving as visual guidelines for setting stop-loss levels. These stop-loss lines are predetermined based on specific criteria, such as volatility levels, support and resistance zones, or predefined risk parameters. Traders can use these lines as reference points to place their stop-loss orders, aiming to limit potential losses if the market moves against their position.
Configurable Risk-Reward (R:R) Target Lines: In addition to stop-loss lines, the indicator allows traders to set configurable risk-reward (R:R) target lines on the chart. These target lines represent predefined price levels where traders intend to take profits based on their desired risk-reward ratio. By adjusting the placement of these lines, traders can customize their risk-reward ratios according to their trading preferences and risk tolerance.
Risk Management: The predefined stop-loss ray lines help traders manage risk by providing clear exit points if the trade goes against their expectations. By adhering to these predetermined stop-loss levels, traders can minimize potential losses and protect their trading capital, thereby enhancing overall risk management.
Profit-taking Strategy: On the other hand, the configurable R:R target lines assist traders in establishing profit-taking strategies. By setting target levels based on their desired risk-reward ratio, traders can aim to capture profits at predefined price levels that offer favorable risk-reward profiles. This allows traders to systematically take profits while ensuring that potential gains outweigh potential losses over the long term.
The stop-loss and target lines incorporated in this indicator are dynamic in nature, providing traders with the flexibility to utilize them as trailing stop-loss and extended take-profit targets. Here's how these dynamic features work:
Trailing Stop-loss: Traders can employ the stop-loss lines as trailing stop-loss levels, allowing them to adjust their stop-loss orders as the market moves in their favor. As the price continues to move in the desired direction, indicator can dynamically adjust the stop-loss line to lock in profits while still allowing room for potential further gains. This trailing stop-loss mechanism helps traders secure profits while allowing their winning trades to continue running as long as the market remains favorable.
Extended Take Profit Targets: Similarly, traders can utilize the target lines as extended take-profit targets, enabling them to capture additional profits beyond their initial profit targets. By adjusting the placement of these target lines based on evolving market conditions or technical signals, traders can extend their profit-taking strategy to capitalize on potential price extensions or trend continuations. This flexibility allows traders to maximize their profit potential by capturing larger price movements while managing their risk effectively.
Rangebound Bars:
When the Rangebound Bars feature is enabled, the indicator represents candles in a distinct purple color to visually denote periods of sideways or range-bound price action. This visual cue helps traders easily identify when the market is consolidating and lacking clear directional momentum. Here's how it works:
Purple Candle Color: When the Rangebound Bars feature is active, the indicator displays candlesticks in a purple color to highlight periods of sideways price movement. This color differentiation stands out against the usual colors used for bullish (e.g., green or white) and bearish (e.g., red or black) candles, making it easier for traders to recognize range-bound conditions at a glance.
Signaling Sideways Price Action: The purple coloration of candles indicates that price movements are confined within a relatively narrow range and lack a clear upward or downward trend. This may occur when the market is consolidating, experiencing indecision, or undergoing a period of accumulation or distribution.
Working Principle:
The Rangebound Bars feature of this indicator is designed to assist traders in identifying and navigating consolidating market conditions, where price movements are confined within a relatively narrow range. This feature utilizes Pivot levels and the Average True Range (ATR) concept to determine when the market is range-bound and provides signals to stay out of such price action. Here's how it works:
Pivot Levels: Pivot levels are key price levels derived from the previous period's high, low, and closing prices. They serve as potential support and resistance levels and are widely used by traders to identify significant price levels where price action may stall or reverse. The Rangebound Bars feature incorporates Pivot levels into its analysis to identify ranges where price tends to consolidate.
Average True Range (ATR): The Average True Range is a measure of market volatility that calculates the average range between the high and low prices over a specified period. It provides traders with insights into the level of price volatility and helps set appropriate stop-loss and take-profit levels. In the context of the Rangebound Bars feature, ATR is used to gauge the extent of price fluctuations within the identified range.

Helicopter!Review
This indicator automatically calculates the best trade entry based on volume and real-time volatility. After the algorithm analyzes the current characteristics of the market, an entry signal is placed on the chart. As a result, the trader can be sure that the signal is based on data analysis. One of the key elements is reverse transactions. A long or short position can be stopped either at a profit or at a small loss without compromising the potential profit.
!Risks
The market is unstable, and it is impossible to know what the future holds for it. The only way to manage risk. You can limit the loss by setting a stop loss of 1% from the entry point. Take profit is recommended to set with a ratio of 1:1, 1:2,1:3, with partial fixation of 40%, 30%, 30%!
!Trading recommendations
Trades are opened when a green arrow appears, selling when a yellow arrow appears. Be sure to wait for the candle to close and the signal to appear (the signal may flash when the candle is formed). Recommended timeframes: 1min, 3min, 15min. The indicator is designed for scalp trades and intradays!
!Technical part
The indicator is based on the EMA 20 and EMA 200 moving averages. It is also based on the open and close of past days, weeks, months.
RSI are used.
RSI is a classic oscillator built on the basis of calculating the relative rate of change in asset prices over a given period.
Additional tools: volume and volatility.
NO REPAINT!
-------------------------------------------------------
Denial of responsibility
The information contained in my Scripts/Indicators/Ideas/Algorithms/Systems does not constitute financial advice or an offer to buy or sell any securities of any kind. I do not accept liability for any loss or damage, including but not limited to any loss of profits that may arise directly or indirectly from the use of or reliance on such information.