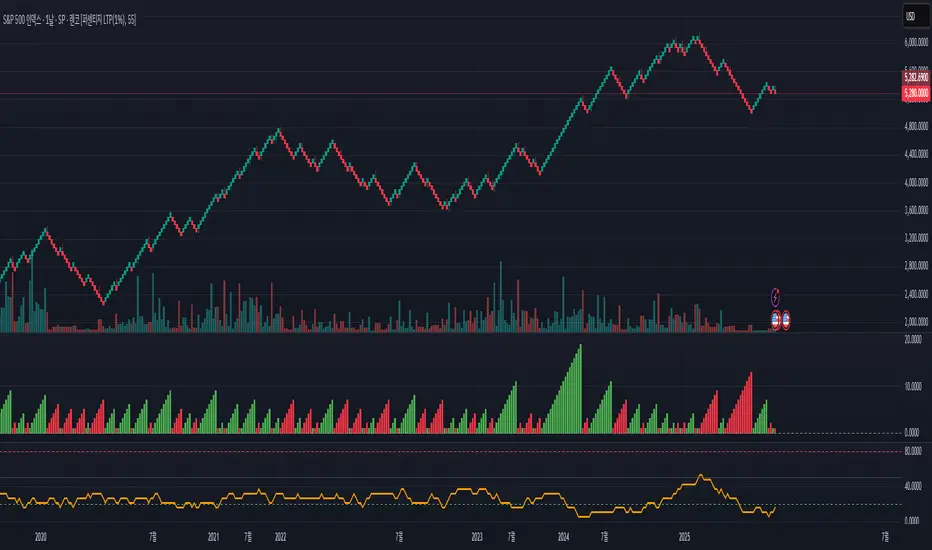
Renko with Multi-Timeframe RSI (Non-Repaint)This is a Renko-based Multi-Timeframe RSI indicator with Inverted Volatility Oscillator that combines three technical analysis concepts to provide trading signals without repainting issues.
Core Components
1. Renko Chart Foundation
Instead of using time-based candles, this indicator creates Renko bricks based on price movement:
Green brick = Price moved up by one brick size
Red brick = Price moved down by one brick size
Brick size = Either ATR-based (dynamic) or fixed value
Key advantage: Filters out market noise by ignoring time and small price fluctuations
Non-Repaint Feature: Only processes confirmed bars (barstate.isconfirmed), ensuring signals don't disappear or change after they appear.
2. Volume-Weighted RSI (Multiple Timeframes)
Three RSI calculations:
a) Renko RSI (Purple line)
Calculated directly from Renko brick close prices
Shows momentum based on actual brick formations
More stable than traditional RSI since it's based on significant price moves
b) 1-Hour RSI (Blue line)
Standard RSI from 1-hour timeframe
Provides medium-term momentum context
c) 4-Hour RSI (Orange line)
Standard RSI from 4-hour timeframe
Shows longer-term momentum trends
RSI Interpretation:
Above 70: Overbought (potential sell signal)
Below 30: Oversold (potential buy signal)
Above 50: Bullish momentum
Below 50: Bearish momentum
3. Inverted Volatility Oscillator (Yellow line)
Measures the opposite of price volatility in Renko brick closes:
What It Actually Is:
Simply calculates volatility (standard deviation of rate of change)
Normalizes it to 0-100 scale
Inverts it (100 minus volatility)
Result: When prices are volatile, the number is LOW. When prices are calm, the number is HIGH.
This is just repackaged volatility:
Above 80: Low volatility period (calm, stable prices)
50-80: Below-average volatility
20-50: Above-average volatility
Below 20: High volatility period (choppy, erratic prices)
The "Fear/Greed" Marketing: The assumption is that high volatility = panic/fear, and low volatility = complacency/greed. But this is just a narrative wrapper around basic volatility measurement. Markets can be:
Highly volatile during euphoric rallies (not fear)
Very calm during sustained downtrends (not greed)
The relationship between volatility and sentiment is assumed, not measured.
How It Works
Signal Generation
Buy Signals occur when:
Renko RSI < 30 (oversold) OR
1H RSI < 30 OR
4H RSI < 30 OR
Inverted Volatility < 20 (high volatility = "extreme fear")
Sell Signals occur when:
Renko RSI > 70 (overbought) OR
1H RSI > 70 OR
4H RSI > 70 OR
Inverted Volatility > 80 (low volatility = "extreme greed")
Exit Conditions:
Brick color changes (green→red or red→green)
Any RSI enters opposite extreme zone
Multiple confirmations increase signal reliability
What You're Actually Getting
Legitimately Useful:
Renko filtering: Real noise reduction
Multi-timeframe RSI: Valid momentum confirmation across timeframes
Non-repainting: Reliable signal timing
Marketing Fluff: The "Fear/Greed Index" is:
Just normalized, inverted volatility
Given emotional labels to sound sophisticated
Based on an assumption (volatility = fear) that's often wrong
No actual measurement of fear, greed, sentiment, or psychology
Adds no information you couldn't get from a standard volatility indicator
Reality Check
What the indicator claims: "Fear/Greed Index measures market psychology"
What it actually does: Calculates volatility of Renko closes, flips the scale, and slaps emotional labels on different levels
Better description: "Low Volatility Warning" (>80) and "High Volatility Warning" (<20)
The indicator works fine as a multi-timeframe RSI system with Renko smoothing. The volatility component can be useful for identifying regime changes. But calling it "Fear/Greed" is pure marketing - it's just repackaged volatility with psychology buzzwords.
Bottom Line
Use this for:
Renko trend following (genuinely useful)
Multi-timeframe momentum confirmation (valid approach)
Volatility regime detection (what the yellow line actually measures)
Don't use this thinking:
It reads market psychology (it doesn't)
It's measuring actual fear or greed (it isn't)
It's anything more than inverted volatility (it's not)
// ============ DISCLAIMER ============
// EDUCATIONAL PURPOSE ONLY - NOT FINANCIAL ADVICE
// This indicator is provided for educational and informational purposes only.
// It does NOT constitute financial, investment, trading, or any other type of advice.
//
// PAST PERFORMANCE IS NOT INDICATIVE OF FUTURE RESULTS
// No trading system or indicator can guarantee profits or prevent losses.
//
// RISKS:
// - Trading and investing involve substantial risk of loss
// - You can lose some or all of your invested capital
// - Only trade with money you can afford to lose
// - Indicators can produce false signals and lag price action
//
// "FEAR/GREED INDEX" DISCLAIMER:
// The so-called "Fear/Greed Index" is simply inverted normalized volatility.
// It does NOT actually measure fear, greed, sentiment, or market psychology.
// It is a mathematical calculation based on price volatility with emotional
// labels applied for marketing purposes. The relationship between volatility
// and sentiment is ASSUMED, not measured or proven.
//
// NO REPAINTING GUARANTEE:
// While designed to avoid repainting, no indicator is perfect. Always verify
// signals on confirmed bars and test thoroughly before live trading.
//
//(RESPONSIBILITY):
// By using this indicator, you acknowledge that:
// - All trading decisions are your own responsibility
// - You have tested this indicator on historical data
// - You understand the risks involved in trading
// - The creator(s) of this indicator are not liable for any losses
//
// ALWAYS:
// - Do your own research and due diligence
// - Consult with qualified financial professionals
// - Use proper risk management and position sizing
// - Never risk more than you can afford to lose
// - Practice on paper/demo accounts before live trading
// =======================================
Pesquisar nos scripts por "renko"

Renko Dynamic IndexThe goal of this indicator is to plot the Dynamic Index, Signal, and Histogram values "as if" the chart is a true price action based Renko chart. It can be used on a time series chart or Renko series chart. The Dynamic Index is derived from the raw price action of a time-based chart, where the historic and live price values are clustered into Renko bricks. The Renko brick production algorithm is entirely backed by Renko Overlay Ribbon and thoroughly tested. The Dynamic Index gets its inspiration from the Commodity Channel Index.
The algorithm takes into account rapid brick production within a single time candle and adjusts accordingly. The output may vary slightly between different chart time frames for the same indicator settings, but this is due to the lack of price fluctuation visibility that can occur in higher chart time frames. If the brick tick size is low, an appropriate chart interval should be selected that maximizes the amount of price volatility visible to the indicator. A bad setting would be something like a 1 tick EURUSD Renko setting on an H4 or Day chart, there simply is no way to derive the exact and ordered price fluctuations in a single candle, 1 pip at a time. A more appropriate chart time frame would be 1-5 minutes for this selected Renko brick size.
Please find the following video introduction helpful for this indicator and the Renko Dynamic Index Zones indicator:
If you are interested in the RSI-RENKO DIVINE™ Strategy please have a look here:
Contact me in Trading View or telegram for more information and access instructions.

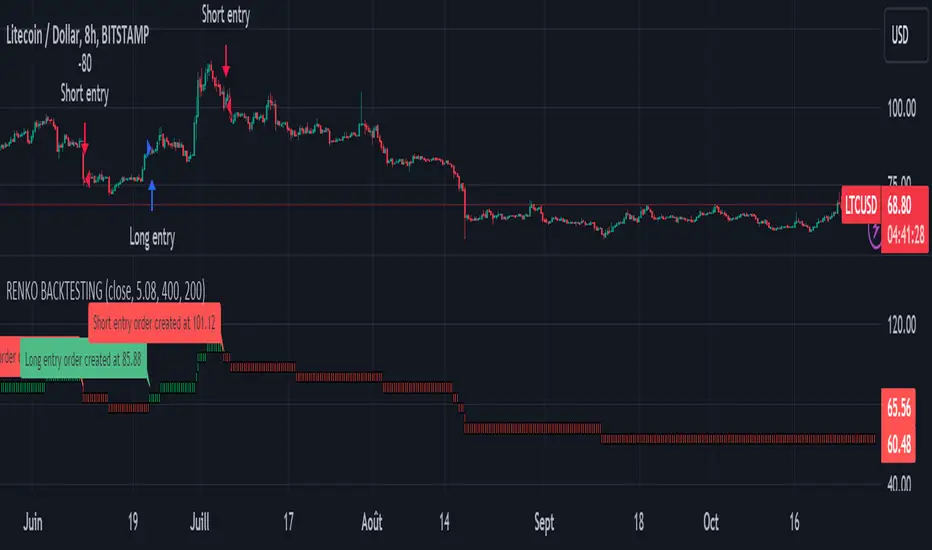
Renko StrategyRENKO STRATEGY
CAUTION : This strategy must be applied to a candlestick chart (not a Renko chart).
INTRODUCTION :
The Traditional Renko chart has been reproduced and is plotted according to the evolution of the price. It will enable us to receive buy or sell signals and follow major trends. This is a medium/long term strategy and depends a lot on the box size chosen in the parameters. There's also a money management method allowing us to reinvest part of the profits or reduce the size of orders in the event of substantial losses.
RENKO CHART :
Renko chart construction methodology :
The user must first choose the box size. The minimum is 0.00001 and there is no maximum. The default is 10. The user must then choose the source that will define the data on which the calculations will be based (high, low, open, close). By default, close is selected. The first candle on the chart is used to draw the first box with its high and low.
Each time the price changes by the amount of the box size relative to the high or low of the last box, a new box is added above or below the previous one. If price variations are less than the box size, the same box is added next to the previous one. If price variations are N (integer number) times greater than box size, N boxes are added above or below the previous one. Each box added above the previous one is a green box, while each box added below the previous one is a red box.
Conditions for drawing a green box above the previous one :
(source - high_of_the_last_box) / box_size > 1
Condition for drawing a red box below the previous one :
(low_of_the_last_box - source) / box_size > 1
If neither condition is triggered, the same box is drawn next to the previous one.
Example :
The last candle has drawn a box with low 12 and high 14. The box size is therefore 2. The strategy will look at the value of the close each time a candle ends. The current candle closes with a close equal to 15.5. As the variation from the previous high is only 1.5 (which is less than the box size), the same box is added next to the previous one. The next candle closes at 16.2. The price variation is therefore 2.2 compared with the previous high. We can now add a new green box just above the previous one, with a low of 14 and a high of 16. The same process applies if the candle's close is at least one box size below the low of the last box. In this case, a new red box is placed below the previous one.
PARAMETERS :
Source : Allows you to specify which data will be taken into account by the strategy when performing calculations. The default is close.
Box size : Size of Renko graph boxes. This is a very important parameter to choose carefully, as it has a strong impact on the strategy's performance. Defaults to 10.
Fixed Ratio : This is the amount of gain or loss at which the order quantity is changed. The default is 400, meaning that for each $400 gain or loss, the order size is increased or decreased by a user-selected amount.
Increasing Order Amount : This is the amount to be added to or subtracted from orders when the fixed ratio is reached. The default is $200, which means that for every $400 gain, $200 is reinvested in the strategy. On the other hand, for every $400 loss, the order size is reduced by $200.
Initial capital : $1000
Fees : Interactive Broker fees apply to this strategy. They are set at 0.18% of the trade value.
Slippage : 3 ticks or $0.03 per trade. Corresponds to the latency time between the moment the signal is received and the moment the order is executed by the broker.
Important : A bot has been used to test all possible box sizes to find out which one generates the highest return on BITSTAMP:LTCUSD while limiting the drawdown. This strategy is the most optimal with a box size equal to 5.08 in 8h timeframe.
BUY AND SHORT SIGNALS :
As the aim of this strategy is to follow major trends based on price movements, we need to be on the right side of price fluctuation. We trade every box reversal, i.e. we are LONG when the boxes are green indicating an uptrend and SHORT when they are red indicating a downtrend.
RISK MANAGEMENT :
This strategy can incur losses. The size of the box is decisive, as it is used to plot the RENKO chart and thus trigger buy or sell signals. It's also what allows us to manage risk. For every trade, we risk a maximum amount equal to 2 times the size of the box, i.e. :(5.08*2*nb_contract)/trade_value.
MONEY MANAGEMENT :
The fixed ratio method has been used to manage our gains and losses. For each gain of an amount equal to the value of the fixed ratio, we increase the order size by a value defined by the user in the "Increasing order amount" parameter. Similarly, each time we lose an amount equal to the value of the fixed ratio, we decrease the order size by the same user-defined value. This strategy not only increases our performance, but also our drawdown.
Enjoy the strategy and don't forget to take the trade :)
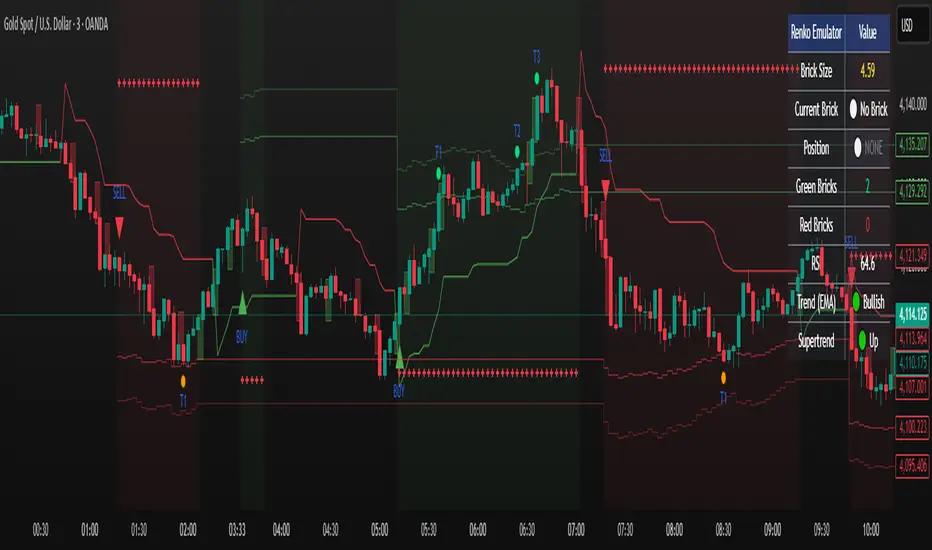
Renko Emulator Strategy # 🚀 Renko Emulator Strategy for Normal Candlestick Charts
Transform your trading with this advanced Renko-based strategy that works seamlessly on normal candlestick charts!
## ✨ What Makes This Special?
### 🎯 Smart Signal System
- **One Signal at a Time**: No confusing duplicate signals
- **Position State Tracking**: Always know your current position
- **Automatic Target Detection**: T1, T2, T3 calculated automatically
- **10 Comprehensive Alerts**: Never miss an opportunity
### 🔧 Technical Excellence
- **Renko Logic**: Filters market noise using brick formations
- **ATR-Based Sizing**: Adapts to market volatility
- **Multi-Indicator Confirmation**: EMA, RSI, MACD, Supertrend
- **Volume Validation**: Only high-probability setups
## 📊 How It Works
### Entry Signals
🟢 **LONG (BUY)**
- Reversal: Red bricks → First green brick
- Trend: 3+ consecutive green bricks
- With full technical confirmation
🔴 **SHORT (SELL)**
- Reversal: Green bricks → First red brick
- Trend: 3+ consecutive red bricks
- With full technical confirmation
### Position Management
📍 **Stop Loss**: Last opposite brick ± buffer
🎯 **Target 1**: 2× Brick size → Book 50%
🎯 **Target 2**: 3× Brick size → Book 30%
🎯 **Target 3**: 4× Brick size → Book 20%
### Exit Rules
⚠️ Opposite brick formation
⚠️ RSI extremes (>80 or <20)
⚠️ Manual exit as needed
## 🎨 Visual Features
### On Your Chart
- 📊 Renko brick overlays
- 🟢 Green triangles = BUY signals
- 🔴 Red triangles = SELL signals
- ⚪ Target hit markers (T1, T2, T3)
- 📈 Trend indicators overlay
- 🎨 Position background color
### Info Panel
Real-time dashboard showing:
- Current brick size & color
- Position status (LONG/SHORT/NONE)
- Consecutive brick count
- RSI level
- Trend direction
- Market conditions
## 🔔 Complete Alert System
**10 Alerts Available:**
✅ Long & Short Entry
✅ All 6 Target Hits (T1, T2, T3 each)
✅ Long & Short Exit
**Alert Messages Include:**
- Entry price & direction
- Profit booking instructions
- Risk management tips
- Next action guidance
## 💰 Best Instruments
### Highly Effective On:
- **Indian Markets**: Nifty 50, Bank Nifty
- **Stocks**: HDFC, Reliance, TCS, Infosys
- **Forex**: EUR/USD, GBP/USD, USD/JPY
- **Crypto**: BTC, ETH, major altcoins
- **Commodities**: Gold, Silver, Crude Oil
### Recommended Timeframes:
- **Day Trading**: 5-min, 15-min
- **Swing Trading**: 1-hour, 4-hour
- **Position Trading**: Daily
## ⚙️ Customizable Settings
### Brick Configuration
- ATR-based (automatic) or Fixed points
- Adjustable ATR period & multiplier
- Visual brick display on/off
### Indicator Parameters
- EMA length (default: 20)
- RSI period (default: 14)
- MACD settings (12, 26, 9)
- Supertrend (10, 3)
- Volume filter toggle
### Display Options
- Show/hide entry signals
- Show/hide target levels
- Show/hide info table
- Brick overlay transparency
## 📈 Usage Strategy
### For Beginners:
1. Add to chart with default settings
2. Wait for clear BUY/SELL arrows
3. Follow position management rules
4. Use recommended stop losses
5. Book profits at targets
### For Advanced Traders:
1. Optimize brick size per instrument
2. Fine-tune indicator parameters
3. Combine with your strategy
4. Backtest thoroughly
5. Scale position sizes
## ⚠️ Risk Management
### Built-in Protection:
- Maximum 2% risk per trade
- Clear stop loss levels
- Defined profit targets
- Position size calculator
- Daily loss limits
### Best Practices:
✅ Test on demo first
✅ Use proper position sizing
✅ Follow stop losses strictly
✅ Don't over-trade
✅ Maintain trading journal
## 🎓 What You Get
### Immediate Benefits:
- Clear entry/exit signals
- No analysis paralysis
- Reduced emotional trading
- Systematic approach
- Professional risk management
### Learning Opportunities:
- Understand Renko concepts
- Master position management
- Learn risk control
- Develop discipline
- Build consistent strategy
## 🐛 Troubleshooting
### No Signals?
- Check indicator settings
- Verify brick size not too large
- Ensure volume filter appropriate
- Try different timeframe
### Too Many Signals?
- Increase brick size
- Use higher timeframe
- Enable stricter filters
- Check signal filtering active
## 📊 Performance Notes
### Works Best In:
✅ Trending markets
✅ Clear directional moves
✅ Good liquidity
✅ Normal volatility
### Avoid Trading:
❌ Major news events
❌ Low volume periods
❌ Extreme volatility
❌ Choppy/sideways markets
## 🔄 Updates & Support
**Current Version**: 2.0
**Recent Updates:**
- ✅ Fixed duplicate signals
- ✅ Added position tracking
- ✅ Enhanced alert system
- ✅ Improved visual feedback
- ✅ Better target detection
**Future Plans:**
- Additional customization
- More alert options
- Advanced features
- Performance improvements
## 📜 Important Disclaimer
⚠️ **Please Read Carefully:**
This indicator is for **educational purposes only**. Trading involves substantial risk of loss. Past performance does not guarantee future results.
**You Must:**
- Use proper risk management
- Test strategies before live trading
- Never risk more than you can afford to lose
- Consult financial advisor if needed
- Understand your trading instrument
**The creator assumes no responsibility for trading losses incurred using this indicator.**
## 🙏 Credits
- Renko Concept: Traditional Japanese charting
- ATR Calculation: J. Welles Wilder
- Community Feedback: Beta testers & users
---
## 💬 Feedback Welcome!
If you find this helpful:
- ⭐ Like the indicator
- 💬 Share your feedback
- 🐛 Report bugs
- 💡 Suggest improvements
- 🔄 Share with traders
## 📞 Getting Started
1. **Add to Chart**: Click "Add to Chart"
2. **Configure Settings**: Adjust as needed
3. **Set Alerts**: Enable notifications
4. **Test First**: Use demo account
5. **Go Live**: Start small, scale up
---
**Happy Trading! 📈🚀**
**Trade Smart. Trade Safe. Trade Profitable.**
---
*Remember: Discipline + Risk Management + Good Strategy = Success*
*No indicator is perfect. Use as part of complete trading plan.*
Renko SR VolumeDaily ATR Renko SR Levels with Volume Analysis is a technical indicator that combines Renko-based support/resistance levels with volume analysis. It dynamically calculates Renko boxes using the ATR (Average True Range) of daily data and identifies key price levels. The indicator:
- Uses daily ATR to determine Renko box size.
- Draws support/resistance levels based on Renko price structure.
- Analyzes volume between levels to assess their strength.
- Colors levels based on relative volume activity:
- Red – strongest level (high volume activity).
- Orange – strong level.
- Yellow – moderate level.
- Green – weakest level (low volume activity).
- Detects daily Renko-based trends.
This tool helps traders visualize key price zones with volume confirmation, improving decision-making in trend and range markets.

Renko + PnF Bias Overlay v6Description:
The Renko + PnF Bias Overlay indicator provides a synthesized directional bias derived from manual implementations of both Renko and Point & Figure charting methodologies applied to standard time-based price data.
The indicator calculates Renko brick movements based on ATR-derived brick sizes, creating a noise-filtered representation that only registers significant price movements exceeding the specified brick size threshold. Renko direction changes occur only when price moves a full brick size beyond the previous brick.
Simultaneously, the indicator implements Point & Figure box counting logic with reversal requirements, where directional changes require a minimum of three boxes in the opposite direction, providing additional filtering of minor price fluctuations.
By combining these two price transformation methodologies, the indicator generates a composite directional bias that emphasizes sustained price movements while filtering out minor fluctuations and noise. The resulting bias reflects the underlying trend direction as determined by both the brick-based momentum filtering of Renko charts and the reversal confirmation requirements of Point & Figure charting.
This approach provides a robust trend-following signal that requires both significant price displacement and sustained directional commitment before registering a change in bias.

Renko NotificationAllows for setting of an alert, when a renko trend changes- i.e. when a green brick is formed and closes after a series of one or more red bricks and vice versa.
To set alert for green brick choose:
Green
Greater than
Red
To set alert for red brick choose:
Red
Greater than
Green
It works on any timeframe and renko settings.
However please note, that the alert set will be bound to the Renko settings that were present when the alert was set.
For instance: If traditional Renko was chosen with a setting of 10, then the alert will always carry that setting. This means that even if settings are changed on the chart afterwards, the alert will not reflect those new settings. In that case a new alert needs to be created, that will then contain the new settings.
This is important to keep in mind when using Renko ATR settings.

Trend Finder - Buy/Sell (Anuj Edition)Renko Trend Finder – Anuj Edition is a powerful trend-following tool designed to detect market direction using Renko logic instead of traditional candlesticks.
Renko filtering removes market noise, making trends clearer and reversals easier to identify.
This indicator internally builds Renko-style price movement and generates clean, high-quality Buy and Sell signals without repainting.

Renko Compression Index (RCI)Renko Compression Index
The Renko Compression Index (RCI) is a unique market structure indicator designed to detect price compression zones on Renko-based charts. It measures the frequency of directional changes in Renko bricks over a specific period, identifying moments of trend indecision or consolidation that may precede major breakouts.
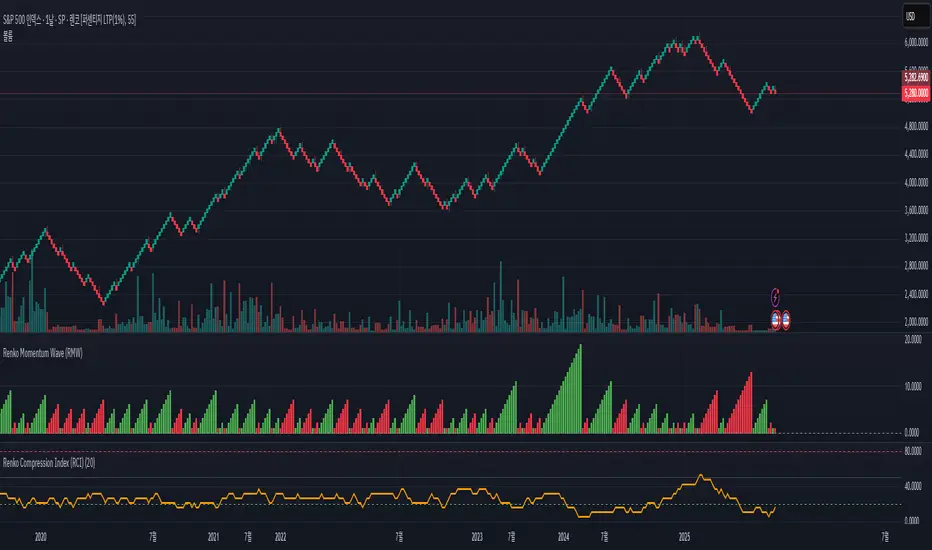
Renko Momentum Wave (RMW)Renko Momentum Wave
The Renko Momentum Wave (RMW) is a custom momentum oscillator specifically designed for Renko-based price action analysis. Unlike traditional oscillators that rely on time-based data, the RMW focuses on the directional consistency of Renko bricks, measuring the strength of trend momentum purely based on price movement.
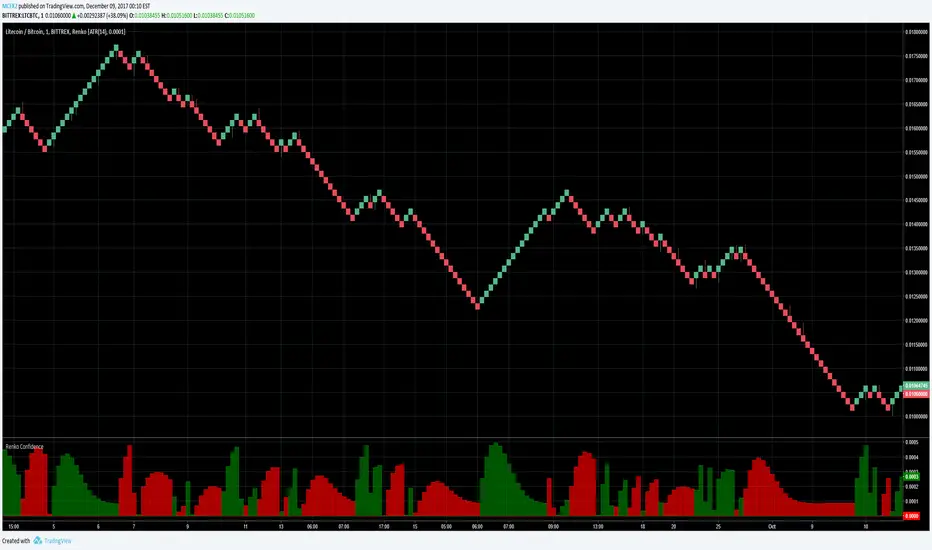
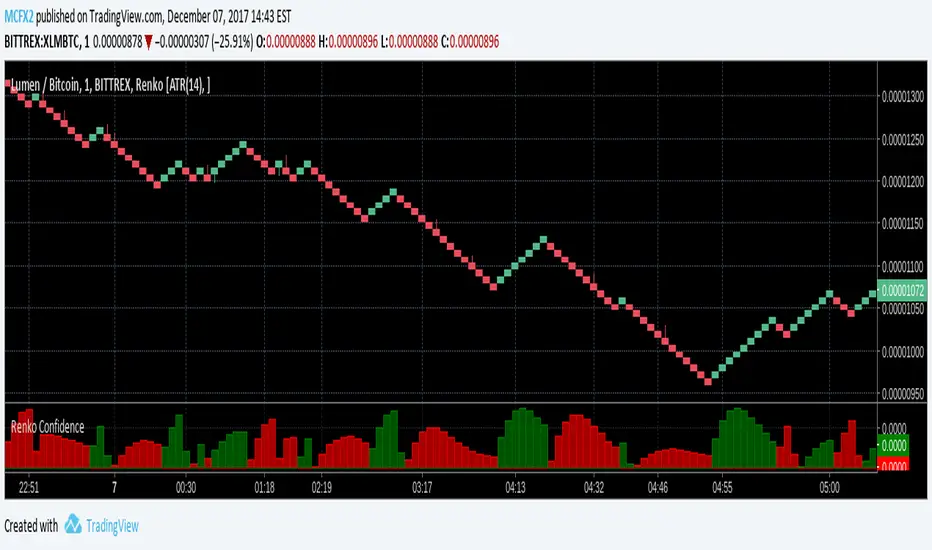
Renko Confidence [Public]This is identical to my old Renko Confidence indicator, but this is a public release for anyone to enjoy since it has been deprecrated and replaced with Renko Multi Grid .
Renko Flip MarkerThis script shows on chart where Renko bricks flip for candlestick chart. I intended it for candlestick chart, but it seems to work Renko chart too from my testing so far. You may change the Renko size for your own scenario you're trading. Hopefully helps, Thank you.

Renko ConfidenceProbably my simplest tool yet. Meant for use with Renko charts.
The height of the bar tells you how confident the indicator is a trend will continue, and the color gives the direction.
If the bar is small, or a different color than its corresponding renko bar, that is a sign of very low confidence. If confidence is high, you can use that to enter a trade earlier than the usual renko strategy would have you enter, as well as exit earlier.
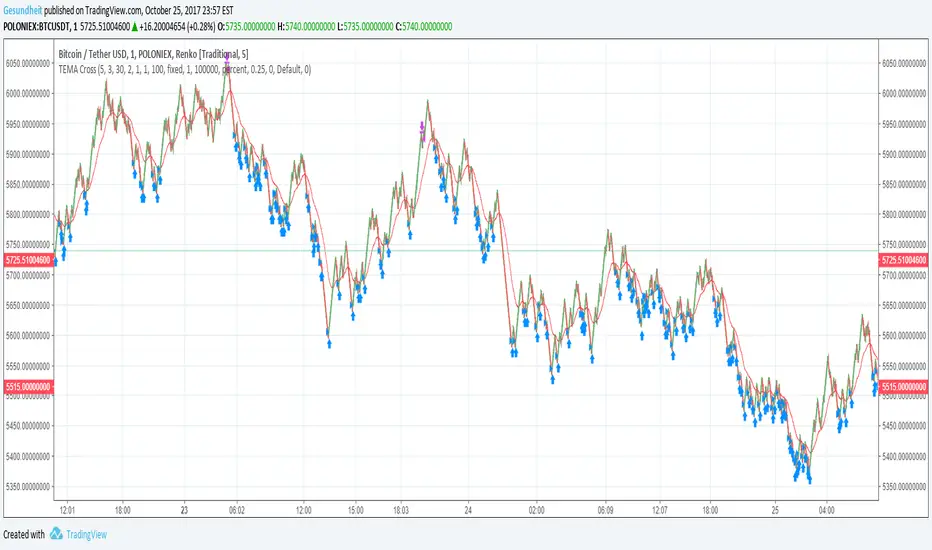
TEMA Cross on Renko CandlesRenko candles filter out noise by plotting a fixed change in price rather than a fixed time frame.
Strategies like MACD or MA cross can give a lot of false signals when the price is wavy, but not actually going anywhere. This is especially a problem with small time frames.
Since it's so easy to identify trends on a Renko plot, this strategy uses a simple moving average cross idea. Instead of an EMA, we use a TEMA ( triple exponential moving average ) because that version does not lag as much.
We also will avoid buying when the price is above a longer-term smoothed moving average. This means we will hopefully reduce bags, but we will also miss some trades.
Also included are
avg_protection -- if >0 only buy when it will bring down our average price, else buy whenever the TEMA crosses over the short-term SMA
gain_protection -- if >0 only sell when we meet out min_gain %, otherwise sell whenever TEMA crosses under the short-term SMA
I've been setting my Renko candles to a fixed range instead of ATR, and I use increments of roughly 0.1% in the example chart.
Renko EMA SystemMeant for Renko charts
Applies either an EMA and HMA to your renko charts
When prices crosses the slower, it enters you into position.
When price crosses the faster, it exits your position.
Meant to catch impulsive moves.

Renko AlertsAV alerts indicator to accompany our private Renko trading strategy. Uses custom Renko code (no security() calls) to eliminate repainting and signal erasure.

Renko Coded Candles [PUBLIC]Very simple free indicator. Colors the candlesticks based off of the Renko color for the given timeframe. Useful for those who like to use renko strategies in addition to candlestick-based strategies, so they dont have to switch charts as often.

Renko Average Bricks This indicator calculates the average RENKO brick streaks. Streaks=consecutive bricks of the same color. EX. G= 1 streak of 1. GGG = 1 streak of 3. RR 1 streak of 2. Single bricks count. There is the option for look back period which can be changed but Defaults to 50. Calculates the last 50 completed green streaks and then averages them. Same with red streaks. Only closed bricks count.
Very Simple and can be used for targets, ect.
Cheers

Renko Entry Alerts Limit +0.08Simple renko 1 block reversal strategy Adds +0.08 to 1 block during pre a=market and after hours for more successful fills.

Renko WPR Color ChangerChanges color when williams percent R is between 0 and -20 or when between -80 and -100. Works with renko, HA and regular candles. Can change color.

Renko LineBreak HeikinAshi background & MTFWe can have all the 3 types of candle plots (bar styles) over normal candles in the same chart.
We will have better picture on whats happening in specific chart candle type / bar style.
Option provided to turn off/on specific bar type.
Multi time frame is enabled.
Specific time frame can be chosen for individual bar style.
Renko XZThis is a renko based indicator
I just made it no repaint type. also the signals are based on max and min trend of the high ad low
alerts are included
you can control it by ATR size or better by multiplayer similar to super trend by logic
HTF control brick size but they are not important design by non security MTF

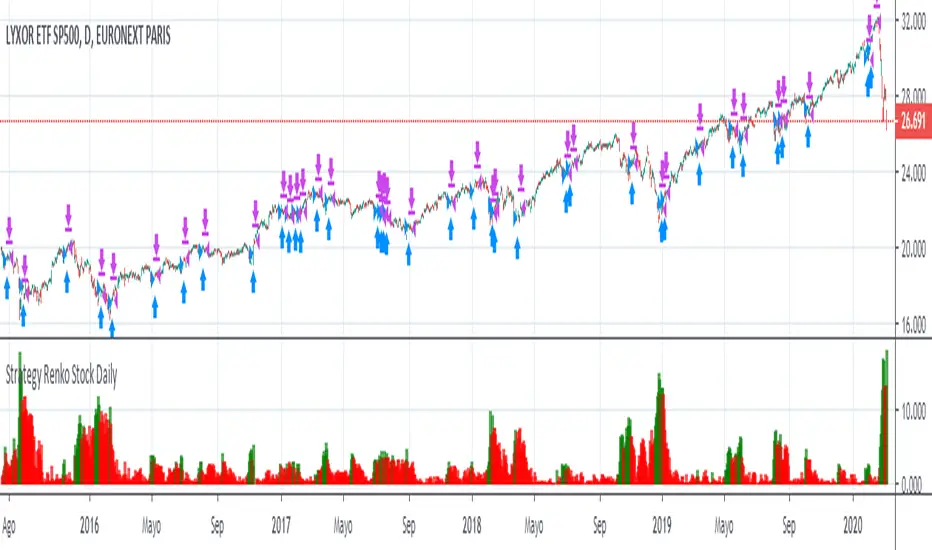
Renko Stock DailyHello,
This strategy must be use only for stocks. It doesnt work with FOREX or others..
You must use it only for renko candles
Best regards