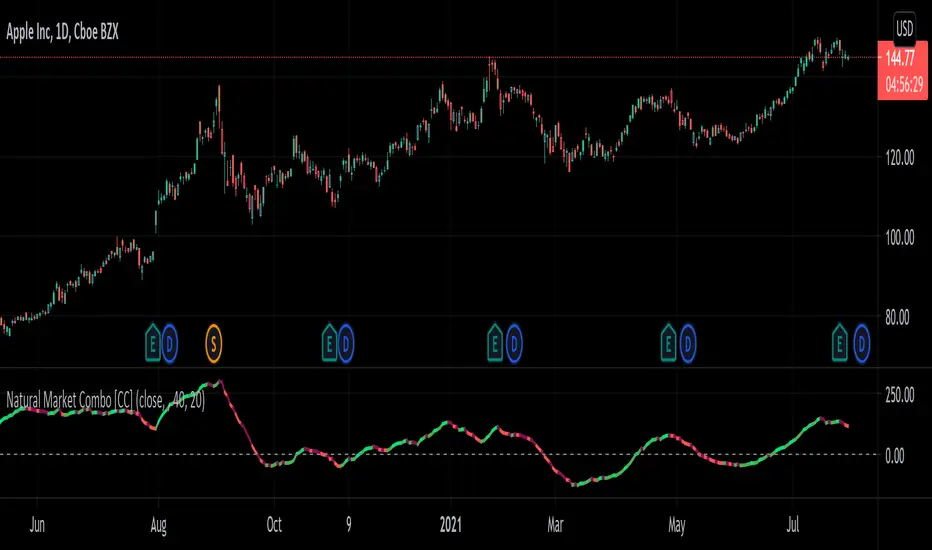
Natural Market Combo [CC]The Natural Market Combo was created by Jim Sloman and this is another one of my Ocean series of indicators to provide his full life's work free of charge to everyone. Just as the name implies, this is a combination of his two market indicators ( Natural Market River and Natural Market Mirror ) and this is a momentum indicator like the others. Big thanks to @altcoinz and @tmac87 for providing me the full source code and documentation to be able to publish all of Jim's work. This indicator is very simple to understand in that it takes the 2 market indicators and creates his own average of both indicators then smooths the result. I did fix an error that he didn't account for in his original script so the results are much more accurate. I have included strong buy and sell signals as darker colors and normal buy and sell signals as normal colors. Buy when the line turns green and sell when it turns red.
Let me know if there are any other indicators or scripts you would like to see me publish!
Pesquisar nos scripts por "momentum"
Natural Market Slope [CC]The Natural Market Slope was created by Jim Sloman and this is one of his many Ocean Indicators which I'm publishing thanks to receiving source materials from @altcoinz and @tmac87. I did completely rewrite the formula for this indicator but I commented out the original calculation so you can compare or just for study purposes. I like this version better because it is very smooth and the original formula is a bit faster with response but is very choppy in comparison.
This indicator was the basis for his Natural Market Combo which I will be publishing very soon so stay tuned for that. The idea behind all of his Natural indicators was to use the natural log of the current price in different ways. This indicator obviously focuses on the slope and it essentially becomes another momentum indicator which peaks when the upward momentum is gone and vice versa. Buy when the line turns green and sell when it turns red. I have added strong buy and sell signals in addition to the normal ones and strong signals are darker in color in comparison to the original lighter colors.
Let me know if there are any other indicators you would like to see me publish!

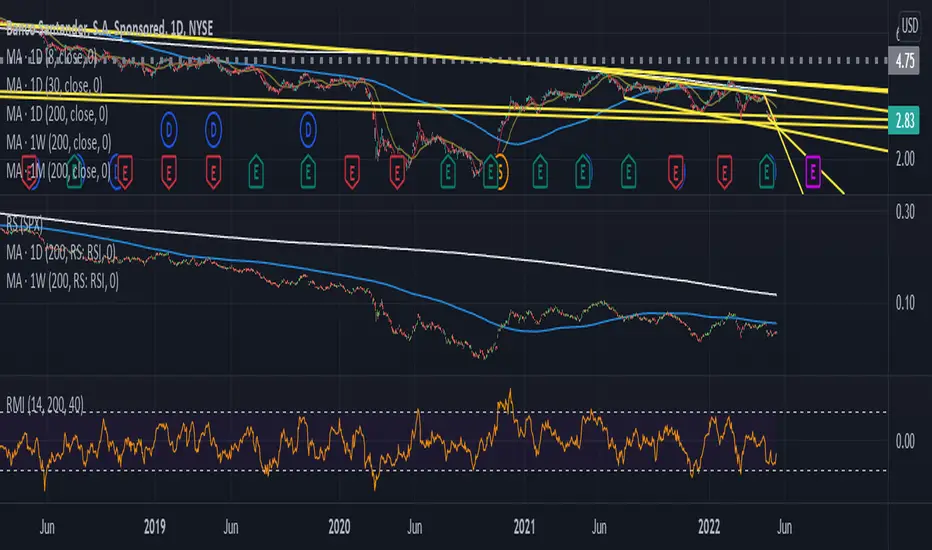
Relative Momentum IndexThe RMI indicator is intended as a general upgrade to the RSI indicator based on logical improvements to the underlying mathematics of the RSI function.
The first change is that the RMI indicator uses the maximal change in price in both directions rather than simply the change in the closing price to better capture the relative momentum in each direction. The second change is that the the ratio between bullishness and bearishness is passed through a log function rather than the 1/(1+x) function to remove the processing artefacts caused by the EMAs and the compression within the restricted range. As a result, the RMI is an unbounded centred oscillator, although it is usually at a similar value to the RSI indicator doubled and centred at zero. The bands are intended to make differences between values more visible at a glance and for interface familiarity with the RSI indicator, though their levels are arbitrary and not intended as overbought/oversold signals.
The practical effect of these changes are that divergences are easier to see since the indicator is not compressed at extreme values and divergence strategies based on the RMI indicator are slightly more accurate. The list of occasions on the included DJI Weekly chart where the RMI divergence strategy correctly predicted a reversal while the RSI did not are as follows: July 1932, June 1962, May 1970, November 1987, May 2021
Volume, Momentum and Volatility weighted moving averageMoving averages are filters on price data. This moving average creates a filter which factors in:
- the price RSI or it's Momentum
- the volume RSI
- the RVI or Volatility
Each factor is put through a least squares filter to smooth them first.
Then the factors are used to build a coefficient for an exponentially weighted average.
The chart above shows a comparison of standard average types with this script.
This is useful if you are looking for a moving average based trigger and do not wish to react to candle noise price action.

QQEMoMoTV█ OVERVIEW
This plots the QQE (Quantitive Qualitative Estimation)
with the addition of labels to show areas to watch out for and a colored cloud to show Green Upwards or Red Downwards Momentum
The QQE indicator is based on Wilder's RSI, which is based on a smoothed RSI comparing the change (delta Δ) between between bars
to compute the FastTL and SlowTL depending on the RSI Period, Slow Factor and QQE settings selected
As this works similarly to the RSI, it provides areas of overbought and oversold, and a cross at 50 for more bullish or more bearish
The FastTL and SlowTL crossovers works similarly to the crossover of a fast and slow moving average which can indicate bullish or bearish
When the SlowTL crosses above the FastTL a Green cloud indicating upwards momentum is drawn and vice versa when FastTL crosses above SlowTL
Bullish signals generated when Blue line crosses above Orange line, or Green MoMo cloud, Uptrend
Bearish signals generated when Orange line crosses above Blue line, or Red MoMo cloud, Downtrend
QQE Areas of interest:
Oversold: QQE < 33, Overbought: QQE > 67
Cross at 50: QQE crossing 50, this is an area that is between more bullish >50 and more bearish <50 zones
Note: as 50 is the switch between more bullish or more bearish zones , it is common to watch out for Support/Resistance Tests at this level
Tip: when QQE appears to be flat, this indicates a flat trend, this can commonly happen around the 50 zone when direction is relatively undecided, see the image below for an example
Very Overbought: QQE > 90, Careful! Watch out! QQE is showing very overbought and is generally a good area to take profit as others may sell soon too
QQE Fast settings: gives earlier signals, but also gives more shorter term signals
RSI_Period = 6, Slow_Factor = 3, QQE = 2.621
QQE Slow settings: gives more reliable signals, but sometimes a little late, best to use both fast and slow together for confirmation of the trend
RSI_Period = 20, Slow_Factor = 5, QQE = 4.236
You can add the QQEMoMoTV indicator to your chart twice and change one of them to the Fast settings and one of them to the Slow settings.
By comparing the QQEMoMoTV Fast and QQEMoMoTV Slow together you can get a better idea of the overall trend.
To best determine if this is a entry point or a trend reversal, it is recommended to use in conjunction with the MashumeHullTV indicator
█ FEATURES
Calculations
Calculates the change (delta Δ) between between bars based on Wilder's smoothed RSI to compute the FastTL (Orange) and SlowTL (Blue) lines
These are dependent on the QQE Fast settings or QQE Slow settings from the input RSI Period, Slow Factor and QQE selected
Labels are shown when QQE crosses areas of interest on the chart as Label text and shown with white dots on the QQEMoMoTV indicator
Inputs
You can use the script's inputs to configure:
• Calculation Source (default close)
• RSI Period (default 20)
• Slow Factor (default 5)
• QQE (default 4.236)
• Whether to show Green/Red MoMo Cloud
• Whether to show the QQE Label
• Style and Position of the QQELabel (default None)
None is selected as default to take up least space for optimal viewing when on Tradingview mobile, but you are free to change the style however you like
Alerts
Buy Signal alert based on rsi_ma crossing above FastAtrRsiTL, when Blue Line Cross above Orange Line, Green MoMo Cloud, Bullish
Sell Signal alert based on FastAtrRsiTL crossing above rsi_ma, when Orange Line Cross above Blue Line, Red MoMo Cloud, Bearish
█ CREDITS
Original Author: greyghost7
Feature upgrades and usage: Xiuying
Converted to Tradingview by: Machdragon
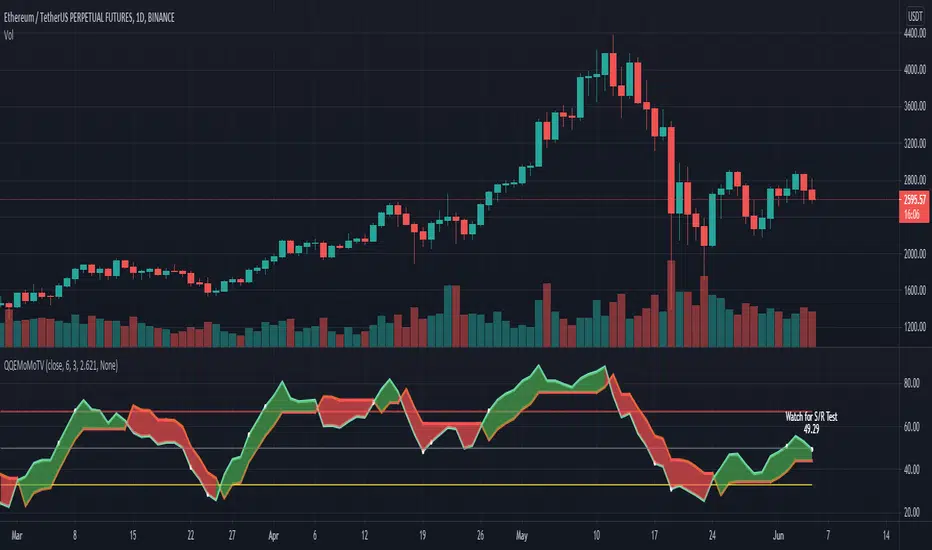
Table: Relative Strength Index (Multiple Timeframes) DESCRIPTION
It is the most popular and dependent Indicator, Relative Strength Index (RSI) . Now, I put inside a table to view chart momentum from Multiple timeframes.
This indicator tells different Timeframe (30 minutes, 1 hour, 4 hour, 1 day, 1 week, 1 month) of RSI value within table form.
HOW TO USE
Can consider a Long position when all timeframes go oversold while Short position when all timeframes go overbought. Alarm function is available. It sounds as all timeframes are overbought or oversold.
Modified The source of indicator from ©BeeHolder named "Performance"

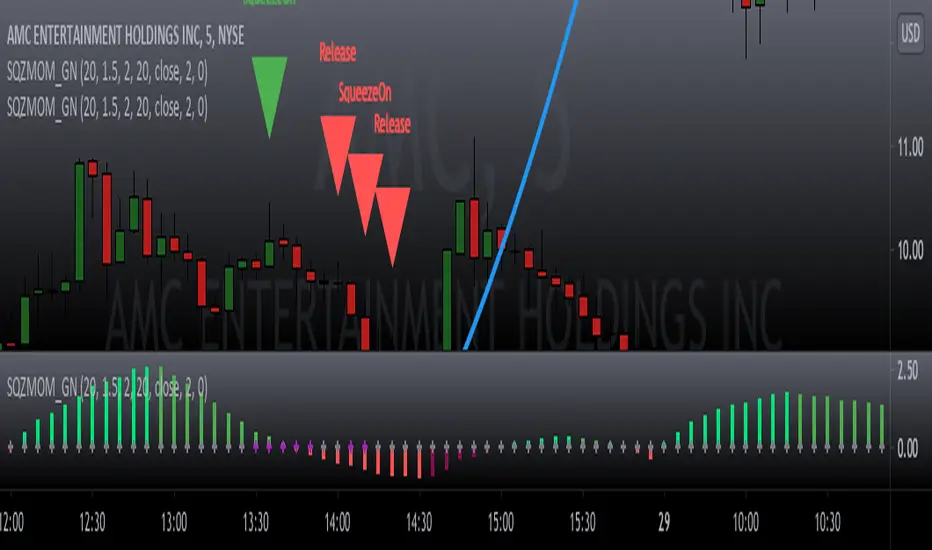
Squeeze Momentum Indicator MTF with alerts [lazy bear]MTF version of the popular squeeze momentum indicator, created and shared by Lazy Bear

(JS) BallistaAlright so this is a script I made by combining two existing ones and making a really cool discovery that has proven very useful.
You'll notice that there are two separate oscillators that are laid on top of each other. The background oscillator is my "Tip-and-Dip" oscillator which you can see here (will refer to this as TnD from here), and the foreground oscillator from the Squeeze , which can be viewed here .
Initially I just wanted to see how they interacted with one another and compare them, but this led to some pretty interesting observations.
First let me go through the options real quick to get that out of the way, though it is mostly self-explanatory.
Lookback Period defines the amount of bars used for the TnD oscillator.
Smoothing Value smooths out the TnD output.
Standard Deviations is used to calculate the TnD formula.
Color Scheme is preset BG colors.
Using Dark Mode changes colors based on dark mode or not.
Squeeze Momentum On turns the Squeeze in the foreground off and on.
Arrows Off turns the arrows on the indicator off and on.
Now to explain the indicator a bit more. I have the default lookback period as 40 due to the Squeeze being 20, which makes the TnD oscillator the "slow" output with the Squeeze being the "fast" output.
Some initial observations were that when both the Squeeze and the TnD are moving in the direction, when the Squeeze is higher (uptrend) or lower (downtrend) it seems to indicate strength in the move. As the move loses steam you'll notice the Squeeze diverge from the TnD.
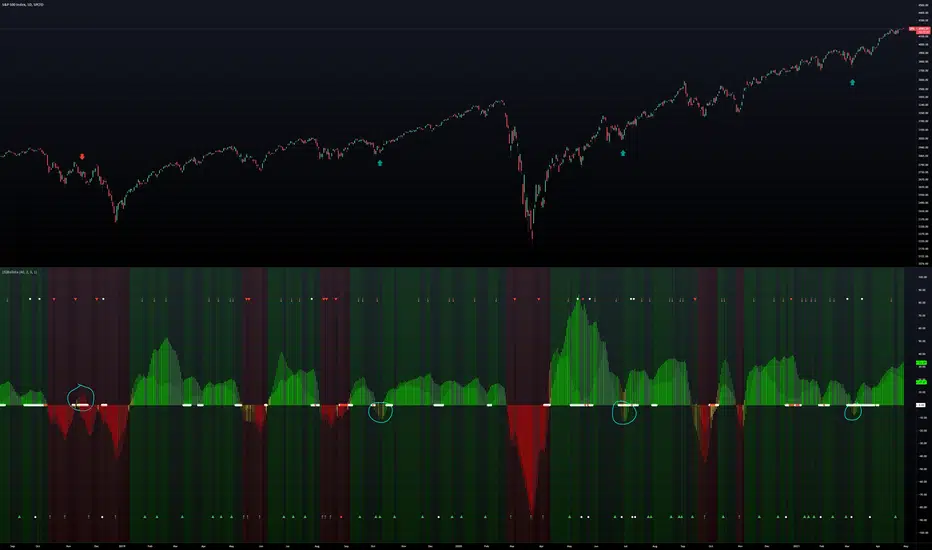
However, the most useful thing I discovered about the interaction between these two indicators is where the name for it came from. So if you aren't familiar with what a Ballista is, per Wikipedia, "The ballista... sometimes called bolt thrower, was an ancient missile weapon that launched either bolts or stones at a distant target." There are instances where the Squeeze seems to get ahead of itself and gets too far away from the TnD (which is the long term trend between the two). The key thing to look for is an "inverted squeeze" - this is when the squeeze oscillator ends up flipping against the TnD. When this occurs there is an extremely high probability that you'll see price shoot back the opposite way of the Squeeze.
I've been using this setup myself for about a year now and have been very satisfied with the results thusfar. I circled some examples on the SPX daily chart here to show you what I mean with the inverted Squeeze shooting back.
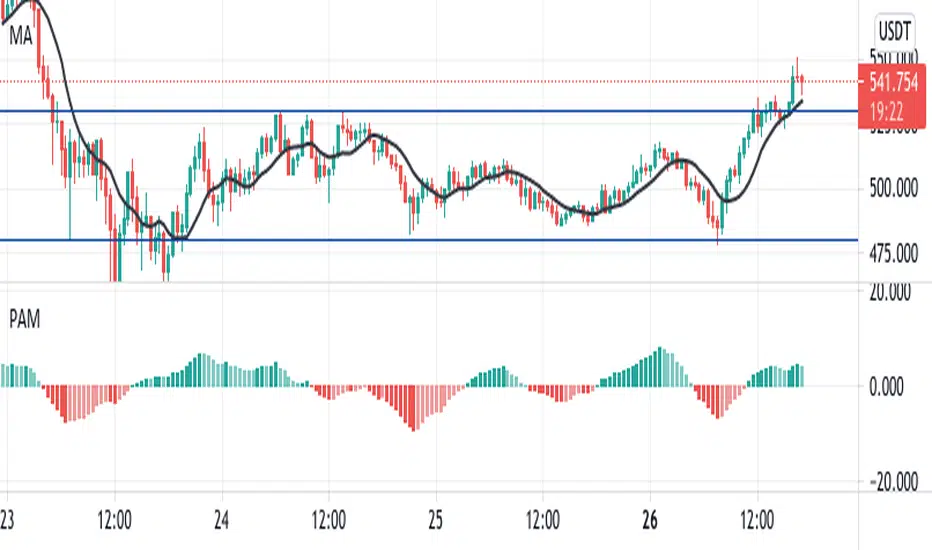
Price Acceleration Momentum [PAM]this indicator plots the acceleration of the price using the derivatives of RSI.
you can use it just like a momentum oscillator to catch divergences, trend direction, breakout direction, etc
IT Volume Momentum OscillatorAuthor/Creator: Carl Swenlin
Data components required: Up Volume (UV), Down Volume ( DV ), Total
Volume (V).
Description: The Intermediate Term Volume Momentum Oscillator is a
barometer of breadth. To calculate the ITVM add the daily McClellan Oscillator
- Volume (ratio adjusted using the difference of up and down volume divided by
the total volume ) to the daily 39-day exponential average, then calculate a 20-
day exponential average of the result.

IT Breadth Momentum OscillatorCreator: Carl Swenlin
Data components required: Advances (A), Declines (D).
Description: The Intermediate Term Breadth Momentum Oscillator is a barometer of breadth. To calculate the ITBM, add the daily McClellan Oscillator
(ratio adjusted) to the daily 39-day exponential average, then calculate a 20-day exponential average of the result

Structure AnalyzerA momentum indicator that uses the highest and lowest values for price in three different lookback lengths to find the performance relative to three timeframes.
- The yellow line is the product of the price performance in three different timeframes.
- The red line is 200 EMA of the performance.
- The blue columns represent the same calculation or the volume(OBV based).
- The aqua line is the 200 EMA of the volume performance.
How to use: Whenever the performance crosses above the 200 EMA, the price is in an uptrend.
Important: When in a downtrend, the performance will stay below the 200 EMA for a long time; hence it is important o wait until the crossover.

Electrified Momentum OverlayVisualizes a moving average and changes in momentum in one overlay.
8 phase alert options.

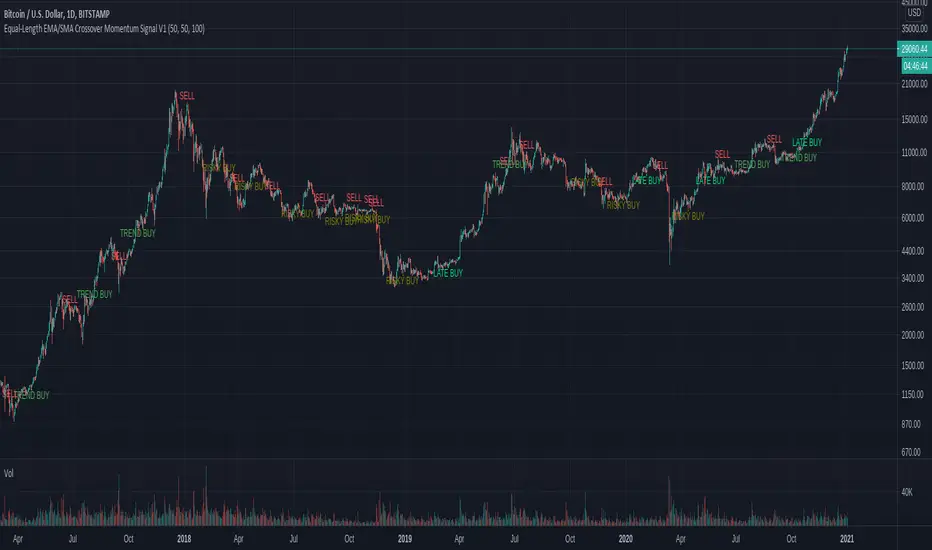
Combined Momentum MA (Equal-Length EMA/SMA Crossover)Overview:
This momentum and trend-following strategy captures the majority of any trending move, and works well on high timeframes.
It uses an equal-period EMA and SMA crossover to detect trend acceleration/deceleration, since an EMA places a greater weight and significance on the most recent data.
To reduce noise and optimize entries, we combined this with an overall trend bias for further confluence.
How it works:
Signals are determined by the crossover of an EMA and SMA of the same length, e.g. EMA-50 and SMA-50.
The overall trend bias is determined using a slower SMA golden/death cross, e.g. SMA-50 and SMA-100.
The signal is stronger when it occurs in confluence with the overall trend bias, e.g. when EMA-50 crosses over SMA-50, while above the SMA-100. This is analogous to only opening long positions in a bull market.
Indicator description:
GREEN: Up Trend (EMA is above SMA, while EMA is above BIAS_MA. This shows a bullish confluence.)
YELLOW: No Trend (EMA/SMA crossover and BIAS_MA are not in confluence.)
RED = Down Trend (EMA is below SMA, while EMA is below BIAS_MA. This shows a bearish confluence.)

Squeeze Momentum Indicator v4_pine [By Lazy Bear]This is the famous Squeeze Momentum Indicator made by @LazyBear in v4 version if someone wants to test some strategies, as the original code was in v2 version the code converter couldn't convert to v4.

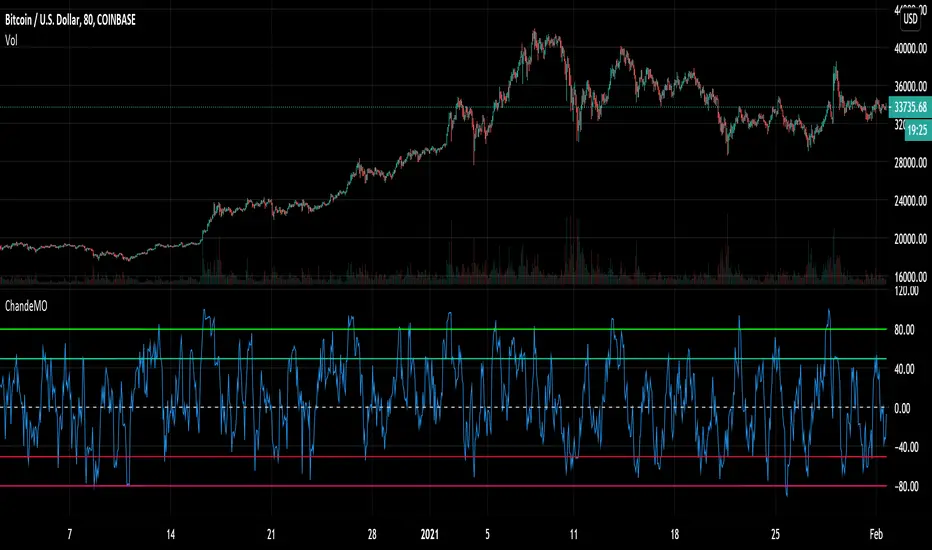
Chande Momentum Oscillator - Alerts and RegionsIt seemed weird to me that the default Chande didn't have overbought and oversold regions, despite them being described for Chande Momentum and working very well. So I added the lines and alert conditions. I've used this to very good results in my day trading.
My strategy involved 4 timeframes of candlestick, each with 4 timeframes of Chande overlaid. Candlesticks are 5 min, 20 min, 80 min, 320 min and Chandes are x1, x2, x4 and x8 of the relevant time zone. Give it a shot. Use the 5 min Chande as Buy and Sell signal with the other timeframes for trend confirmation. You may get a lot of extra alerts with this setup, but it's almost impossible to really miss an opportunity if you use it right. It will take up all your free time though, as a warning. Using this strat made me go crazy.
Use the chande crossing over the lines as the signal, not just being in the region, as that will make you buy early.
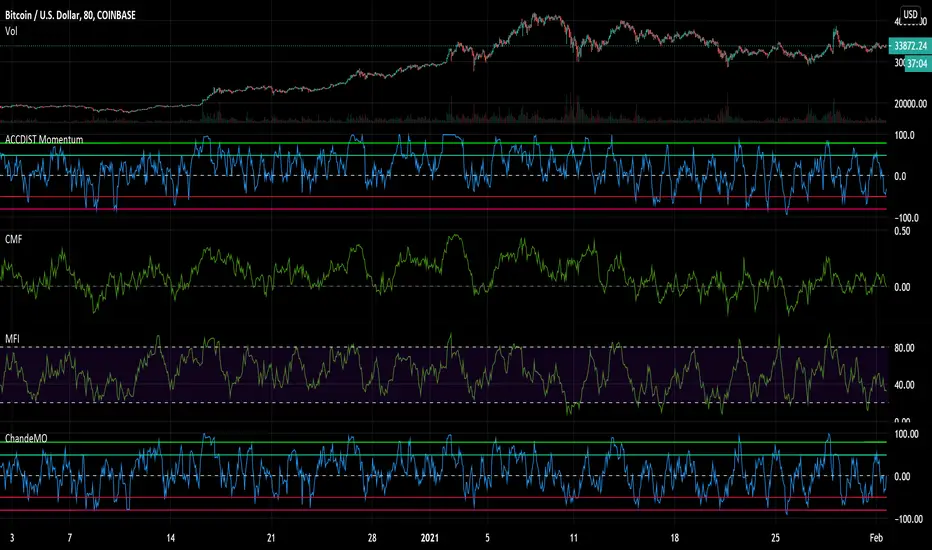
Accumulation and Distribution MomentumThis applies Chande Momentum to Accumulation and Distribution index as a means to changes.
Experimental oscillator.
Compare it to both Money Flows, Acc/Dis and Chande and you notice it has elements of all of them. Could potentially replace other volume based momentum indicators in your strategy.
It is a little more volatile, reaching from side to side, while having a tendency to lean towards the side that gets the most action over a longer period of time.
It also tends to reach and hang in oversold regions BEFORE a pump - something I noticed.
Could be used as an early warning sign as well as for overall trend analysis.
Squeeze Momentum Signal Overlay [GN]Companion script for Squeeze Momentum Indicator that plots the signal on chart.
Equal-Length EMA/SMA Crossover Momentum Signal V1Overview:
This momentum and trend-following strategy captures the majority of any trending move, and works well on high timeframes.
It uses an equal-period EMA and SMA crossover to detect trend acceleration/deceleration, since an EMA places a greater weight and significance on the most recent data.
This version is optimized for longs, and designed to cut your losses quickly and let your winners run.
To reduce noise and optimize entries, we combined this with an overall trend bias for further confluence.
How it works:
Signals are determined by the crossover of an EMA and SMA of the same length, e.g. EMA-50 and SMA-50.
The overall trend bias is determined using a slower SMA golden/death cross, e.g. SMA-50 and SMA-100.
The signal is stronger when it occurs in confluence with the overall trend bias, e.g. when EMA-50 crosses over SMA-50, while above the SMA-100. This is analogous to only opening long positions in a bull market.
Signal description:
Trend Buy: EMA crosses above SMA, and overall trend bias is bullish. Buying is in confluence with the overall trend bias.
Risky Buy: EMA crosses above SMA, and overall trend bias is bearish. Buying is early, more risky, and not in confluence with the overall trend bias.
Late Buy: SMA crosses above BIAS_SLOW. This gives further confirmation of bullish trend, but signal comes later.
Sell: EMA crosses under SMA.
NIMBLR F2F Momentum & Indecisive Candle FinderIndicator based on strategy shared by Nimblr in Elearnmarket Face to face interview
Red Circle means "Indecision" (I)
Green Plus means "Momentum" (M)

Bjorgum RSIRSI output signals are displayed with color change to reflect the plotted value. This makes evaluating RSI conditions require but a glance.
RSI momentum buy signals are given on the cross of the 50 level, whereas sell signals are given on a fall below.
Default values a 5 period RSI which gives more timely entrances and exits for swing traders. This can be adjusted to the typical 14 period if the viewer desires slower signals.
Bullish and bearish area is shaded to accentuate the signal to the eye.
Excellent results can be found when coupling BJ RSI, with BJ TSI, and the reversal system using all 3 as a complete together simultaneously
Default color changes are plotted as a recorded value falls within the following levels:
RSI < 30 = green
RSI 30-50 = red
RSI 50-70 = blue
RSI 70-80 = yellow
RSI 80-90 = orange
RSI 90-100 = white hot

Bjorgum TSI Arrows
This script is intended to help the viewer identify potential turning points with momentum "headwinds" or "tailwinds" with a visual que at the bar level. The presence of arrows indicates that the TSI indicator is either "curling" up under the signal line, or "curling" down over the signal line. This can help to anticipate reversals, or moves in favor of trend direction.
Multiple script overlays can be used for "Multi-timeframe analysis" by altering the "resolution" feature.
eg: Viewer could enable 2 "Arrow" scripts while watching the daily timeframe, and setting one of them to indicate weekly conditions. This can help identify prevailing trend strength when using smaller timeframes.

True Momentum Oscillator - Universal Edition"TMO calculates momentum using the delta of price. Giving a much better picture of trend, trend reversals and divergence than momentum oscillators using price".
This is an implementation of the popular ToS indicator TMO . It incorporates a few improvements on the original code, which have also been proposed upstream. Please read the opening comment in the code.
How to use this indicator?
You can think of this indicator as a mix of RSI and MACD .
Similarly to RSI , it has overbought and oversold levels.
Similarly to MACD it has a TMO line and a signal line. The histogram shows the difference between those lines and easily lets you spot crossovers.
What does this indicator do?
In its default configuration, it looks at the last 14 candles and determines a score based on whether the current price is higher or lower than those candles. This reacts to breakouts very quickly, especially after a consolidation period.
