Volume Range Profile with Fair Value (Zeiierman)█ Overview
The Volume Range Profile with Fair Value (Zeiierman) is a precision-built volume-mapping tool designed to help traders visualize where institutional-level activity is occurring within the price range — and how that volume behavior shifts over time.
Unlike traditional volume profiles that rely on fixed session boundaries or static anchors, this tool dynamically calculates and displays volume zones across both the upper and lower ends of a price range, revealing point-of-control (POC) levels, directional volume flow, and a fair value drift line that updates live with each candle.
You’re not just looking at volume anymore. You’re dissecting who’s in control — and at what price.
⚪ In simple terms:
Upper Zone = The upper portion of the price range, showing concentrated volume activity — typically where selling or distribution may occur
Lower Zone = The lower portion of the price range, highlighting areas of high volume — often associated with buying or accumulation
POC Bin = The bin (price level) with the highest traded volume in the zone — considered the most accepted price by the market
Fair Value Trend = A dynamic trend line tracking the average POC price over time — visualizing the evolving fair value
Zone Labels = Display real-time breakdown of buy/sell volume within each zone and inside the POC — revealing who’s in control
█ How It Works
⚪ Volume Zones
Upper Zone: Anchored at the highest high in the lookback period
Lower Zone: Anchored at the lowest low in the lookback period
Width is user-defined via % of range
Each zone is divided into a series of volume bins
⚪ Volume Bins (Histograms)
Each zone is split into N bins that show how much volume occurred at each level:
Taller = More volume
The POC bin (Point of Control) is highlighted
Labels show % of volume in the POC relative to the whole zone
⚪ Buy vs Sell Breakdown
Each volume bin is split by:
Buy Volume = Close ≥ Open
Sell Volume = Close < Open
The script accumulates these and displays total Buy/Sell volume per zone.
⚪ Fair Value Drift Line
A POC trend is plotted over time:
Represents where volume was most active across each range
Color changes dynamically — green for rising, red for falling
Serves as a real-time fair value anchor across changing market structure
█ How to Use
⚪ Identify Key Control Zones
Use Upper/Lower Zone structures to understand where supply and demand is building.
Zones automatically adapt to recent highs/lows and re-center volume accordingly.
⚪ Follow Institutional Activity
Watch for POC clustering near price tops or bottoms.
Large volumes near extremes may indicate accumulation or distribution.
⚪ Spot Fair Value Drift
The fair value trend line (average POC price) gives insight into market equilibrium.
One strategy can be to trade a re-test of the fair value trend, trades are taken in the direction of the current trend.
█ Understanding Buy & Sell Volume Labels (Zone Totals)
These labels show the total buy and sell volume accumulated within each zone over the selected lookback period:
Buy Vol (green label) → Total volume where candles closed bullish
Sell Vol (red label) → Total volume where candles closed bearish
Together, they tell you which side dominated:
Higher Buy Vol → Bullish accumulation zone
Higher Sell Vol → Bearish distribution zone
This gives a quick visual insight into who controlled the zone, helping you spot areas of demand or supply imbalance.
█ Understanding POC Volume Labels
The POC (Point of Control) represents the price level where the most volume occurred within the zone. These labels break down that volume into:
Buy % – How much of the volume was buying (price closed up)
Sell % – How much was selling (price closed down)
Total % – How much of the entire zone’s volume happened at the POC
Use it to spot strong demand or supply zones:
High Buy % + High Total % → Strong buying interest = likely support
High Sell % + High Total % → Strong selling pressure = likely resistance
It gives a deeper look into who was in control at the most important price level.
█ Why It’s Useful
Track where fair value is truly forming
Detect aggressive volume accumulation or dumping
Visually split buyer/seller control at the most relevant price levels
Adapt volume structures to current trend direction
█ Settings Explained
Lookback Period: Number of bars to scan for highs/lows. Higher = smoother zones, Lower = reactive.
Zone Width (% of Range): Controls how much of the range is used to define each zone. Higher = broader zones.
Bins per Zone: Number of volume slices per zone. Higher = more detail, but heavier on resources.
-----------------
Disclaimer
The content provided in my scripts, indicators, ideas, algorithms, and systems is for educational and informational purposes only. It does not constitute financial advice, investment recommendations, or a solicitation to buy or sell any financial instruments. I will not accept liability for any loss or damage, including without limitation any loss of profit, which may arise directly or indirectly from the use of or reliance on such information.
All investments involve risk, and the past performance of a security, industry, sector, market, financial product, trading strategy, backtest, or individual's trading does not guarantee future results or returns. Investors are fully responsible for any investment decisions they make. Such decisions should be based solely on an evaluation of their financial circumstances, investment objectives, risk tolerance, and liquidity needs.
Pesquisar nos scripts por "imbalance"

Money Flow Pulse💸 In markets where volatility is cheap and structure is noisy, what matters most isn’t just the move — it’s the effort behind it. Money Flow Pulse (MFP) offers a compact, color-coded readout of real-time conviction by scoring volume-weighted price action on a five-tier scale. It doesn’t try to predict reversals or validate trends. Instead, it reveals the quality of the move in progress: is it fading , driving , exhausting , or hollow ?
🎨 MFP draws from the traditional Money Flow Index (MFI), a volume-enhanced momentum oscillator, but transforms it into a modular “pressure readout” that fits seamlessly into any structural overlay. Rather than oscillating between extremes with little interpretive guidance, MFP discretizes the flow into clean, color-coded regimes ranging from strong inflow (+2) to strong outflow (–2). The result is a responsive diagnostic layer that complements, rather than competes with, tools like ATR and/or On-Balance Volume.
5️⃣ MFP uses a normalized MFI value smoothed over 13 periods and classified into a 5-tier readout of Volume-Driven Conviction :
🍆 Exhaustion Inflow — usually a top or blowoff; not strength, but overdrive (+2)
🥝 Active Inflow — supportive of trend continuation (+1)
🍋 Neutral — chop, coil, or fakeouts (0)
🍑 Selling Intent — weakening structure, possible fade setups (-1)
🍆 Exhaustion Outflow — often signals forced selling or accumulation traps (-2)
🎭 These tiers are not arbitrary. Each one is tuned to reflect real capital behavior across timeframes. For instance, while +1 may support continuation, +2 often precedes exhaustion — especially on the lower timeframes. Similarly, a –1 reading during a pullback suggests sell-side pressure is building, but a shift to –2 may mean capitulation is already underway. The difference between the two can define whether a move is tradable continuation or strategic exhaustion .
🌊 The MFI ROC (Rate of Change) feature can be toggled to become a volatility-aware pulse monitor beneath the derived MFI tier. Instead of scoring direction or structure, ROC reveals how fast conviction is changing — not just where it’s headed, but how hard it's accelerating or decaying. It measures the raw Δ between the current and previous MFI values, exposing bursts of energy, fading pressure, or transitional churn .
🎢 Visually, ROC appears as a low-opacity area fill, anchored to a shared lemon-yellow zero line. When the green swell rises, buying pressure is accelerating; when the red drops, flow is actively deteriorating. A subtle bump may signal early interest — while a steep wave hints at an emotional overreaction. The ROC value itself provides numeric insight alongside the raw MFI score. A reading of +3.50 implies strong upside momentum in the flow — often supporting trend ignition. A score of –6.00 suggests rapid deceleration or full exhaustion — often preceding reversals or failed breakouts.
・ MFI shows you where the flow is
・ ROC tells you how it’s behaving
😎 This blend reveals not just structure or intent — but also urgency . And in flow-based trading, urgency often precedes outcome.
🧩 Divergence isn’t delay — it’s disagreement . One of the most revealing features of MFP is how it exposes momentum dissonance — situations where price and flow part ways. These divergences often front-run pivots , traps , or velocity stalls . Unlike RSI-style divergence, which whispers of exhaustion, MFI divergence signals a breakdown in conviction. The structure may extend — but the effort isn’t there.
・ Price ▲ MFI ▼ → Effortless Markup : Often signals distribution or a grind into liquidity. Without rising MFI, the rally lacks true flow participation — a warning of fragility.
・ Price ▼ MFI ▲ → Absorption or Early Accumulation : Price breaks down, but money keeps flowing in — a hidden bid. Watch for MFI tier shifts or ROC bursts to confirm a reversal.
🏄♂️ These moments don’t require signal overlays or setup hunting. MFP narrates the imbalance. When price breaks structure but flow does not — or vice versa — you’re not seeing trend, you’re seeing disagreement, and that's where edge begins.
💤 MFP is especially effective on intraday charts where volume dislocations matter most. On the 1H or 15m chart, it helps distinguish between breakouts with conviction versus those lacking flow. On higher timeframes, its resolution softens — it becomes more of a drift indicator than a trigger device. That’s by design: MFP prioritizes pulse, not position. It’s not the fire, it’s the heat.
📎 Use MFP in confluence with structural overlays to validate price behavior. A ribbon expansion with rising MFP is real. A compression breakout without +1 flow is "fishy". Watch how MFP behaves near key zones like anchored VWAP, MAs or accumulation pivots. When MFP rises into a +2 and fails to sustain, the reversal isn’t just technical — it’s flow-based.
🪟 MFP doesn’t speak loudly, but it never whispers without reason. It’s the pulse check before action — the breath of the move before the breakout. While it stays visually minimal on the chart, the true power is in the often overlooked Data Window, where traders can read and interpret the score in real time. Once internalized, these values give structure-aware traders a framework for conviction, continuation, or caution.
🛜 MFP doesn’t chase momentum — it confirms conviction. And in markets defined by noise, that signal isn’t just helpful — it’s foundational.

FVG Visual Trading ToolHow to Use the FVG Tool
1. Identify the FVG Zone
Bullish FVG: Look for green boxes that represent potential support zones. These are areas where price is likely to retrace before continuing upward.
Bearish FVG: Look for red boxes that represent potential resistance zones. These are areas where price is likely to retrace before continuing downward.
2. Set Up Your Trade
Entry: Place a limit order at the retracement zone (inside the FVG box). This ensures you enter the trade when the price retraces into the imbalance.
Stop-Loss (SL): Place your stop-loss just below the FVG box for bullish trades or just above the FVG box for bearish trades. The tool provides a suggested SL level.
Take-Profit (TP): Set your take-profit level at a 2:1 risk-reward ratio (or higher). The tool provides a suggested target level.
3. Let the Trade Run
Once your trade is set up, let it play out. Avoid micromanaging the trade unless market conditions change drastically.
Step-by-Step Example
Bullish FVG Trade
Identify the FVG:
A green box appears, indicating a bullish FVG.
The tool provides the target price (e.g., 0.6371) and the stop-loss level (e.g., 0.6339).
Set Up the Trade:
Place a limit buy order at the retracement zone (inside the green box).
Set your stop-loss just below the FVG box (e.g., 0.6339).
Set your take-profit at a 2:1 risk-reward ratio or the suggested target (e.g., 0.6371).
Monitor the Trade:
Wait for the price to retrace into the FVG zone and trigger your limit order.
Let the trade run until it hits the take-profit or stop-loss.
Bearish FVG Trade
Identify the FVG:
A red box appears, indicating a bearish FVG.
The tool provides the target price and the stop-loss level.
Set Up the Trade:
Place a limit sell order at the retracement zone (inside the red box).
Set your stop-loss just above the FVG box.
Set your take-profit at a 2:1 risk-reward ratio or the suggested target.
Monitor the Trade:
Wait for the price to retrace into the FVG zone and trigger your limit order.
Let the trade run until it hits the take-profit or stop-loss.
Key Features of the Tool in Action
Visual Clarity:
The green and red boxes clearly show the FVG zones, making it easy to identify potential trade setups.
Labels provide the target price and stop-loss level for quick decision-making.
Risk-Reward Management:
The tool encourages disciplined trading by providing predefined SL and TP levels.
A 2:1 risk-reward ratio ensures that profitable trades outweigh losses.
Hands-Off Execution:
By placing limit orders, you can let the trade execute automatically without needing to monitor the market constantly.
Best Practices
Trade in the Direction of the Trend:
Use higher timeframes (e.g., 4-hour or daily) to identify the overall trend.
Focus on bullish FVGs in an uptrend and bearish FVGs in a downtrend.
Combine with Confirmation Signals:
Look for additional confirmation, such as candlestick patterns (e.g., engulfing candles) or indicator signals (e.g., RSI, MACD).
Adjust Parameters for Volatility:
For highly volatile markets, consider increasing the stop-loss percentage to avoid being stopped out prematurely.
Avoid Overtrading:
Not every FVG is a good trading opportunity. Be selective and only trade setups that align with your strategy.
Backtest and Optimize:
Use historical data to test the tool and refine your approach before trading live.
Common Mistakes to Avoid
Entering Without Confirmation:
Wait for price to retrace into the FVG zone before entering a trade.
Avoid chasing trades that have already moved away from the zone.
Ignoring Risk Management:
Always use a stop-loss to protect your account.
Stick to a consistent risk-reward ratio.
Trading Against the Trend:
Avoid taking trades that go against the prevailing market trend unless there is strong evidence of a reversal.
Final Thoughts
The FVG Visual Trading Tool is a powerful aid for identifying high-probability trade setups. By following the steps outlined above, you can use the tool to trade with confidence and discipline. Remember, no tool guarantees success, so always combine it with sound trading principles and proper risk management

Nirmal Fair Value GapsICT Fair Value Gaps
Trade Wisely
How a Fair Value Gap Works
Formation:
A Fair Value Gap occurs when a strong price movement (usually from institutional orders) creates an imbalance between buyers and sellers.
This is typically seen in a three-candle pattern, where the middle candle has a large body, and the two surrounding candles have wicks but little overlap with the middle candle’s range.
Identification:
The FVG is marked between the high of the first candle and the low of the third candle (for bullish gaps).
For bearish gaps, it’s the low of the first candle and the high of the third candle.
Market Behavior Around FVG:
Price often retraces into the gap before resuming its original direction.
This happens because the market seeks to "fill" the imbalance where few trades occurred.
Traders use FVGs as potential entry zones for trend continuation trades.
Trading Fair Value Gaps
In an Uptrend:
Look for bullish fair value gaps as potential support zones for buy entries.
Price may dip into the gap and then continue upward.
In a Downtrend:
Look for bearish fair value gaps as potential resistance zones for sell entries.
Price may retrace into the gap and then drop further.
Confluence Factors:
FVGs work best when combined with other strategies like order blocks, liquidity zones, or key Fibonacci levels.

Cluster Reversal Zones📌 Cluster Reversal Zones – Smart Market Turning Point Detector
📌 Category : Public (Restricted/Closed-Source) Indicator
📌 Designed for : Traders looking for high-accuracy reversal zones based on price clustering & liquidity shifts.
🔍 Overview
The Cluster Reversal Zones Indicator is an advanced market reversal detection tool that helps traders identify key turning points using a combination of price clustering, order flow analysis, and liquidity tracking. Instead of relying on static support and resistance levels, this tool dynamically adjusts to live market conditions, ensuring traders get the most accurate reversal signals possible.
📊 Core Features:
✅ Real-Time Reversal Zone Mapping – Detects high-probability market turning points using price clustering & order flow imbalance.
✅ Liquidity-Based Support/Resistance Detection – Identifies strong rejection zones based on real-time liquidity shifts.
✅ Order Flow Sensitivity for Smart Filtering – Filters out weak reversals by detecting real market participation behind price movements.
✅ Momentum Divergence for Confirmation – Aligns reversal zones with momentum divergences to increase accuracy.
✅ Adaptive Risk Management System – Adjusts risk parameters dynamically based on volatility and trend state.
🔒 Justification for Mashup
The Cluster Reversal Zones Indicator contains custom-built methodologies that extend beyond traditional support/resistance indicators:
✔ Smart Price Clustering Algorithm: Instead of plotting fixed support/resistance lines, this system analyzes historical price clustering to detect active reversal areas.
✔ Order Flow Delta & Liquidity Shift Sensitivity: The tool tracks real-time order flow data, identifying price zones with the highest accumulation or distribution levels.
✔ Momentum-Based Reversal Validation: Unlike traditional indicators, this tool requires a momentum shift confirmation before validating a potential reversal.
✔ Adaptive Reversal Filtering Mechanism: Uses a combination of historical confluence detection + live market validation to improve accuracy.
🛠️ How to Use:
• Works well for reversal traders, scalpers, and swing traders seeking precise turning points.
• Best combined with VWAP, Market Profile, and Delta Volume indicators for confirmation.
• Suitable for Forex, Indices, Commodities, Crypto, and Stock markets.
🚨 Important Note:
For educational & analytical purposes only.

MMXM ICT [TradingFinder] Market Maker Model PO3 CHoCH/CSID + FVG🔵 Introduction
The MMXM Smart Money Reversal leverages key metrics such as SMT Divergence, Liquidity Sweep, HTF PD Array, Market Structure Shift (MSS) or (ChoCh), CISD, and Fair Value Gap (FVG) to identify critical turning points in the market. Designed for traders aiming to analyze the behavior of major market participants, this setup pinpoints strategic areas for making informed trading decisions.
The document introduces the MMXM model, a trading strategy that identifies market maker activity to predict price movements. The model operates across five distinct stages: original consolidation, price run, smart money reversal, accumulation/distribution, and completion. This systematic approach allows traders to differentiate between buyside and sellside curves, offering a structured framework for interpreting price action.
Market makers play a pivotal role in facilitating these movements by bridging liquidity gaps. They continuously quote bid (buy) and ask (sell) prices for assets, ensuring smooth trading conditions.
By maintaining liquidity, market makers prevent scenarios where buyers are left without sellers and vice versa, making their activity a cornerstone of the MMXM strategy.
SMT Divergence serves as the first signal of a potential trend reversal, arising from discrepancies between the movements of related assets or indices. This divergence is detected when two or more highly correlated assets or indices move in opposite directions, signaling a likely shift in market trends.
Liquidity Sweep occurs when the market targets liquidity in specific zones through false price movements. This process allows major market participants to execute their orders efficiently by collecting the necessary liquidity to enter or exit positions.
The HTF PD Array refers to premium and discount zones on higher timeframes. These zones highlight price levels where the market is in a premium (ideal for selling) or discount (ideal for buying). These areas are identified based on higher timeframe market behavior and guide traders toward lucrative opportunities.
Market Structure Shift (MSS), also referred to as ChoCh, indicates a change in market structure, often marked by breaking key support or resistance levels. This shift confirms the directional movement of the market, signaling the start of a new trend.
CISD (Change in State of Delivery) reflects a transition in price delivery mechanisms. Typically occurring after MSS, CISD confirms the continuation of price movement in the new direction.
Fair Value Gap (FVG) represents zones where price imbalance exists between buyers and sellers. These gaps often act as price targets for filling, offering traders opportunities for entry or exit.
By combining all these metrics, the Smart Money Reversal provides a comprehensive tool for analyzing market behavior and identifying key trading opportunities. It enables traders to anticipate the actions of major players and align their strategies accordingly.
MMBM :
MMSM :
🔵 How to Use
The Smart Money Reversal operates in two primary states: MMBM (Market Maker Buy Model) and MMSM (Market Maker Sell Model). Each state highlights critical structural changes in market trends, focusing on liquidity behavior and price reactions at key levels to offer precise and effective trading opportunities.
The MMXM model expands on this by identifying five distinct stages of market behavior: original consolidation, price run, smart money reversal, accumulation/distribution, and completion. These stages provide traders with a detailed roadmap for interpreting price action and anticipating market maker activity.
🟣 Market Maker Buy Model
In the MMBM state, the market transitions from a bearish trend to a bullish trend. Initially, SMT Divergence between related assets or indices reveals weaknesses in the bearish trend. Subsequently, a Liquidity Sweep collects liquidity from lower levels through false breakouts.
After this, the price reacts to discount zones identified in the HTF PD Array, where major market participants often execute buy orders. The market confirms the bullish trend with a Market Structure Shift (MSS) and a change in price delivery state (CISD). During this phase, an FVG emerges as a key trading opportunity. Traders can open long positions upon a pullback to this FVG zone, capitalizing on the bullish continuation.
🟣 Market Maker Sell Model
In the MMSM state, the market shifts from a bullish trend to a bearish trend. Here, SMT Divergence highlights weaknesses in the bullish trend. A Liquidity Sweep then gathers liquidity from higher levels.
The price reacts to premium zones identified in the HTF PD Array, where major sellers enter the market and reverse the price direction. A Market Structure Shift (MSS) and a change in delivery state (CISD) confirm the bearish trend. The FVG then acts as a target for the price. Traders can initiate short positions upon a pullback to this FVG zone, profiting from the bearish continuation.
Market makers actively bridge liquidity gaps throughout these stages, quoting continuous bid and ask prices for assets. This ensures that trades are executed seamlessly, even during periods of low market participation, and supports the structured progression of the MMXM model.
The price’s reaction to FVG zones in both states provides traders with opportunities to reduce risk and enhance precision. These pullbacks to FVG zones not only represent optimal entry points but also create avenues for maximizing returns with minimal risk.
🔵 Settings
Higher TimeFrame PD Array : Selects the timeframe for identifying premium/discount arrays on higher timeframes.
PD Array Period : Specifies the number of candles for identifying key swing points.
ATR Coefficient Threshold : Defines the threshold for acceptable volatility based on ATR.
Max Swing Back Method : Choose between analyzing all swings ("All") or a fixed number ("Custom").
Max Swing Back : Sets the maximum number of candles to consider for swing analysis (if "Custom" is selected).
Second Symbol for SMT : Specifies the second asset or index for detecting SMT divergence.
SMT Fractal Periods : Sets the number of candles required to identify SMT fractals.
FVG Validity Period : Defines the validity duration for FVG zones.
MSS Validity Period : Sets the validity duration for MSS zones.
FVG Filter : Activates filtering for FVG zones based on width.
FVG Filter Type : Selects the filtering level from "Very Aggressive" to "Very Defensive."
Mitigation Level FVG : Determines the level within the FVG zone (proximal, 50%, or distal) that price reacts to.
Demand FVG : Enables the display of demand FVG zones.
Supply FVG : Enables the display of supply FVG zones.
Zone Colors : Allows customization of colors for demand and supply FVG zones.
Bottom Line & Label : Enables or disables the SMT divergence line and label from the bottom.
Top Line & Label : Enables or disables the SMT divergence line and label from the top.
Show All HTF Levels : Displays all premium/discount levels on higher timeframes.
High/Low Levels : Activates the display of high/low levels.
Color Options : Customizes the colors for high/low lines and labels.
Show All MSS Levels : Enables display of all MSS zones.
High/Low MSS Levels : Activates the display of high/low MSS levels.
Color Options : Customizes the colors for MSS lines and labels.
🔵 Conclusion
The Smart Money Reversal model represents one of the most advanced tools for technical analysis, enabling traders to identify critical market turning points. By leveraging metrics such as SMT Divergence, Liquidity Sweep, HTF PD Array, MSS, CISD, and FVG, traders can predict future price movements with precision.
The price’s interaction with key zones such as PD Array and FVG, combined with pullbacks to imbalance areas, offers exceptional opportunities with favorable risk-to-reward ratios. This approach empowers traders to analyze the behavior of major market participants and adopt professional strategies for entry and exit.
By employing this analytical framework, traders can reduce errors, make more informed decisions, and capitalize on profitable opportunities. The Smart Money Reversal focuses on liquidity behavior and structural changes, making it an indispensable tool for financial market success.

FVG Breakout/BreakdownThe FVG Breakout/Breakdown indicator is designed to identify potential breakout and breakdown opportunities in the market, based on the concept of Fair Value Gaps (FVGs). FVGs are areas where price moves too quickly, leaving behind gaps between candlesticks, often seen as areas of inefficiency or imbalance that the market tends to revisit.
Key Concepts:
Fair Value Gaps (FVG):
FVG occurs when a price gap is created between candlesticks, typically when the high of one candle is lower than the low of the previous candle (for a bearish FVG) or the low of one candle is higher than the high of the previous candle (for a bullish FVG).
These gaps represent an imbalance between buying and selling pressure, and the market often revisits them, making them valuable for identifying potential entry points.
Bullish FVG: This occurs when the low of the current candle is higher than the high of the previous candle.
Condition: low > high
Bearish FVG: This occurs when the high of the current candle is lower than the low of the previous candle.
Condition: high < low
Breakout/Breakdown Signals:
Breakout: A bullish breakout signal occurs when the price breaks above a defined resistance level after an FVG gap. This suggests that the market may continue moving higher.
Breakdown: A bearish breakdown signal occurs when the price breaks below a defined support level after an FVG gap. This suggests that the market may continue moving lower.
NWOG (New Week Opening Gap):
The NWOG can be used as an additional factor to confirm the FVG signal. The gap between Friday's close and Monday's open is a crucial level for identifying the start of a new move for the week.
NWOG helps to further refine the timing of breakout or breakdown signals, only triggering them when price moves relative to the Monday Open and shows a new direction.
MktCumTickThis script is a market sentiment indicator that calculates the cumulative TICK (Trade Imbalance Sentiment) for four major markets: NYSE (New York Stock Exchange), NASDAQ (National Association of Securities Dealers Automated Quotations), Dow Jones, and AMEX (American Stock Exchange).
Here's a breakdown of the script:
1. Market data requests: The script requests data for the four markets, including:
- TICK (Trade Imbalance Sentiment) data
- HLC3 (High, Low, Close) data
- ADVN (Advancing issues), DECL (Declining issues), and UNCH (Unchanged issues) data
2. Cumulative TICK calculation: The script calculates the cumulative TICK for each market by dividing the TICK data by the maximum TICK value for each market.
3. Plotting: The script plots the cumulative TICK values for each market as separate lines on the chart.
4. Background color: The script changes the background color of the chart based on the cumulative TICK values. If all four markets have decreasing cumulative TICK values, the background color turns red. If all four markets have increasing cumulative TICK values, the background color turns green.
The purpose of this indicator is to provide a visual representation of market sentiment across multiple markets. By analyzing the cumulative TICK values, traders can gain insights into market trends and make more informed trading decisions.
Some possible uses of this indicator include:
- Identifying market trends and sentiment
- Confirming trade entries and exits
- Monitoring market conditions and adjusting trading strategies accordingly

ICT Setup 03 [TradingFinder] Judas Swing NY 9:30am + CHoCH/FVG🔵 Introduction
Judas Swing is an advanced trading setup designed to identify false price movements early in the trading day. This advanced trading strategy operates on the principle that major market players, or "smart money," drive price in a certain direction during the early hours to mislead smaller traders.
This deceptive movement attracts liquidity at specific levels, allowing larger players to execute primary trades in the opposite direction, ultimately causing the price to return to its true path.
The Judas Swing setup functions within two primary time frames, tailored separately for Forex and Stock markets. In the Forex market, the setup uses the 8:15 to 8:30 AM window to identify the high and low points, followed by the 8:30 to 8:45 AM frame to execute the Judas move and identify the CISD Level break, where Order Block and Fair Value Gap (FVG) zones are subsequently detected.
In the Stock market, these time frames shift to 9:15 to 9:30 AM for identifying highs and lows and 9:30 to 9:45 AM for executing the Judas move and CISD Level break.
Concepts such as Order Block and Fair Value Gap (FVG) are crucial in this setup. An Order Block represents a chart region with a high volume of buy or sell orders placed by major financial institutions, marking significant levels where price reacts.
Fair Value Gap (FVG) refers to areas where price has moved rapidly without balance between supply and demand, highlighting zones of potential price action and future liquidity.
Bullish Setup :
Bearish Setup :
🔵 How to Use
The Judas Swing setup enables traders to pinpoint entry and exit points by utilizing Order Block and FVG concepts, helping them align with liquidity-driven moves orchestrated by smart money. This setup applies two distinct time frames for Forex and Stocks to capture early deceptive movements, offering traders optimized entry or exit moments.
🟣 Bullish Setup
In the Bullish Judas Swing setup, the first step is to identify High and Low points within the initial time frame. These levels serve as key points where price may react, forming the basis for analyzing the setup and assisting traders in anticipating future market shifts.
In the second time frame, a critical stage of the bullish setup begins. During this phase, the price may create a false break or Fake Break below the low level, a deceptive move by major players to absorb liquidity. This false move often causes smaller traders to enter positions incorrectly. After this fake-out, the price reverses upward, breaking the CISD Level, a critical point in the market structure, signaling a potential bullish trend.
Upon breaking the CISD Level and reversing upward, the indicator identifies both the Order Block and Fair Value Gap (FVG). The Order Block is an area where major players typically place large buy orders, signaling potential price support. Meanwhile, the FVG marks a region of supply-demand imbalance, signaling areas where price might react.
Ultimately, after these key zones are identified, a trader may open a buy position if the price reaches one of these critical areas—Order Block or FVG—and reacts positively. Trading at these levels enhances the chance of success due to liquidity absorption and support from smart money, marking an opportune time for entering a long position.
🟣 Bearish Setup
In the Bearish Judas Swing setup, analysis begins with marking the High and Low levels in the initial time frame. These levels serve as key zones where price could react, helping to signal possible trend reversals. Identifying these levels is essential for locating significant bearish zones and positioning traders to capitalize on downward movements.
In the second time frame, the primary bearish setup unfolds. During this stage, price may exhibit a Fake Break above the high, causing a brief move upward and misleading smaller traders into incorrect positions. After this false move, the price typically returns downward, breaking the CISD Level—a crucial bearish trend indicator.
With the CISD Level broken and a bearish trend confirmed, the indicator identifies the Order Block and Fair Value Gap (FVG). The Bearish Order Block is a region where smart money places significant sell orders, prompting a negative price reaction. The FVG denotes an area of supply-demand imbalance, signifying potential selling pressure.
When the price reaches one of these critical areas—the Bearish Order Block or FVG—and reacts downward, a trader may initiate a sell position. Entering trades at these levels, due to increased selling pressure and liquidity absorption, offers traders an advantage in profiting from price declines.
🔵 Settings
Market : The indicator allows users to choose between Forex and Stocks, automatically adjusting the time frames for the "Opening Range" and "Trading Permit" accordingly: Forex: 8:15–8:30 AM for identifying High and Low points, and 8:30–8:45 AM for capturing the Judas move and CISD Level break. Stocks: 9:15–9:30 AM for identifying High and Low points, and 9:30–9:45 AM for executing the Judas move and CISD Level break.
Refine Order Block : Enables finer adjustments to Order Block levels for more accurate price responses.
Mitigation Level OB : Allows users to set specific reaction points within an Order Block, including: Proximal: Closest level to the current price. 50% OB: Midpoint of the Order Block. Distal: Farthest level from the current price.
FVG Filter : The Judas Swing indicator includes a filter for Fair Value Gap (FVG), allowing different filtering based on FVG width: FVG Filter Type: Can be set to "Very Aggressive," "Aggressive," "Defensive," or "Very Defensive." Higher defensiveness narrows the FVG width, focusing on narrower gaps.
Mitigation Level FVG : Like the Order Block, you can set price reaction levels for FVG with options such as Proximal, 50% OB, and Distal.
CISD : The Bar Back Check option enables traders to specify the number of past candles checked for identifying the CISD Level, enhancing CISD Level accuracy on the chart.
🔵 Conclusion
The Judas Swing indicator helps traders spot reliable trading opportunities by detecting false price movements and key levels such as Order Block and FVG. With a focus on early market movements, this tool allows traders to align with major market participants, selecting entry and exit points with greater precision, thereby reducing trading risks.
Its extensive customization options enable adjustments for various market types and trading conditions, giving traders the flexibility to optimize their strategies. Based on ICT techniques and liquidity analysis, this indicator can be highly effective for those seeking precision in their entry points.
Overall, Judas Swing empowers traders to capitalize on significant market movements by leveraging price volatility. Offering precise and dependable signals, this tool presents an excellent opportunity for enhancing trading accuracy and improving performance

Balance of Power [SYNC & TRADE]Balance of Power
Overview
This indicator analyzes the balance of power between buyers and sellers in the market. It uses volume, price action and the relative strength index (RSI) to determine the strength of buyers and sellers, as well as to identify potential zones where one side dominates the other.
How it works
The indicator calculates the average volume over a specified period.
It determines the strength of each bar, taking into account volume and price action.
RSI is used as an additional factor to assess the strength of the trend.
Based on these factors, the "balance of power" between buyers and sellers is calculated.
When the balance of power exceeds a specified threshold, the indicator marks the beginning of the "buyer zone" or "seller zone".
How to use
Add the indicator to your chart in TradingView.
Configure the input parameters:
"Period for average volume": determines the sensitivity to volume changes.
"RSI period": affects the sensitivity of the RSI to price changes.
"Strength threshold": sets the level for determining a significant imbalance.
"Table Size": select the appropriate size of the information table.
Observe the signals on the chart:
Blue triangle up: the beginning of the buyer zone.
Red triangle down: the beginning of the seller zone.
Use the information table to get additional data:
Current balance of power
Buyers or sellers have strength
Current RSI value
Advantages
Comprehensive analysis of market conditions
Visual signals for potential entry points
Customizable parameters to adapt to different trading styles
Informative table for quick analysis of the current situation
Limitations
Like any indicator, it can give false signals
Requires additional analysis and confirmation with other tools
Efficiency may vary depending on market conditions
Recommendations
Use this indicator in combination with other analysis methods to make trading decisions. Experiment with the settings to optimize for your trading style and selected assets.
Balance of Power Ru
Обзор
Этот индикатор анализирует баланс сил между покупателями и продавцами на рынке. Он использует объем, ценовое движение и индекс относительной силы (RSI) для определения силы покупателей и продавцов, а также для выявления потенциальных зон, где одна сторона доминирует над другой.
Как это работает
Индикатор рассчитывает среднее значение объема за указанный период.
Он определяет силу каждого бара, учитывая объем и ценовое движение.
RSI используется как дополнительный фактор для оценки силы тренда.
На основе этих факторов вычисляется "баланс сил" между покупателями и продавцами.
Когда баланс сил превышает заданный порог, индикатор отмечает начало "зоны покупателей" или "зоны продавцов".
Как использовать
Добавьте индикатор на ваш график в TradingView.
Настройте входные параметры:
"Период для среднего объема": определяет чувствительность к изменениям объема.
"Период RSI": влияет на чувствительность RSI к ценовым изменениям.
"Порог силы": устанавливает уровень для определения значимого дисбаланса.
"Размер таблицы": выберите подходящий размер информационной таблицы.
Наблюдайте за сигналами на графике:
Синий треугольник вверх: начало зоны покупателей.
Красный треугольник вниз: начало зоны продавцов.
Используйте информационную таблицу для получения дополнительных данных:
Текущий баланс сил
Наличие силы у покупателей или продавцов
Текущее значение RSI
Преимущества
Комплексный анализ рыночных условий
Визуальные сигналы для потенциальных точек входа
Настраиваемые параметры для адаптации к разным торговым стилям
Информативная таблица для быстрого анализа текущей ситуации
Ограничения
Как и любой индикатор, может давать ложные сигналы
Требует дополнительного анализа и подтверждения другими инструментами
Эффективность может варьироваться в зависимости от рыночных условий
Рекомендации
Используйте этот индикатор в сочетании с другими методами анализа для принятия торговых решений. Экспериментируйте с настройками для оптимизации под ваш торговый стиль и выбранные активы.

Bitcoin Power Law Oscillator [InvestorUnknown]The Bitcoin Power Law Oscillator is a specialized tool designed for long-term mean-reversion analysis of Bitcoin's price relative to a theoretical midline derived from the Bitcoin Power Law model (made by capriole_charles). This oscillator helps investors identify whether Bitcoin is currently overbought, oversold, or near its fair value according to this mathematical model.
Key Features:
Power Law Model Integration: The oscillator is based on the midline of the Bitcoin Power Law, which is calculated using regression coefficients (A and B) applied to the logarithm of the number of days since Bitcoin’s inception. This midline represents a theoretical fair value for Bitcoin over time.
Midline Distance Calculation: The distance between Bitcoin’s current price and the Power Law midline is computed as a percentage, indicating how far above or below the price is from this theoretical value.
float a = input.float (-16.98212206, 'Regression Coef. A', group = "Power Law Settings")
float b = input.float (5.83430649, 'Regression Coef. B', group = "Power Law Settings")
normalization_start_date = timestamp(2011,1,1)
calculation_start_date = time == timestamp(2010, 7, 19, 0, 0) // First BLX Bitcoin Date
int days_since = request.security('BNC:BLX', 'D', ta.barssince(calculation_start_date))
bar() =>
= request.security('BNC:BLX', 'D', bar())
int offset = 564 // days between 2009/1/1 and "calculation_start_date"
int days = days_since + offset
float e = a + b * math.log10(days)
float y = math.pow(10, e)
float midline_distance = math.round((y / btc_close - 1.0) * 100)
Oscillator Normalization: The raw distance is converted into a normalized oscillator, which fluctuates between -1 and 1. This normalization adjusts the oscillator to account for historical extremes, making it easier to compare current conditions with past market behavior.
float oscillator = -midline_distance
var float min = na
var float max = na
if (oscillator > max or na(max)) and time >= normalization_start_date
max := oscillator
if (min > oscillator or na(min)) and time >= normalization_start_date
min := oscillator
rescale(float value, float min, float max) =>
(2 * (value - min) / (max - min)) - 1
normalized_oscillator = rescale(oscillator, min, max)
Overbought/Oversold Identification: The oscillator provides a clear visual representation, where values near 1 suggest Bitcoin is overbought, and values near -1 indicate it is oversold. This can help identify potential reversal points or areas of significant market imbalance.
Optional Moving Average: Users can overlay a moving average (either SMA or EMA) on the oscillator to smooth out short-term fluctuations and focus on longer-term trends. This is particularly useful for confirming trend reversals or persistent overbought/oversold conditions.
This indicator is particularly useful for long-term Bitcoin investors who wish to gauge the market's mean-reversion tendencies based on a well-established theoretical model. By focusing on the Power Law’s midline, users can gain insights into whether Bitcoin’s current price deviates significantly from what historical trends would suggest as a fair value.

Buyside & Sellside Liquidity [LuxAlgo]The Buyside & Sellside Liquidity indicator aims to detect & highlight the first and arguably most important concept within the ICT trading methodology, Liquidity levels.
🔶 SETTINGS
🔹 Liquidity Levels
Detection Length: Lookback period
Margin: Sets margin/sensitivity for a liquidity level detection
🔹 Liquidity Zones
Buyside Liquidity Zones: Enables display of the buyside liquidity zones.
Margin: Sets margin/sensitivity for the liquidity zone boundaries.
Color: Color option for buyside liquidity levels & zones.
Sellside Liquidity Zones: Enables display of the sellside liquidity zones.
Margin: Sets margin/sensitivity for the liquidity zone boundaries.
Color: Color option for sellside liquidity levels & zones.
🔹 Liquidity Voids
Liquidity Voids: Enables display of both bullish and bearish liquidity voids.
Label: Enables display of a label indicating liquidity voids.
🔹 Display Options
Mode: Controls the lookback length of detection and visualization, where Present assumes last 500 bars and Historical assumes all data available to the user
# Visible Levels: Controls the amount of the liquidity levels/zones to be visualized.
🔶 USAGE
Definitions of Liquidity refer to the availability of orders at specific price levels in the market, allowing transactions to occur smoothly.
In the context of Inner Circle Trader's teachings, liquidity mainly relates to stop losses or pending orders and liquidity level/pool, highlighting a concentration of buy or sell orders at specific price levels. Smart money traders, such as banks and other large institutions, often target these liquidity levels/pools to accumulate or distribute their positions.
There are two types of liquidity; Buyside liquidity and Sellside liquidity .
Buyside liquidity represents a level on the chart where short sellers will have their stops positioned, and Sellside liquidity represents a level on the chart where long-biased traders will place their stops.
These areas often act as support or resistance levels and can provide trading opportunities.
When the liquidity levels are breached at which many stop/limit orders are placed have been traded through, the script will create a zone aiming to provide additional insight to figure out the odds of the next price action.
Reversal: It’s common that the price may reverse course and head in the opposite direction, seeking liquidity at the opposite extreme.
Continuation: When the zone is also broken it is a sign for continuation price action.
It's worth noting that ICT concepts are specific to the methodology developed by Michael J. Huddleston and may not align with other trading approaches or strategies.
🔶 DETAILS
Liquidity voids are sudden changes in price when the price jumps from one level to another. Liquidity voids will appear as a single or a group of candles that are all positioned in the same direction. These candles typically have large real bodies and very short wicks, suggesting very little disagreement between buyers and sellers. The peculiar thing about liquidity voids is that they almost always fill up.
🔶 ALERTS
When an alert is configured, the user will have the ability to be notified in case;
Liquidity level is detected/updated.
Liquidity level is breached.
🔶 RELATED SCRIPTS
ICT-Concepts
ICT-Macros
Imbalance-Detector

Market Structure & Liquidity: CHoCHs+Nested Pivots+FVGs+Sweeps//Purpose:
This indicator combines several tools to help traders track and interpret price action/market structure; It can be divided into 4 parts;
1. CHoCHs, 2. Nested Pivot highs & lows, 3. Grade sweeps, 4. FVGs.
This gives the trader a toolkit for determining market structure and shifts in market structure to help determine a bull or bear bias, whether it be short-term, med-term or long-term.
This indicator also helps traders in determining liquidity targets: wether they be voids/gaps (FVGS) or old highs/lows+ typical sweep distances.
Finally, the incorporation of HTF CHoCH levels printing on your LTF chart helps keep the bigger picture in mind and tells traders at a glance if they're above of below Custom HTF CHoCH up or CHoCH down (these HTF CHoCHs can be anything from Hourly up to Monthly).
//Nomenclature:
CHoCH = Change of Character
STH/STL = short-term high or low
MTH/MTL = medium-term high or low
LTH/LTL = long-term high or low
FVG = Fair value gap
CE = consequent encroachement (the midline of a FVG)
~~~ The Four components of this indicator ~~~
1. CHoCHs:
•Best demonstrated in the below charts. This was a method taught to me by @Icecold_crypto. Once a 3 bar fractal pivot gets broken, we count backwards the consecutive higher lows or lower highs, then identify the CHoCH as the opposite end of the candle which ended the consecutive backwards count. This CHoCH (UP or DOWN) then becomes a level to watch, if price passes through it in earnest a trader would consider shifting their bias as market structure is deemed to have shifted.
•HTF CHoCHs: Option to print Higher time frame chochs (default on) of user input HTF. This prints only the last UP choch and only the last DOWN choch from the input HTF. Solid line by default so as to distinguish from local/chart-time CHoCHs. Can be any Higher timeframe you like.
•Show on table: toggle on show table(above/below) option to show in table cells (top right): is price above the latest HTF UP choch, or is price below HTF DOWN choch (or is it sat between the two, in a state of 'uncertainty').
•Most recent CHoCHs which have not been met by price will extend 10 bars into the future.
• USER INPUTS: overall setting: SHOW CHOCHS | Set bars lookback number to limit historical Chochs. Set Live CHoCHs number to control the number of active recent chochs unmet by price. Toggle shrink chochs once hit to declutter chart and minimize old chochs to their origin bars. Set Multi-timeframe color override : to make Color choices auto-set to your preference color for each of 1m, 5m, 15m, H, 4H, D, W, M (where up and down are same color, but 'up' icon for up chochs and down icon for down chochs remain printing as normal)
2. Nested Pivot Highs & Lows; aka 'Pivot Highs & Lows (ST/MT/LT)'
•Based on a seperate, longer lookback/lookforward pivot calculation. Identifies Pivot highs and lows with a 'spikeyness' filter (filtering out weak/rounded/unimpressive Pivot highs/lows)
•by 'nested' I mean that the pivot highs are graded based on whether a pivot high sits between two lower pivot highs or vice versa.
--for example: STH = normal pivot. MTH is pivot high with a lower STH on either side. LTH is a pivot high with a lower MTH on either side. Same applies to pivot lows (STL/MTL/LTL)
•This is a useful way to measure the significance of a high or low. Both in terms of how much it might be typically swept by (see later) and what it would imply for HTF bias were we to break through it in earnest (more than just a sweep).
• USER INPUTS: overall setting: show pivot highs & lows | Bars lookback (historical pivots to show) | Pivots: lookback/lookforward length (determines the scale of your pivot highs/lows) | toggle on/off Apply 'Spikeyness' filter (filters out smooth/unimpressive pivot highs/lows). Set Spikeyness index (determines the strength of this filter if turned on) | Individually toggle on each of STH, MTH, LTH, STL, MTL, LTL along with their label text type , and size . Toggle on/off line for each of these Pivot highs/lows. | Set label spacer (atr multiples above / below) | set line style and line width
3. Grade Sweeps:
•These are directly related to the nested pivots described above. Most assets will have a typical sweep distance. I've added some of my expected sweeps for various assets in the indicator tooltips.
--i.e. Eur/Usd 10-20-30 pips is a typical 'grade' sweep. S&P HKEX:5 - HKEX:10 is a typical grade sweep.
•Each of the ST/MT/LT pivot highs and lows have optional user defined grade sweep boxes which paint above until filled (or user option for historical filled boxes to remain).
•Numbers entered into sweep input boxes are auto converted into appropriate units (i.e. pips for FX, $ or 'handles' for indices, $ for Crypto. Very low $ units can be input for low unit value crypto altcoins.
• USER INPUTS: overall setting: Show sweep boxes | individually select colors of each of STH, MTH, LTH, STL, MTL, LTL sweep boxes. | Set Grade sweep ($/pips) number for each of ST, MT, LT. This auto converts between pips and $ (i.e. FX vs Indices/Crypto). Can be a float as small or large as you like ($0.000001 to HKEX:1000 ). | Set box text position (horizontal & vertical) and size , and color . | Set Box width (bars) (for non extended/ non-auto-terminating at price boxes). | toggle on/off Extend boxes/lines right . | Toggle on/off Shrink Grade sweeps on fill (they will disappear in realtime when filled/passed through)
4. FVGs:
•Fair Value gaps. Represent 'naked' candle bodies where the wicks to either side do not meet, forming a 'gap' of sorts which has a tendency to fill, or at least to fill to midline (CE).
•These are ICT concepts. 'UP' FVGS are known as BISIs (Buyside imbalance, sellside inefficiency); 'DOWN' FVGs are known as SIBIs (Sellside imbalance, buyside inefficiency).
• USER INPUTS: overall setting: show FVGs | Bars lookback (history). | Choose to display: 'UP' FVGs (BISI) and/or 'DOWN FVGs (SIBI) . Choose to display the midline: CE , the color and the line style . Choose threshold: use CE (as opposed to Full Fill) |toggle on/off Shrink FVG on fill (CE hit or Full fill) (declutter chart/see backtesting history)
////••Alerts (general notes & cautionary notes)::
•Alerts are optional for most of the levels printed by this indicator. Set them via the three dots on indicator status line.
•Due to dynamic repainting of levels, alerts should be used with caution. Best use these alerts either for Higher time frame levels, or when closely monitoring price.
--E.g. You may set an alert for down-fill of the latest FVG below; but price will keep marching up; form a newer/higher FVG, and the alert will trigger on THAT FVG being down-filled (not the original)
•Available Alerts:
-FVG(BISI) cross above threshold(CE or full-fill; user choice). Same with FVG(SIBI).
-HTF last CHoCH down, cross below | HTF last CHoCH up, cross above.
-last CHoCH down, cross below | last CHoCH up, cross above.
-LTH cross above, MTH cross above, STH cross above | LTL cross below, MTL cross below, STL cross below.
////••Formatting (general)::
•all table text color is set from the 'Pivot highs & Lows (ST, MT, LT)' section (for those of you who prefer black backgrounds).
•User choice of Line-style, line color, line width. Same with Boxes. Icon choice for chochs. Char or label text choices for ST/MT/LT pivot highs & lows.
////••User Inputs (general):
•Each of the 4 components of this indicator can be easily toggled on/off independently.
•Quite a lot of options and toggle boxes, as described in full above. Please take your time and read through all the tooltips (hover over '!' icon) to get an idea of formatting options.
•Several Lookback periods defined in bars to control how much history is shown for each of the 4 components of this indicator.
•'Shrink on fill' settings on FVGs and CHoCHs: Basically a way to declutter chart; toggle on/off depending on if you're backtesting or reading live price action.
•Table Display: applies to ST/MT/LT pivot highs and to HTF CHoCHs; Toggle table on or off (in part or in full)
////••Credits:
•Credit to ICT (Inner Circle Trader) for some of the concepts used in this indicator (FVGS & CEs; Grade sweeps).
•Credit to @Icecold_crypto for the specific and novel concept of identifying CHoCHs in a simple, objective and effective manner (as demonstrated in the 1st chart below).
CHoCH demo page 1: shifting tweak; arrow diagrams to demonstrate how CHoCHs are defined:
CHoCH demo page 2: Simplified view; short lookback history; few CHoCHs, demo of 'latest' choch being extended into the future by 10 bars:
USAGE: Bitcoin Hourly using HTF daily CHoCHs:
USAGE-2: Cotton Futures (CT1!) 2hr. Painting a rather bullish picture. Above HTF UP CHoCH, Local CHoCHs show bullish order flow, Nice targets above (MTH/LTH + grade sweeps):
Full Demo; 5min chart; CHoCHs, Short term pivot highs/lows, grade sweeps, FVGs:
Full Demo, Eur/Usd 15m: STH, MTH, LTH grade sweeps, CHoCHs, Usage for finding bias (part A):
Full Demo, Eur/Usd 15m: STH, MTH, LTH grade sweeps, CHoCHs, Usage for finding bias, 3hrs later (part B):
Realtime Vs Backtesting(A): btc/usd 15m; FVGs and CHoCHs: shrink on fill, once filled they repaint discreetly on their origin bar only. Realtime (Shrink on fill, declutter chart):
Realtime Vs Backtesting(B): btc/usd 15m; FVGs and CHoCHs: DON'T shrink on fill; they extend to the point where price crosses them, and fix/paint there. Backtesting (seeing historical behaviour):

Equilibrium╭━━━╮╱╱╱╱╱╱╭╮╱╭╮
┃╭━━╯╱╱╱╱╱╱┃┃╱┃┃
┃╰━━┳━━┳╮╭┳┫┃╭┫╰━┳━┳┳╮╭┳╮╭╮
┃╭━━┫╭╮┃┃┃┣┫┃┣┫╭╮┃╭╋┫┃┃┃╰╯┃
┃╰━━┫╰╯┃╰╯┃┃╰┫┃╰╯┃┃┃┃╰╯┃┃┃┃
╰━━━┻━╮┣━━┻┻━┻┻━━┻╯╰┻━━┻┻┻╯
╱╱╱╱╱╱┃┃
╱╱╱╱╱╱╰╯
Overview
Equilibrium is a tool designed to measure the buying & selling pressure in the market. It is depicted as a “pressure gauge” that automatically adjusts as new candles are formed, providing a real-time indication of who's on top right now, buyers or sellers?
Background
Supply & demand is considered to be the main driving force of our modern economies, where the interaction between the two parties(sellers & buyers) leads to the determination of the fair price for a given product. Stock markets are no exception, they operate very much based around the idea of supply & demand.
In simple terms, supply refers to the availability of a product, and demand is the willingness of consumers to buy that product at a given price. It is obvious that different vendors may sell the same product at slightly different prices, and similarly, different customers may choose to buy the same product from different vendors at varying prices. The idea is that the price is allowed to fluctuate from time to time, but in a free & fair market, the price will eventually settle down to a value that makes both the parties happy. Such a state is known as the “Price-Equilibrium”, and this process is also referred to as the market mechanism.
This is the basic assumption around which this tool is based, the market is always trying to move towards a state of equilibrium.
Calculations
This tool takes a simplistic approach to estimate the degree of imbalance between buyers & sellers, here’s a brief summary of how the pressure is calculated:
- We compute the total lengths of red & green candles for a given period, i.e. price range multiplied by the volume for that candle.
- Then the distribution of each type of candle is calculated.
- Assuming more red candles denote more selling pressure, and green candles denote buying pressure, the gauge is populated cell by cell.
- As the pressure on one side increases, the intensity of the cell color also increases, signifying the extent to which one side is dominating.
How to use it
- The indicator is designed as a pressure gauge that moves up(vertical alignment) or to the right(horizontal alignment) as the buying pressure increases, and moves down or to the left as the selling pressure increases. How it is to be used & applied, that completely depends on your trading methodology. But, the general idea is that we expect the market to be in a state of equilibrium, and if that is not the case the tool will highlight that, and this is also where the opportunity lies to find suitable trades.
- Just by having an idea about who’s dominating the market currently, a trader can also pick sides wisely. Remember, the market is always striving to come back a state of equilibrium, and a slight imbalance can indicate the current trend, and more importantly, who’s more likely to make the next move.
User Settings
The tool offers some minimal configurations for the end user:
- You can choose to display the actual percentage value in the gauge(Show Text).
- You can adjust colors that denote buyers & sellers.
- You can change the layout of gauge, default is vertical(right side of the screen).
- Last, and most important, you can adjust the number of candles to traverse for calculating the pressure. Default is 50, can go upto 1000.
Trail Blaze - (Multi Function Trailing Stop Loss) - [mutantdog]Shorter version:
As the title states, this is a 'Trailing Stop' type indicator, albeit one with a whole bunch of additional functionality, making it far more versatile and customisable than a standard trailing stop.
The main set of features includes:
Three independent trailing types each with their own +/- multipliers:
- Standard % change
- ATR (aka Supertrend)
- IQR (inter-quartile range)
These can be used in isolation or summed together. A subsequent pair of direction specific multipliers are also included.
Two separate custom source inputs are available, both feature the standard options alongside a selection of 'weighted inputs' and the option to use another indicator (selected via 'AUX'):
- 'Centre' determines the value about which the trailing sum will be added to define the stop level.
- 'Trigger' determines the value used for crossing of stops, initiating trend changes and triggering alerts.
A selection of optional filters and moving averages are available for both.
Furthermore there are various useful visualisation options available, including the underlying bands that govern the stop levels. Preset alerts for trend reversals are also included.
This is not really an 'out-of-the-box' indicator. Depending upon the market and timeframe some adjustments will be necessary for it to function in a useful manner, these can be as simple or complex as the feature-set allows. Basic settings are easy to dial in however and the default state is intended as a good starting point. Alternatively with some experimentation, a plethora of unique and creative configurations are possible, making this a great tool for tweaking. Below is a more detailed overview followed by a bunch of simple example settings.
------------------------
Lengthy Version :
DESIGN & CONCEPT
Before we start breaking this down, a little background. This started off as an attempt to improve upon the ever-popular Supertrend indicator. Of course there are many excellent user created variants available utilising some interesting methods to overcome the drawbacks of the basic version. To that end, rather than copying the work of others, the direction here shifted towards a hybrid trailing stop loss with a bunch of additional user customisation options. At some point, a completely different project involving IQR got morphed into this one. After sitting through months of sideways chop (where this proved to be of limited use), at the time of publication the market has began to form some near term trend direction and it appears to be performing well in many different timeframes.
And so with that out of the way...
INPUTS
The standard Supertrend (and most other variants) includes a single source input, as default set to 'hl2' (candle mid-range). This is the centre around which the atr bands are added/subtracted to govern the stop levels. This is not however the value which is used to trigger the trend reversal, that is usually hard-coded to 'close'. For this version both source values are adjustable: labelled 'centre' and 'trigger' respectively.
Each has custom input selectors including the usual options, a selection of 'weighted inputs' and the option to use another indicator (selected from the Aux input). The 'weighted inputs' are those introduced in Weight Gain 4000, for more details please refer to that listing. These should be treated as experimental, however may prove useful in certain configurations. In this case 'hl-oc2' can be considered an estimate of the candle median and may be a good alternative to the default 'centre' setting of 'hl2', in contrast 'cc-ohlc4' can tend to favour the extremes in the trend direction so could be useful as a faster 'trigger' than the default 'close'.
To cap them off both come with a selection of moving average filters (SMA, EMA, WMA, RMA, HMA, VWMA and a simple VWEMA - note: not elastic) aswell as median and mid-range. 'Centre' can also be set to the output of 'trigger' post-filter which can be useful if working with fast/slow crosses as the basis.
DYNAMICS
This is the main section, comprised of three separate factors: 'TSL', 'ATR' and 'IQR'. The first two should be fairly obvious, 'TSL' (trailing stop loss) is simply a percentage of the 'centre' value while 'ATR' (average true range) is the standard RMA-based version as used in Supertrend, Volatility Stop etc.
The third factor is less common however: 'IQR' (inter-quartile range). In case you are unfamiliar the principle here is, for a given dataset, the greatest 25% and smallest 25% of samples are removed. The remainder is then treated as a set and the range is calculated by highest - lowest. This is a commonly used method in statistical analysis, by removing the extremes it is less prone to influence by outliers and gives a good representation of the main dispersion around the median. In practise i have found it can be a good alternative to ATR, translating better across multiple time-frames due to it representing a fraction of the total range rather than an average of per-candle range like ATR. Used in combination with the others it can also add a factor more representative of longer-term/higher-timeframe trend. By discarding outliers it also benefits from not being impacted by brief pumps/volatility, instead responding only to more sustained changes in trend, such as rallies and parabolic moves. In order to give an accurate result the IQR is calculated using a dataset of high, low and hlcc4 values for all bars within the lookback length. Once calculated this value is then halved which, strictly speaking, makes it a semi-interquartile range.
All three of these components can be used individually or summed together to create a hybrid dynamics factor. Furthermore each multiplier can be set to both positive and negative values allowing for some interesting and creative possibilities. An optional smoothing filter can be applied to the sum, this is a basic SWMA-4 which is can reduce the impact of sudden changes but does incur a noticeable lag. Finally, a basic limiter condition has been hard-coded here to prevent the sum total from ever going below zero.
Capping off this section is a pair of direction multipliers. These simply take the prior dynamics sum and allow for further multiplication applied only to one side (uptrend/lo-stop and downtrend/hi-stop). To see why this is useful consider that markets often behave differently in each direction, we've all seen prices steadily climb over several weeks and then abruptly dump in the process of a day or two, shorter time frames are no stranger to this either. A lack of downside liquidity, a panicked market, aggressive shorts. All these things contribute to significant differences in downward price action. This function allows for tighter stops in one direction compared to the other to reflect this imbalance.
VISUALISATIONS
With all of these options and possibilities, some visual aids are useful. Beneath the dynamics' section are several visual options including both sources post-filter and the actual 'bands' created by the dynamics. These are what govern the stop levels and seeing them in full can help to better understand what our various configurations actually do. We can even hide the stop levels altogether and just use the bands, making this a kind of expanded Keltner Channel. Here we can also find colour and opacity settings for everything we've discussed.
EXAMPLES
The obvious first example here is the standard %-change trailing stop loss which, from my experience, tends to be the best suited for lower time frames. Filtering should probably minimal here. In both charts here we use the default config for source inputs, the top is a standard bi-directional setup with 1.5% tsl while the bottom uses a 2.5% tsl with the histop multiplier reduced to 0 resulting in an uptrend only stoploss.
Shown here in grey is the standard Supertrend which uses 'hl2' as centre and 'close' as trigger, ATR(10) multiplied by 3. On top we have the default filtered source config with ATR(8) multiplied by 2 which gives a different yet functionally similar result, below is the same source config instead using IQR(12) multiplied by 2. Notice here the more 'stepped' response from IQR following the central rally, holding back for a while before closing in on price and ultimately initiating reversal much sooner. Unlike ATR, the length parameter for IQR is absolute and can more significantly affect its responsiveness.
Next we focus on the visualisation options, on top we have the default source config with ATR(8) multiplied by 2 and IQR(12) multiplied by 1. Here we have activated the switch to show 'bands', from this we can see the actual summed dynamics and how it influences the stop levels. Below that we have an altogether different config utilising the included filters which are now visible. In this example we have created a basic 8/21 EMA cross and set a 1% TSL, notice the brief fakeout in the middle which ordinarily might indicate a buy signal. Here the TSL functions as an additional requirement which in this case is not met and thus no buy signal is given.
Finally we have a couple of more 'experimental' examples. On top we have Lazybear's 'Variable Moving Average' in white which has been assigned via 'aux' as the centre with no additional filtering, the default config for trigger is used here and a basic TSL of 1.5% added. It's a simple example but it shows how this can be applied to other indicators. At the bottom we return to the default source config, combining a TSL of 8% with IQR(24) multiplied by -2. Note here the negative IQR with greater length which causes the stop to close in on price following significant deviations while otherwise remaining fairly wide. Combining positive and negative multiples of each factor can yield mixed results, some more useful than others depending upon suitable market conditions.
Since this has been quite lengthy, i shall leave it there. Suffice to say that there are plenty more ways to use this besides these examples. Please feel free to share any of your own ideas in the comments below. Enjoy.

coates moving averages (cma)This indicator uses three moving averages:
2 period low simple ma
2 period high simple ma
9 period least squares ma
The trend is determined by the angle of the moving averages, current close relative the the 9 least squares ma (lsm) and the current close relative to the prior two periods high and low.
When there are consecutive closes inside the prior two candles high and low then a range is signaled:
In ranges the buy zone is between the lowest low and the lowest close of the current range. The sell zone is between the highest high and the highest close. The zones are adjusted as long as the new close is within the prior two candles range:
When price closes above the 2 high ma and the 9 lsm then a bull trend is signaled if all moving averages are angled upward (as seen at #4 in the chart above and #1 the chart below ). If the 9 lsm and / or the 2 low ma continue to angle downward, following a close above the 2 high ma and 9 lsm, then a prolonged range or reversal is expected (#2 in the chart below):
During a bull trend the buy zone is between the 2 low ma and the 9 lsm. The profit target is the 2 high ma:
During dip buying opportunities price should resist closing below the 9 lsm. If there is one close below the 9 lsm then it is a canary in the coalmine that tells us to proceed with caution. This will often signal a range, based on the conditions outlined above. To avoid a prolonged range, or reversal, price needs to immediately react in the direction of the prevailing trend:
If the moving averages are angled down and the most recent close is below the 2 low ma and 9 lsm then trend is fully bearish:
During a bear trend the short zone is between the 2 high ma and 9 lsm. The profit target is the 2 low ma:
When the 2 high ma angles down and the 2 low ma angles up while price closes inside both mas then it indicates a cma squeeze:
Volatility is expected in the direction of the breakout following the squeeze. In this situation traps / shakeouts are common. If there is a wick outside the cma, with a close inside, then it indicates a trap / shakeout. If there is a close outside the 2 high / low ma then it signals a breakout.
A trend is considered balanced when the 9 lsm is roughly equidistant from the 2 low and 2 high mas. If the 9 lsm crosses the 2 high or 2 low ma then it signals exhaustion / imbalance.
For a stop loss I use the prior three periods low, for bull trends, and the prior three periods high for bear trends. I would expect other reliable stops, such as the parabolic sar or bill williams fractal, to be effective as well. The default moving averages should be very effective on all timeframes and assets classes, however this indicator was developed for bitcoin with a focus on higher timeframes such as the 4h, daily and weekly.
As with any other technical indicator there will be bad signals. Proceed with caution and never risk more than you are willing to lose.

ICT Liquidity Sweep/Swing Fail Pattern V.1# ICT Liquidity Sweep/Swing Fail Pattern V.1
## Indicator Description & User Guide
---
## 📊 Indicator Overview
**Name:** ICT Liquidity Sweep/Swing Fail Pattern V.1
**Type:** Support/Resistance & Liquidity Detection
**Trading Style:** ICT Concepts (Inner Circle Trader)
**Best Timeframes:** 1M, 5M, 15M, 1H
---
## 🎯 Core Features
### 1. **Support & Resistance Lines**
- Automatically draws key swing high and swing low levels
- Based on significant pivot points in price structure
- Updates dynamically as new swings form
### 2. **"X" Mark - Liquidity Sweep**
- **Symbol:** X marker on chart
- **Meaning:** Indicates a liquidity sweep (stop hunt)
- **What it shows:** Price briefly moved beyond a key level to trigger stops, then reversed
- **Trading significance:** High-probability reversal zones after liquidity is taken
### 3. **"SFP" Label - Swing Failure Pattern**
- **Symbol:** SFP text label
- **Meaning:** Swing Failure Pattern detected
- **What it shows:** Price attempted to make a new high/low but failed and reversed sharply
- **Trading significance:** Strong reversal signal - smart money rejecting the level
---
## 📈 How to Use This Indicator
### Entry Setup Strategy:
#### **For SHORT Trades (Sell):**
1. Wait for **SFP** to appear at a swing high
2. Look for **X marker** confirming liquidity sweep above the high
3. **Entry Zone (Red Box):** Enter SHORT positions when price returns to this zone
4. **Stop Loss:** Place above the red zone (above the swept high)
5. **Take Profit (Green Box):** Target the green zone below
#### **For LONG Trades (Buy):**
1. Wait for **SFP** to appear at a swing low
2. Look for **X marker** confirming liquidity sweep below the low
3. **Entry Zone (Green Box):** Enter LONG positions when price returns to this zone
4. **Stop Loss:** Place below the green zone (below the swept low)
5. **Take Profit (Red Box):** Target the red zone above
---
## 🎨 Color Coding System
| Color | Zone Type | Usage |
|-------|-----------|-------|
| 🔴 **Red Box** | Stop Loss / Supply Zone | Place SL here for LONG trades / Entry zone for SHORT trades |
| 🟢 **Green Box** | Take Profit / Demand Zone | Target zone for LONG trades / Place SL here for SHORT trades |
| ❌ **X Mark** | Liquidity Sweep Point | Stop hunt occurred - reversal likely |
| 📝 **SFP Label** | Swing Failure Pattern | Failed breakout - strong reversal signal |
---
## 💡 Trading Examples
### Example 1: SHORT Trade (As shown in your chart)
```
1. SFP appears at swing high (Red zone around 4,000)
2. X marker confirms liquidity sweep above the high
3. Entry: SHORT when price re-enters red zone
4. Stop Loss: Above red zone (e.g., 4,002)
5. Take Profit: Green zone below (3,964-3,972)
6. Risk:Reward = 1:3+
```
### Example 2: LONG Trade
```
1. SFP appears at swing low (Green zone)
2. X marker confirms liquidity sweep below the low
3. Entry: LONG when price re-enters green zone
4. Stop Loss: Below green zone
5. Take Profit: Previous red zone above
6. Risk:Reward = 1:2 minimum
```
---
## ⚠️ Important Trading Rules
### ✅ DO:
- Wait for BOTH SFP and X marker confirmation
- Enter on price returning to the zone (not on first touch)
- Use proper position sizing (1-2% risk per trade)
- Combine with market structure analysis
- Look for confluences (orderblocks, fair value gaps)
### ❌ DON'T:
- Trade against the higher timeframe trend
- Enter without confirmation signals
- Ignore the colored zones for SL/TP placement
- Overtrade - wait for quality setups
- Move stop loss to breakeven too early
---
## 🔧 Indicator Settings (Typical)
**Adjustable Parameters:**
- Swing Length: Number of bars to identify swing points
- Show/Hide X markers
- Show/Hide SFP labels
- Zone opacity and colors
- Line thickness
---
## 📚 ICT Concepts Explained
### **Liquidity Sweep:**
Smart money intentionally pushes price beyond key levels to trigger retail stop losses, then reverses to their intended direction. The X marker identifies these moments.
### **Swing Failure Pattern (SFP):**
Price attempts to make a new high/low but lacks follow-through, indicating weak momentum and likely reversal. Similar to a "false breakout" but more specific to swing structures.
### **Supply & Demand Zones:**
- **Red zones** = Areas where selling pressure overwhelmed buyers
- **Green zones** = Areas where buying pressure overwhelmed sellers
- These zones act as magnets for price to return and react
---
## 🎓 Best Practices
1. **Confluence is Key:**
- Combine with daily/weekly bias
- Check for orderblocks nearby
- Look for imbalances (FVG)
2. **Session Timing:**
- Best during London/New York sessions
- Avoid low liquidity periods
3. **Risk Management:**
- Never risk more than 1-2% per trade
- Use proper lot sizing
- Take partial profits at key levels
4. **Timeframe Correlation:**
- Check higher timeframe for bias
- Enter on lower timeframe for precision
- Exit based on higher timeframe targets
---
## 📞 Support & Updates
**Version:** 1.0
**Compatibility:** TradingView Pine Script v5
**Updates:** Regular improvements based on ICT methodology
---
## ⚡ Quick Reference Card
| Signal | Action | SL Placement | TP Target |
|--------|--------|--------------|-----------|
| SFP + X at High | SHORT at Red Zone | Above Red | Green Zone |
| SFP + X at Low | LONG at Green Zone | Below Green | Red Zone |
**Remember:** The indicator shows you WHERE to trade, but YOU decide WHEN based on confirmation and market context.
---
*Disclaimer: This indicator is a tool for technical analysis. Always use proper risk management and never trade with money you cannot afford to lose.*

JMA Cluster Entries with Market Structure [WavesUnchained]JMA Cluster Entries with Market Structure
Overview
JMA Cluster Entries with Market Structure combines multi-timeframe JMA (Jurik Moving Average) cluster analysis with advanced market structure detection (Wyckoff methodology, Smart Money Concepts) to identify high-probability momentum and structure-based entries. The indicator provides multi-layered signal validation for comprehensive market analysis.
Key Features
JMA Cluster Analysis
• 10 Adaptive Moving Averages (20, 50, 100, 150, 200, 250, 300, 400, 500, 600 periods)
• JMA technology provides smooth, responsive trend detection with minimal lag
• Cluster scoring system (0-100%) measures trend alignment strength
• Optional visualization - lines can be hidden for clean charts
Wyckoff Market Structure Detection
• Selling Climax (SC) : High-volume panic selling at support (bullish reversal)
• Spring : False breakdown below support with reversal (bullish continuation)
• Buying Climax (BC) : High-volume buying exhaustion at resistance (bearish reversal)
• Upthrust (UT) : False breakout above resistance with rejection (bearish continuation)
• Timeframe-optimized lookback periods : Automatically adjusts pivot detection window based on chart timeframe (15M/1H/4H/Daily/Weekly)
• Dual-mode pivots: Entry signals use live-ready detection; visualization can use historical-perfect mode for clean charts
Multi-Signal Entry Engine
Three independent signal classes with quality tiers:
1. MOMENTUM (M) : Cluster flip + slope confirmation + ATR filter
2. EXHAUSTION (E) : Mean reversion at statistical extremes + volume surge
3. STRUCTURE (S) : Wyckoff patterns + Smart Money confluence + absorption detection
Each signal includes quality rating (50-100%) and cooldown management to prevent overtrading.
Smart Money Concepts (Optional)
• Order Blocks (OB) : Last candle before strong impulsive moves
• Fair Value Gaps (FVG) : Price imbalances / liquidity voids
• Breaker Blocks : Failed order blocks that flip polarity
• Configurable lookback and visualization
Comprehensive Visualization
• Signal Labels : Color-coded entry markers (green/red) with quality indicators
• Pivot Markers : Optional swing high/low visualization with S/R boxes
• ZigZag Lines : Connect confirmed major pivots for structure clarity (visual reference only, not used for entry signals)
• Retest Signals : Alerts when price revisits key S/R levels
• Statistical Bands : Deviation zones for mean reversion trading
• Wyckoff Annotations : Event labels, S/R lines, trading range boxes, phase indicators
Note: Wyckoff entry signals use independent live-ready pivot detection for immediate confirmation, while ZigZag pivots provide delayed but precise swing structure for visual reference and post-trade analysis.
Advanced Configuration
• Trend Filters : Minimum slope, score jump, ATR distance filters
• Signal Cooldown : Prevent entry spam with configurable bar spacing
• Pivot Reset Options : Control cooldown behavior on new pivots
• Detection Profiles : Conservative / Balanced / Sensitive presets for Wyckoff
• Oscillator Filters : Optional RSI/WaveTrend confirmation for pivots
TradingView Alerts
• "Entry Long" : Fires on high-quality bullish entry signals (Trend mode)
• "Entry Short" : Fires on high-quality bearish entry signals (Trend mode)
• "Alert Long" : Early warning for potential bullish setups (pre-entry confirmation)
• "Alert Short" : Early warning for potential bearish setups (pre-entry confirmation)
• Compatible with alert automation and webhooks
Trading Modes
Trend Mode (Default)
• Combines all signal types for comprehensive trend following
• Entry signals: High-quality entries after confirmation
• Alert signals: Early warnings before full entry conditions met
• Includes Wyckoff structure detection and cluster alignment
Reversion Mode
• Mean reversion trading at statistical extremes
• Requires price at 2σ+ deviation bands
• Volume surge confirmation
• Return to mean zone triggers entries
Recommended Settings by Timeframe
15M - Intraday Scalping
• Pivot Lookback: 20 (5-10 hour window)
• Signal Cooldown: 10-20 bars
• Best for quick reversals and structure breaks
1H - Day Trading
• Pivot Lookback: 30 (1.25 day window)
• Signal Cooldown: 15-25 bars
• Highest volume quality (avg 2.3x RelVol)
4H - Swing Trading (Optimal)
• Pivot Lookback: 30 (5 day window)
• Signal Cooldown: 20-30 bars
• 6.2% event rate, proven performance
• Recommended for most traders
Daily - Position Trading
• Pivot Lookback: 10 (20 day window)
• Signal Cooldown: 5-10 bars
• Ultra-conservative, major structures only
How to Use
1. Enable JMA Lines initially to understand cluster behavior
2. Watch for Signal Labels : Green (Long), Red (Short)
3. Check Signal Quality : Labels show M/E/S class and 50-100% rating
4. Confirm with Wyckoff : SC/Spring for longs, BC/UT for shorts
5. Set TradingView Alerts : Use "Signal Long" and "Signal Short" alerts
6. Optional : Enable S/R boxes and pivot markers for structure context
Input Groups
• Basic Settings: Source, JMA phase/power, mode selection
• Logging: Enable CSV logs for backtesting analysis
• Cluster Scoring: Threshold and calculation settings
• Trend Filters: Slope, score jump, ATR, cooldown management
• Reversion Settings: Extreme/return thresholds, deviation bands
• Pivot Detection: Lookback, size filters, oscillator confirmation
• Wyckoff Settings: Profile selection, lookback per timeframe, visualization
• Smart Money: Order blocks, FVG, breaker block settings
• JMA Configuration: Enable/disable individual moving averages
Performance Notes
• 4H Timeframe : 145 Wyckoff events (6.16% rate), 78.7% win rate in backtests
• 1H Timeframe : 84 events (1.86% rate), 2.33x average RelVol
• 15M Timeframe : 83 events (1.87% rate), balanced event distribution
• Daily Timeframe : 7 events (1.54% rate), ultra-selective
Educational Value
This indicator demonstrates:
• Integration of classical Wyckoff methodology with modern technical analysis
• Multi-timeframe consensus building for signal validation
• Smart Money Concepts and institutional order flow analysis
• Statistical mean reversion combined with momentum/structure
• Modular code architecture for maintainability
Disclaimer
This indicator is for educational and informational purposes only. It does not constitute financial advice. Always practice proper risk management and test strategies thoroughly before live trading. Past performance does not guarantee future results.
Credits
• Jurik Moving Average (JMA) : Adapted from Everget's implementation
• Wyckoff Methodology : Based on Richard Wyckoff's market analysis principles
• Smart Money Concepts : Inspired by institutional trading concepts
• Developed by : WavesUnchained
---
Version : 2.1.0
Pine Script : v6
Compatibility : TradingView Free/Pro/Premium
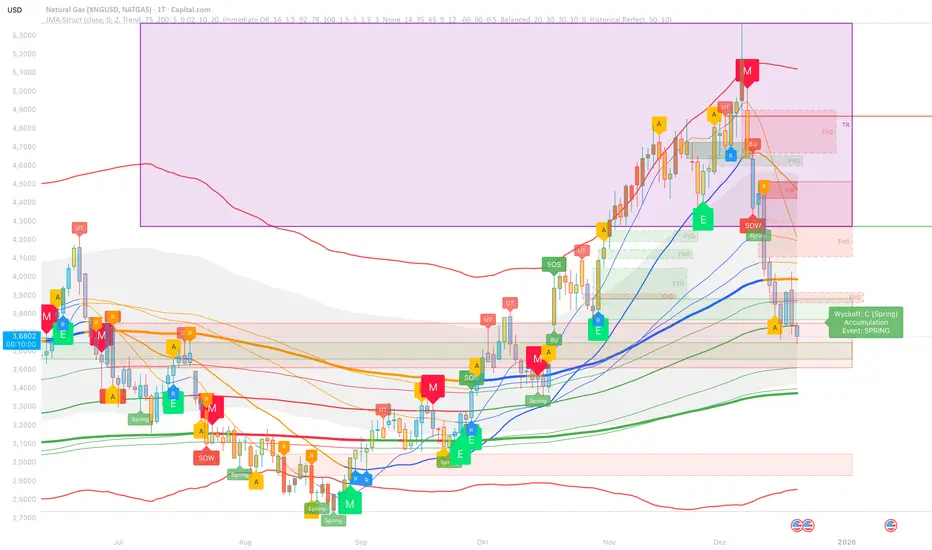
FVG pointsFVGs ( fair value gaps) are imbalances that indicate displacement and are useful for reversal strategies that require displacement after a liquidity sweep
This indicator shows the size of the gap in points/dollars which can help determine momentum and strength in reversals, as does a failure or inversion (iFVG) of these gap if they fail to act as support or resistance to price. As stops are often placed on the other side of a fair value gap from entry, the indicator helps give traders an idea of stop loss size for calculating position size.
Fvg gaps below a certain points size can be considered to be weaker, larger gaps show stronger momentum. The indicator allows a minimum point size to be set so that FVGs below this minimum value will be shown without a points value.
Points value is also shown for inverted FVGs (iFVGs) by a change in colour and length of box.
By default, multiple gaps are combined together and the point value of the gap is shown, this can be toggled off in the settings to show the values of the individual gaps.
Settings:
Lookback - how many candles to look for FVGs and iFVGs
Change length of the FVG box
Change settings to decide the minimum size of gap to label
colours of boxes and labels
Option to show individual gaps or combined gaps

ICT Candle Reading PROICT Candle Reading – Visual Clean
This indicator is designed to provide a clean and precise price reading, based on ICT and Smart Money Concepts, without cluttering the chart.
Its purpose is to help traders identify real institutional zones, understand market intention, and improve entry timing, using pure price action.
🔹 What does this indicator show?
🟢 Fair Value Gaps (FVG / Imbalances)
Detects market inefficiencies created by impulsive moves.
Displayed as clean and minimal boxes extended into the future.
Useful as mitigation, reaction, or continuation zones.
🟠 Liquidity Sweeps
Highlights liquidity grabs above recent highs or below recent lows.
Drawn using dashed horizontal lines.
Helps identify market manipulation before the true move.
🔵 Displacement Candles
Identifies candles with dominant bodies, showing institutional momentum.
Marked with small symbols to keep the chart clean.
Useful to confirm impulse starts or shifts in market intent.
🎯 Indicator Philosophy
❌ No lagging indicators
❌ No chart clutter
✅ Real ICT concepts
✅ Clean candle reading
✅ Suitable for scalping, intraday, and swing trading
⚙️ Customization
Each concept can be enabled or disabled individually.
Zone extension length is adjustable.
Optimized for 15M, 1H, and 4H timeframes.
📈 How to use
This indicator does not provide automatic buy/sell signals.
It is best used with:
Higher timeframe bias
Market structure
Session timing (London / New York)
Proper risk management
🧠 Final Notes
ICT Candle Reading – Visual Clean helps you see the market from an institutional perspective, focusing only on what truly matters: price, liquidity, and intent.

DeltaPulseDeltaPulse: Professional Cumulative Volume Delta Indicator
DeltaPulse is a free cumulative volume delta (CVD) indicator engineered for modern traders who demand precision, adaptability, and visual clarity. Unlike traditional CVD tools that often suffer from scaling issues, excessive noise, or poor responsiveness across timeframes, DeltaPulse delivers a streamlined, professional-grade solution that "just works" – providing actionable insights into buying and selling pressure with minimal setup.
This indicator accumulates the net difference between buying and selling volume (inferred from candle direction), normalizes it intelligently for consistent readability, and applies advanced smoothing to filter out market noise while preserving momentum signals. The result is a clean, momentum-colored line in a dedicated pane, enhanced by subtle visual cues that highlight key market dynamics.
Whether you're a day trader scalping intraday moves, a swing trader analyzing weekly trends, or an institutional analyst reviewing futures contracts, DeltaPulse adapts seamlessly to your workflow. It's designed to be your go-to tool for confirming trends, spotting divergences, and identifying order flow imbalances – all without the bloat of overcomplicated features.
Key Features
Intelligent Normalization for Universal Compatibility
Automatically adjusts scaling based on chart timeframe and symbol volume profile.
Intraday (1-5 min): Uses a 100-period volume average for responsive, lively signals.
Intraday (15+ min): 50-period average for balanced sensitivity.
Daily/Weekly+: 20-period average for clean, long-term perspective.
Ensures the indicator remains visually meaningful and non-flat on any asset – from low-volume penny stocks to high-liquidity indices like ES or NQ.
Advanced Smoothing Options
Six moving averages to match your trading style:
EMA - Quick reactions to recent delta shifts
SMA - Simple Moving Average - Stable, noise-resistant baseline
WMA - Weighted Moving Average - Emphasizes recent data with linear weighting
HMA - Hull Moving Average - Ultra-smooth yet lag-free – ideal for momentum trading
RMA - Running Moving Average (Wilder's) - Trend-following with minimal whipsaws
VWMA - Volume-Weighted Moving Average - Highlights high-volume delta moves
Lower values increase reactivity; higher values enhance smoothness.
Flexible Reset Mechanisms
Session Reset: Clears CVD at the first regular trading bar each day – perfect for intraday analysis.
Weekly Reset: Resets at the start of each new week – suited for swing and position trading.
No manual intervention required; the indicator handles resets reliably across all timeframes.
Background Shading:
Light green tint above zero; light red below.
Extreme highlights when smoothed CVD exceeds 90% of its 80-bar high/low – flags potential exhaustion or absorption zones.
How It Works
DeltaPulse calculates a simple yet effective volume delta on each bar:
Bullish Bar (close ≥ open): Adds full volume as positive delta.
Bearish Bar (close < open): Subtracts full volume as negative delta.
This raw delta accumulates into a running total (CVD), resetting based on your chosen mode. The total is then:
Normalized against a timeframe-adaptive volume average to ensure consistent scaling.
Smoothed using your selected MA type for noise reduction and trend clarity.
Plotted with momentum-based coloring and visual enhancements.
The output is a single, intuitive line that reveals the underlying battle between buyers and sellers – far more reliably than raw volume bars or basic oscillators.
Trading Applications
DeltaPulse shines in revealing order flow dynamics that price action alone often conceals. Here are proven ways to integrate it:
Trend Confirmation & Momentum Trading
Bullish Setup: Rising green line above zero confirms buyer control – enter longs on pullbacks to support.
Bearish Setup: Falling red line below zero signals seller dominance – short on rallies to resistance.
Zero Line Crosses as Reversal Signals
A crossover from negative to positive territory often marks a sentiment shift – use for entry triggers.
Combine with volume spikes or key levels for high-probability setups.
Enhancement: VWMA mode amplifies signals on high-volume breakouts.
Absorption & Exhaustion Zones
Watch for extreme background highlights: A spike to highs followed by reversal suggests large players absorbing supply.
Ideal for fade trades near overextended levels (e.g., after news events).
Avoid low-volume or illiquid symbols, as delta inference relies on reliable candle data.
Timeframe-Agnostic: Solves the common CVD pitfall of being "dead" on intraday charts or erratic on daily ones through smart, automatic normalization.
Lag-Free Responsiveness: The default HMA smoothing strikes a rare balance – smoother than EMA, faster than SMA – without the computational overhead of exotic filters.
Zero Clutter: No histograms, no extraneous plots, no overwhelming alerts. Just pure, distilled order flow intelligence.

Box TheoryBox Theory – Description
This indicator is based on the popular “Box Theory” concept, where the previous session’s High–Low range acts as the most important structure for the next session.
Traders use this because the market often reacts to the same areas where liquidity, orders, and imbalances were created in the prior session.
At every new session open, the indicator automatically records:
Previous High
Previous Low
Middle (50% level)
These three levels form a box, which becomes your roadmap for the new session.
This method is widely used because it highlights where most reversals, sweeps, and reactions occur—without needing any extra indicators.
How the Zones Are Calculated
Previous High
The highest price of the last session.
This forms the top edge, which acts as resistance and the basis for the Sell Zone.
Previous Low
The lowest price of the last session.
This forms the bottom edge, acting as support and the basis for the Buy Zone.
Middle Line (50% Level)
The exact midpoint between High and Low.
This is the fair-value zone, where price often consolidates and becomes directionless.
No signals are triggered near the middle, because trades taken here historically have low accuracy.
Buy Zone (Green Area)
The lower part of the box.
Price often reacts here because this area held buyers in the previous session.
When price enters this green zone inside the box, the indicator can show a Buy Zone label.
Sell Zone (Red Area)
The upper part of the box.
Price commonly rejects here because this area acted as resistance previously.
When price enters this red zone inside the box, the indicator can show a Sell Zone label.
How Zone Size Is Set (Sensitivity %)
You can adjust how big the Buy/Sell zones are using the Sensitivity (%) input.
Lower % → Smaller zones → More precise signals
Higher % → Larger zones → Signals appear earlier and from farther away
Formula:
Zone Size = (Previous High − Previous Low) × (Sensitivity % ÷ 100)
This lets you customize how tight or how early your signals appear.
Inside-Box Only Logic
The indicator only works inside the previous session’s range.
If price breaks above the previous High → No sell signal
If price breaks below the previous Low → No buy signal
This avoids false signals during breakouts or trending markets.
Alerts
The indicator includes two alerts:
Buy Zone Alert → Triggers when price enters the Buy Zone
Sell Zone Alert → Triggers when price enters the Sell Zone
Just enable them in TradingView’s alert panel.

MTF OB & FVG detector w/ Alerts v2# MTF Order Blocks & Fair Value Gaps Detector with Alerts v2
## Overview
This indicator combines **Multi-Timeframe Order Blocks (OB)** and **Fair Value Gaps (FVG)** detection with integrated bounce alerts. It displays Order Blocks and Fair Value Gaps across multiple timeframes simultaneously and generates real-time alerts when price bounces from these critical zones.
## Key Features
### 🎯 Multi-Timeframe Order Blocks Detection
- **Volumetric Analysis**: Each Order Block displays total volume and dominant side percentage
- **Multiple Timeframes**: Supports 1min, 3min, 5min, 15min, and 60min timeframes
- **Smart Combining**: Automatically merges overlapping Order Blocks from different timeframes into powerful confluence zones
- **Dynamic Extension**: Order Blocks extend until broken, providing clear visual guidance
- **Volume Distribution**: Shows bullish vs bearish volume breakdown with percentage
### 📊 Fair Value Gaps (FVG) Detection
- **Lightweight Processing**: Works on current chart timeframe only for optimal performance
- **Volume Metrics**: Displays FVG volume and dominant side percentage
- **Mitigation Tracking**: Automatically tracks when FVGs are filled or broken
- **Customizable Mitigation Source**: Choose between close price or high/low wicks
### 🔔 Comprehensive Alert System
- **Bounce Alerts**: Get notified when price bounces from OB or FVG zones
- **New Formation Alerts**: Alerts when new Order Blocks or Fair Value Gaps form
- **Combined Zone Alerts**: Special alerts when multiple Order Blocks merge into strong confluence zones
- **Customizable Thresholds**: Set minimum number of combined OBs required for strong zone alerts
### 🎨 Visual Customization
- **Inverted Color Schemes**: Optional inverted colors for both OB and FVG
- OB: Choose between traditional (Bullish=Blue, Bearish=Red) or inverted (Bullish=Red, Bearish=Blue)
- FVG: Choose between Bullish=Orange/Bearish=Aqua or inverted
- **Clean Labels**: Shows timeframe, zone type, volume, and dominant percentage
- **Combined Tags**: Optional labels for merged zones
- **Adjustable Extension**: Control how far zones extend into the future
## How It Works
### Order Blocks
Order Blocks identify institutional trading zones where large players have placed significant orders. The indicator:
1. Detects swing highs/lows using configurable swing length
2. Identifies the last opposing candle before a strong move
3. Analyzes volume distribution (bullish vs bearish)
4. Tracks zone validity until price breaks through
5. Combines overlapping zones from multiple timeframes
### Fair Value Gaps
Fair Value Gaps represent price imbalances that often get filled. The indicator:
1. Identifies 3-candle patterns with gaps between candles
2. Filters gaps by size percentile to show only significant ones
3. Calculates volume distribution within the gap
4. Tracks mitigation when price returns to fill the gap
5. Extends gaps dynamically until filled
### Bounce Detection
The indicator detects bounces using a two-step process:
1. **Touch Phase**: Tracks when price enters a zone (touchedInside flag)
2. **Bounce Phase**: Confirms bounce when price exits the zone in the expected direction
- Bullish zones: Price closes above top after touching inside
- Bearish zones: Price closes below bottom after touching inside
## Settings Guide
### General Configuration
- **Show Historic Zones**: Display invalidated/broken zones
- **Zone Invalidation**: Choose between wick or close for break detection
- **Combine Overlapping Order Blocks**: Merge OBs from different timeframes
- **Swing Length**: Controls sensitivity (smaller = more OBs, larger = fewer OBs)
- **Zone Count**: Choose from High/Medium/Low/One per timeframe
- **Invert Colors OB**: Swap bullish/bearish color scheme
### Alert Settings
- **Enable Alerts**: Master switch for all alerts
- **Alert on Bullish/Bearish Bounce**: Choose which bounce directions to monitor
- **Alert on New OB Formation**: Get notified when new Order Blocks form
- **Alert on Combined OBs**: Alerts for strong confluence zones
- **Min OBs for Strong Zone Alert**: Threshold for combined zone alerts (default: 2)
### Fair Value Gaps
- **Show Fair Value Gaps**: Toggle FVG display
- **FVG Mitigation Source**: Choose close or high/low for mitigation detection
- **Bullish/Bearish FVG**: Enable/disable each type
- **Invert FVG Colors**: Swap FVG color scheme
### Multi-Timeframe
- **Show Lower Timeframes**: Display OBs from timeframes lower than chart
- **Individual Timeframe Toggles**: Enable/disable 1min, 3min, 5min, 15min, 60min
### Style
- **Text Color**: Customize label text color
- **Extend Zones**: Set extension length in bars (default: 40)
- **Show Tag**: Display combined indicator in merged zone labels
## Usage Tips
### For Day Trading
- Enable 1min, 3min, and 5min timeframes
- Use "High" zone count for more trading opportunities
- Watch for bounces from combined zones (highest probability)
### For Swing Trading
- Enable 15min, 60min, and higher timeframes
- Use "Medium" or "Low" zone count for major zones only
- Focus on combined zones with 3+ timeframes
### For Scalping
- Use current timeframe only (disable MTF)
- Enable both OB and FVG
- Set up alerts for quick bounce notifications
### Alert Setup
1. Click "Create Alert" in TradingView
2. Choose from available alert conditions:
- **Bullish Bounce (OB/FVG)**: Long entry opportunities
- **Bearish Bounce (OB/FVG)**: Short entry opportunities
- **New OB Formation**: Early zone identification
- **Strong Combined Zone**: High-probability confluence areas
3. Set alert frequency to "Once Per Bar Close" to avoid false signals
## Technical Details
### Performance Optimizations
- Maximum 100 boxes/labels for efficient rendering
- Lightweight FVG processing on current timeframe only
- Dynamic memory management with array size limits
- Selective rendering of active zones only
### Calculations
- **ATR Multiplier**: Zones exceeding 3.5x ATR are filtered out
- **Volume Percentage**: `max(bullVol, bearVol) / totalVolume × 100`
- **FVG Size Filter**: Uses 100th percentile of last 1000 gaps
- **Overlap Detection**: Uses intersection/union ratio for combining zones
## Credits & License
This indicator combines and enhances concepts from:
- "Volumized Order Blocks" methodology
- "Volumatic Fair Value Gaps" approach
**License**: Mozilla Public License 2.0 (MPL-2.0)
## Disclaimer
This indicator is provided for **educational and informational purposes only**. Trading involves substantial risk of loss and is not suitable for every investor. Past performance is not indicative of future results. Always do your own research and consult with a licensed financial advisor before making trading decisions.
## Version History
**v2 (Current)**
- Combined OB and FVG into single indicator
- Added comprehensive alert system
- Improved performance with lightweight FVG processing
- Enhanced bounce detection with touch-inside logic
- Added volume metrics to zone labels
- Implemented dynamic zone extension until broken
- Added combined zone detection with configurable thresholds
---
### Chart Examples
The indicator displays:
- **Red Zones** (Inverted): Bullish Order Blocks / Bearish FVGs
- **Blue Zones** (Inverted): Bearish Order Blocks / Bullish FVGs
- **Orange Zones** (Inverted): Bullish Fair Value Gaps
- **Aqua Zones** (Inverted): Bearish Fair Value Gaps
Each zone shows:
- Timeframe label (e.g., "5m", "15m", "1H")
- Zone type (OB or FVG)
- Total volume in millions (e.g., "12.5M")
- Dominant side percentage (e.g., "85%")
**Example Label**: ` 5m & 15m OB 45.2M (78%)`
- Combined zone from 5min and 15min timeframes
- Order Block type
- 45.2 million total volume
- 78% volume on dominant side
---
## Support & Updates
For issues, suggestions, or questions, please leave a comment on the indicator page.
**Author**: © rasukaru666
**Compatible with**: TradingView Pine Script v6
